3901
FMRI response representation associated with lower space structure of scene perception1University of electronic science and technology of China, Chengdu, China
Synopsis
This study identified the similarity of fMRI-based brain activity in certain scene-selective regions associated with scene categories and low-level spatial structure. In addition, similar hierarchy was found between fMRI response and convolution neural network features of different layers. The results may provide new insights to the processing of lower and high-level knowledge, as well as the performance-optimized hierarchical models.
Introduction
The scene-selective regions (SSR) of the brain plays an important role in the navigation and identification of the visual environment 1. Previous neuroimaging investigations have identified specific brain regions involved in scene perception, such as parahippocampal place area (PPA), lateral occipital complex (LOC) and retrosplenial complex (RSC) 2, 3. Although these regions were sensitive to scene categories, how these regions accomplish the diverse functions in scene identification is unclear. In this study, in order to solve the response of the SSR associated with the low-level spatial frequency mode and high-level semantic category, the characterization of similarity analysis for different response pattern and lower space structure of regional features were analyzed to quantify the correlation of the two attributes. Moreover, the relationship between the human vision and convolution neural network (CNN) was detected to explore the human visual hierarchy system for scene image response model and the neurophysiological basis of CNN.Methods
Images from four different scene categories (mountains, forests, cities and streets), and three versions of each image (a full-spectrum unfilterd version; a low spatial frequency version, and high spatial frequency version) were used as the visual stimuli during fMRI scanning. Moreover, additional localizer experiment was also conducted 2. After fMRI data preprocessing, fMRI response related to certain stimuli was obtained based on the generalized linear model, and thus, the PPA, LOC, RSC, occipital place area (OPA) as well as primary visual area (V1) were identified. By comparing the activity patterns associated with each pair of experimental conditions, the representational dissimilarity matrix (RDM) can be obtained. RDM associated with stimuli conditions including low-level properties, i.e., spatial frequency property and GIST descriptor of images, as well as categories was also analyzed 4, 5. In order to investigate the relationship between scene selective brain regions and convolutional neural network (CNN), the correlation between RDM of brain activity and RDM of classic CNN features were performed.Results
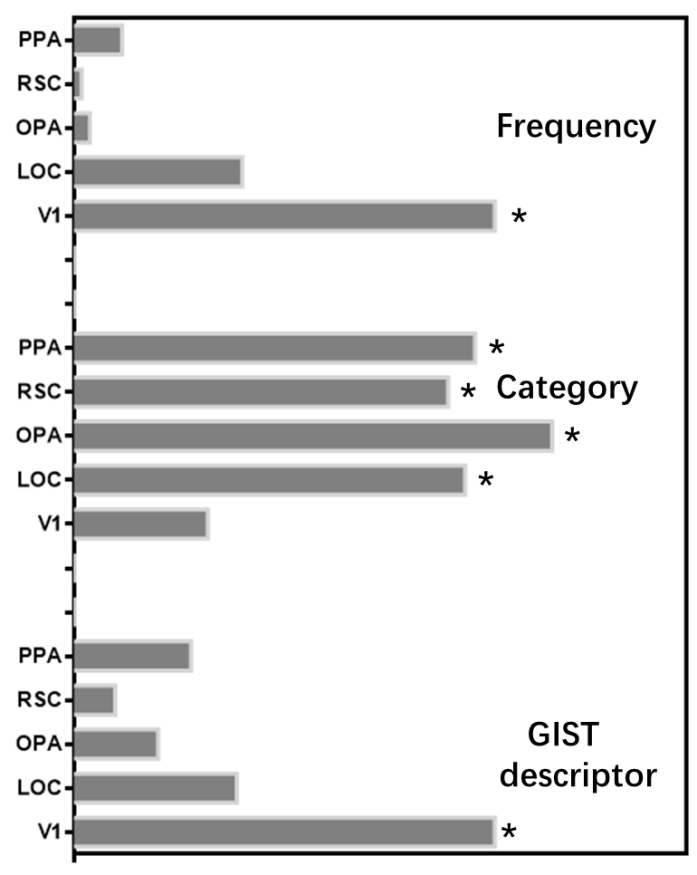
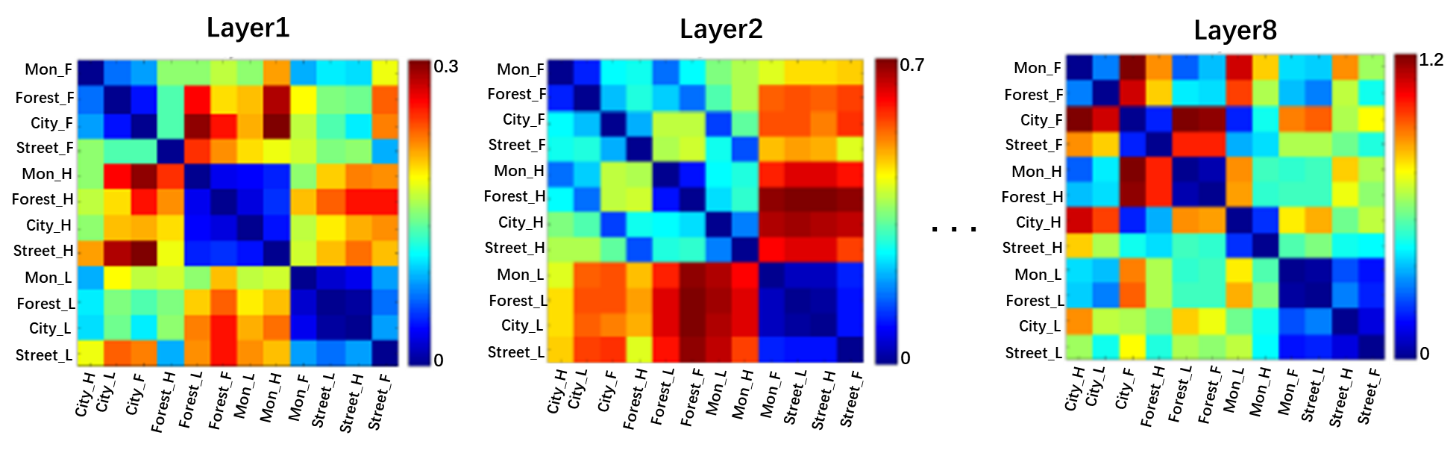
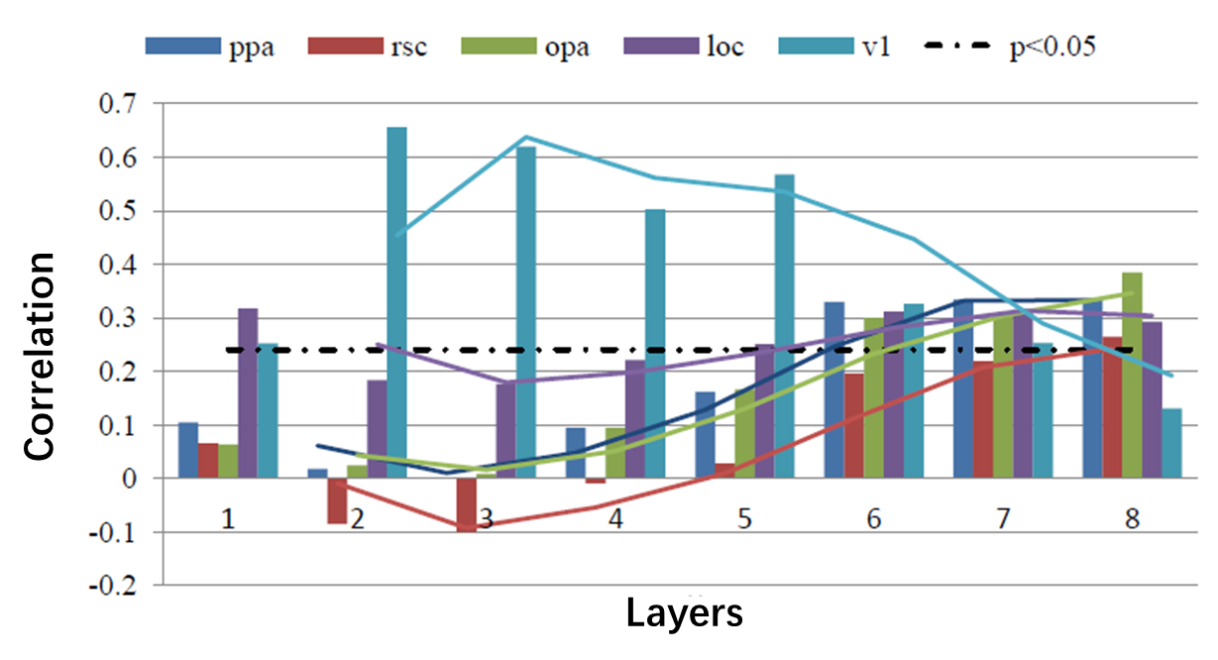
The SSRs including PPA, RSC, OPA, LOC and V1 were identified according to functional localizer experiment. In Figure 1, the tree view illustrated the RDM of brain activity in SSRs associated with all pairs of conditions5, 6. Stronger similarity of brain activity was revealed for the same category in PPA, OPA, RSC and LOC region no matter what frequency version the image was. Whereas, V1 reflected sensitivity to frequency changes comparing to category. In addition, the dissimilarity of brain activity in V1 was significantly correlated with both spatial frequency and GIST descriptor (P<0.01) (Figure 2). In the other hand, activity in PPA, RSC, OPA and LOC was found significantly correlated with category (P<0.01). The association analysis for SSR and CNN showed that PPA and OPA was significantly correlated with the features in the last three full connectivity layers (P<0.01) (Figure 3). RSC reflected progressive correlation with CNN layers, and achieved the largest correlation in the final layer. While V1 had significant correlation with the first five layers in CNN, and this correlation diminished in the following three layers. LOC reflected much stable correlation with most of CNN layers, which indicated the integrative role of LOC in visual information processing.Discussion
The hierarchical nature of visual system in both dorsal and ventral pathways provides the basis for the presentation of scene and object2, 7. Visual information processing starts with the collections of low-level features, such as the spatial frequency, colors, orientations, and then, semantically higher-level concepts, such as category were accessed based on the neural computations of these integrative features8. While, the SSRs played an important role in integrating the visual information for use of navigating our world. In order to investigate the dissimilarity relationship for brain responses associated with low-level, as well as the higher-level concepts of images, this study used spatial frequency properties and category as the condition stimuli 9, 10. The results showed that PPA, OPA, RSC and LOC were more sensitive to category of the stimuli no matter what frequency version the image was. Whereas, V1 reflected sensitivity to frequency changes as well as the envelope shape comparing to category. The result was in line with the hierarchy of visual system. V1 as an early stage in the visual pathway, has the capacity to extract low-level properties of visual stimuli. The high-level stimulus properties such as the semantic presentation were involved in the late processing of neural networks. Probing the relationship between fMRI response representations and CNN representations can provide new insights to the performance-optimized hierarchical models, as well as the processing of high-level cognitive knowledges 11, 12.Conclusion
In this study, we identified the similarity of brain activity in certain scene-selective regions associated with scene categories and low-level spatial frequency. According to hierarchy clustering and correlation analysis, PPA, OPA, RSC and LOC region showed more sensitivity to image category, whereas, V1 reflected sensitivity to spatial frequency and envelope information rather than category. In addition, similar hierarchy was found between brain activity and CNN features in different layers.Acknowledgements
This work is supported in part by the National Key Research and Development Program of China (No. 2016YFC0100800 and 2016YFC0100802) .References
1. Walther DB, Caddigan E, Fei-Fei L, Beck DM. Natural Scene Categories Revealed in Distributed Patterns of Activity in the Human Brain. Journal of Neuroscience 2009;29:10573-10581.
2. Peissig JJ, Tarr MJ. Visual object recognition: Do we know more now than we did 20 years ago? Annu Rev Psychol 2007;58:75-96.
3. Eger E, Ashburner J, Haynes JD, Dolan RJ, Rees G. fMRI activity patterns in human LOC carry information about object exemplars within category. Journal of cognitive neuroscience 2008;20:356-370. 4. Nili H, Wingfield C, Walther A, Su L, Marslen-Wilson W, Kriegeskorte N. A Toolbox for Representational Similarity Analysis. Plos Comput Biol 2014;10.
5. Edelman S, Grill-Spector K, Kushnir T, Malach R. Toward direct visualization of the internal shape representation space by fMRI. Psychobiology 1998;26:309-321.
6. Oliva A, Torralba A. Modeling the shape of the scene: A holistic representation of the spatial envelope. Int J Comput Vision 2001;42:145-175.
7. Nishida S. Advancement of motion psychophysics: Review 2001-2010. J Vision 2011;11.
8. Berman D, Golomb JD, Walther DB. Scene content is predominantly conveyed by high spatial frequencies in scene-selective visual cortex. PloS one 2017;12.
9. Kauffmann L, Ramanoel S, Peyrin C. The neural bases of spatial frequency processing during scene perception. Frontiers in integrative neuroscience 2014;8:37.
10. Schindler A, Bartels A. Visual high-level regions respond to high-level stimulus content in the absence of low-level confounds. NeuroImage 2016;132:520-525.
11. Scholte HS, Losch MM, Ramakrishnan K, de Haan EHF, Bohte SM. Visual pathways from the perspective of cost functions and multi-task deep neural networks. Cortex 2018;98:249-261.
12. Guclu U, van Gerven MAJ. Deep Neural Networks Reveal a Gradient in the Complexity of Neural Representations across the Ventral Stream. Journal of Neuroscience 2015;35:10005-10014.
Figures