3900
Evaluating Multiband Single Echo and Multi-Echo Sequences With and Without Arterial Spin Labeling for Cerebrovascular Reactivity Calculations1Medical College of Wisconsin, Milwaukee, WI, United States, 2GE Healthcare, Waukesha, WI, United States, 3GE Healthcare, Buc, France, 4GE Healthcare, Menlo Park, CA, United States
Synopsis
A multiband (MB) multi-echo (ME) pseudocontinuous arterial spin labeling (pCASL) sequence has shown improved cerebrovascular reactivity (CVR) calculations compared to a single echo; however, pCASL significantly increases TR. This study compared a MBME pCASL sequence to MBME and MB single echo acquisitions for the calculation of CVR. TSNR was higher for the MBME pCASL sequence compared to the MBME and MBMS sequences, and mean CVR was comparable between all sequences. The ME sequences had improved quality in areas with high susceptibility. Despite significantly longer TR, the MBME pCASL sequence performed comparably to the MBME sequence, while simultaneously providing ASL data.
Introduction
Cerebrovascular reactivity (CVR) is emerging as strong indicator of brain health in many different applications, but challenges remain in its technical implementation. Recently, a multiband (MB), multi-echo (ME) pseudo-continuous arterial spin labeling (pCASL) sequence was developed and evaluated for CVR1. It was shown combining echoes led to increased BOLD sensitivity compared to using a single echo (SE) from the same dataset. However, including ASL significantly increases TR as pCASL labeling and the post-label delay (PLD) typically last >2.5 s leading to TRs > 3.5s. This could affect BOLD results as the ability to detect activation increases with increasing number of time points2. Here, MBME pCASL was compared to short-TR MBME and MBSE sequences without pCASL for the calculation of CVRMethods
Sixteen healthy subjects were recruited for this study. Subjects were imaged on 3T scanner (GE Signa Premier, 32-channel NOVA head coil) with three pulse sequences: MBSE, MBME, and MBME pCASL. All scans had FOV = 24cm, matrix size = 80x80, 3x3x3 mm3 voxel size, MB-factor = 4, 44 total slices, and in-plane acceleration with R = 2. The MBSE scan had TR/TE = 650/30ms with FA = 60deg, the MBME scan had TR/TE = 900/11,30,48ms with FA = 60deg, and the MBME pCASL scan had TR/TE = 3500/11,30,48 with FA = 90deg. In addition, the MBME pCASL scan had labeling time = 1500ms and PLD = 1000ms. A T1-weighted anatomical MPRAGE dataset was acquired for coregistration to standard space. Data analyses were completed using FSL and AFNI. First, the MPRAGE data was nonlinearly registered to MNI space. Functional data were despiked and the first echo was volume registered. For the ME data, subsequent echoes were volume-registered using the transformation matrix from the first-echo registration. Echoes were then combined using the T2*-weighted method following the estimation of T2*3. The multi-echo independent component analysis (MEICA) technique was used to denoise the data4. Voxelwise TSNR was computed by dividing the mean signal across time by the standard deviation of the timeseries. Functional data were registered to the MPRAGE and then to MNI space using the MPRAGE-MNI transformation matrices. Finally, the data was smoothed with a 4mm FWHM Gaussian kernel. A perfusion-weighted time-series was computed using the surround subtraction method5.Task Paradigms
Subjects completed a breath holding task during each of the three sequences, which was used to estimate CVR. This consisted four blocks of 24s of paced breathing followed by a 16s breath hold on expiration and 16s of self-paced breathing
Individual Level Statistics
A GLM was used to compute beta coefficients and t-statistics. For BOLD data, the six rigid-body motion parameters were included as nuisance regressors and data was detrended with a third-degree polynomial. For MBME pCASL scans, an additional regressor consisting of a column of alternating -1s and 1s was included to model label-control oscillations in the data. The respiration response function (RRF) was used to model the BH task6. Cerebral vascular reactivity (CVR) was computed as the percent signal change by dividing the beta coefficient of the task response by the mean signal.
Group Level Statistics
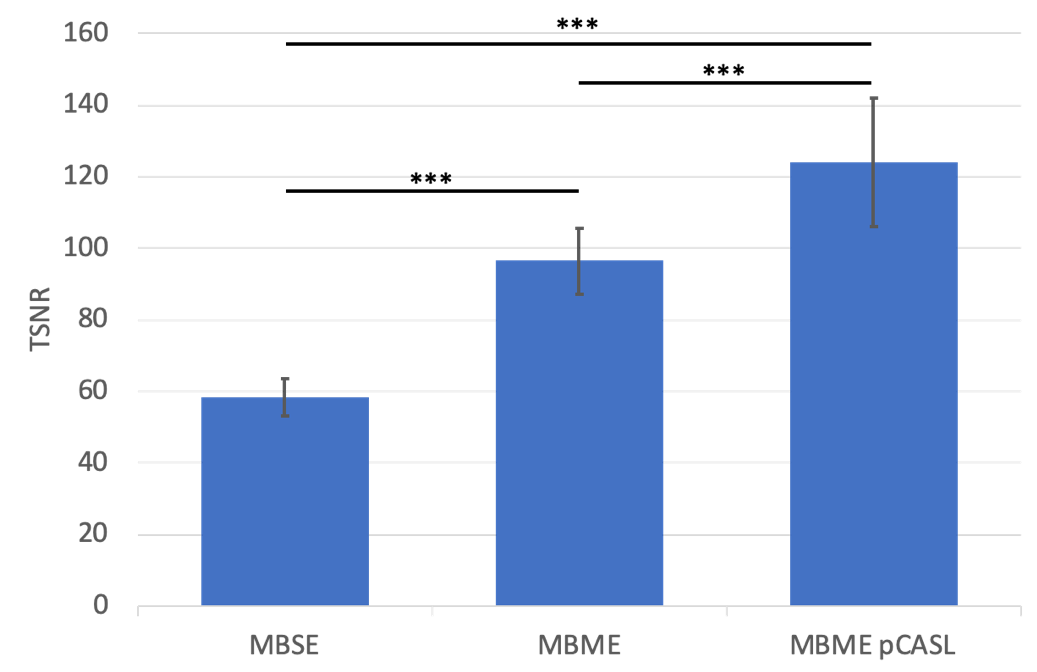
Mean CVR was computed by averaging across subjects and was compared between sequences. Mean whole-brain TSNR was extracted from each subject and sequence, averaged across subjects, and compared between sequences. A p-value < 0.05 was considered significant.
Results
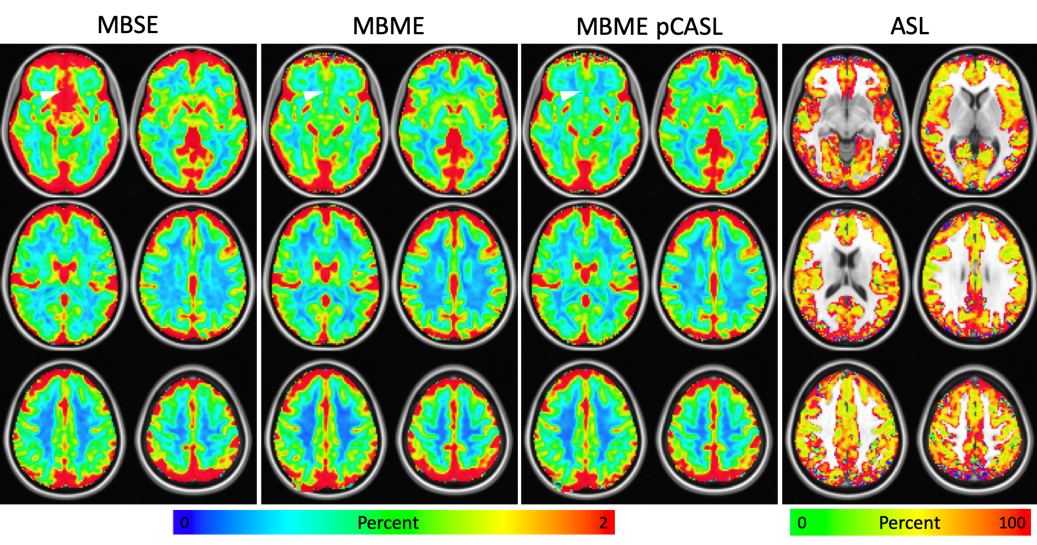
TSNR was significantly higher for the MBME pCASL sequence compared to the MBME and MBMS sequences (Figure 1, p < 0.001). Mean BOLD-CVR was comparable between all sequences; however, the ME sequences had markedly improved quality in areas with high susceptibility (Figure 2). Areas where significant signal dropout was present on the MBSE images, the signal was recovered on the ME images. PW-CVR was much noisier compared to BOLD-CVR.Discussion
Typical simultaneous BOLD/ASL acquisitions use only two echoes: one PW and one BOLD. By including additional echoes, comparable CVR maps were also obtained with the MBME pCASL sequence compared to MBME and MBSE despite significantly longer TR. The MBME pCASL sequence provides an additional contrast, ASL, which may provide complimentary information to the BOLD data. The ME scans also had markedly improved signal quality in areas of susceptibility-induced dropout on the MBSE scan. This is due to the inclusion of a short echo time (TE = 11ms), which has less dropout than images with longer echo times. It should be noted, however, signal in these areas may have less BOLD sensitivity as they are heavily weighted towards the shorter TE and BOLD sensitivity is highest when T2* = TE (~30ms at 3T).Conclusion
Despite significantly longer TR, the MBME pCASL sequence performed comparably to MBME and MBSE sequences, while simultaneously providing ASL data. ME acquisitions also had reduced susceptibility-induced signal dropout for the CVR calculation.Acknowledgements
No acknowledgement found.References
1. Cohen AD, Wang Y. Improving the Assessment of Breath-Holding Induced Cerebral Vascular Reactivity Using a Multiband Multi-echo ASL/BOLD Sequence. Scientific reports 2019;9(1):5079.
2. Murphy K, Bodurka J, Bandettini PA. How long to scan? The relationship between fMRI temporal signal to noise ratio and necessary scan duration. Neuroimage 2007;34(2):565-574.
3. Posse S, Wiese S, Gembris D, Mathiak K, Kessler C, Grosse‐Ruyken ML, Elghahwagi B, Richards T, Dager SR, Kiselev VG. Enhancement of BOLD‐contrast sensitivity by single‐shot multi‐echo functional MR imaging. Magnetic Resonance in Medicine: An Official Journal of the International Society for Magnetic Resonance in Medicine 1999;42(1):87-97.
4. Kundu P, Inati SJ, Evans JW, Luh W-M, Bandettini PA. Differentiating BOLD and non-BOLD signals in fMRI time series using multi-echo EPI. Neuroimage 2012;60(3):1759-1770.
5. Wong EC, Buxton RB, Frank LR. Implementation of quantitative perfusion imaging techniques for functional brain mapping using pulsed arterial spin labeling. NMR in Biomedicine 1997;10(4‐5):237-249.
6. Birn RM, Smith MA, Jones TB, Bandettini PA. The respiration response function: the temporal dynamics of fMRI signal fluctuations related to changes in respiration. Neuroimage 2008;40(2):644-654.
Figures