3899
Comparing Multiband Single Echo and Multi-echo Sequences With and Without Arterial Spin Labeling for Task Activation1Medical College of Wisconsin, Milwaukee, WI, United States, 2GE Healthcare, Waukesha, WI, United States, 3GE Healthcare, Buc, France, 4GE Healthcare, Menlo Park, CA, United States
Synopsis
Multi-echo functional MRI has shown increased BOLD sensitivity compared to single echo acquisitions; however, it suffers from increased TR, especially when combined with arterial spin labeling (ASL). This study compared multiband multi-echo scans with and without pseudocontinuous ASL to a multiband single echo acquisition during a visual task. Temporal signal to noise and group task activation was higher for the multi-echo scans. Furthermore, the multi-echo PCASL sequence showed similar activation to multi-echo alone despite significantly higher TR. This study showed the benefits of ME acquisitions for task fMRI, despite higher TR. The addition of ASL did not reduce task activation.
Introduction
Multiecho (ME) functional MRI (fMRI) has shown increased BOLD sensitivity compared to single-echo (SE) acquisitions1-3. ME acquisitions also allow for denoising using multi-echo independent component analysis4. When combined with multiband (MB) techniques this allows for high quality acquisitions in a short amount of time5. However, each additional echo increases TR, and resolution is limited if reasonable TEs are to be obtained. Furthermore, MBME has been combined with pseudo-continuous arterial spin labeling (pCASL). This sequence has shown increased BOLD sensitivity compared to using a single echo from the same dataset for resting state6 and task7 fMRI; however pCASL labeling increases TR even further. In this study MBSE, MBME, and MBME pCASL sequences were compared during a visual checkerboard task while keeping TR minimized for all acquisitions.Methods
Sixteen healthy subjects were recruited for this study. Subjects were imaged on 3T scanner (GE Signa Premier, 32-channel NOVA head coil) with three pulse sequences: MBSE, MBME, and MBME pCASL while completing a checkerboard task. All acquisitions had FOV = 24cm, matrix size = 80x80, 3x3x3 mm3 voxel size, MB-factor = 4, 44 total slices, and in-plane acceleration with R = 2. The MBSE scan had TR/TE = 650/30ms with FA = 60deg, the MBME scan had TR/TE = 900/11,30,48ms with FA = 60deg, and the MBME pCASL scan had TR/TE = 3500/11,30,48 with FA = 90deg. The MBME pCASL scan had labeling time = 1500ms and a post-label delay = 1000ms. A T1-weighted anatomical MPRAGE dataset was also acquired. Data analyses were completed using FSL and AFNI. First, the MPRAGE data was registered to MNI space. This process involved ACPC alignment and then linear followed by nonlinear registration to an MNI template. Functional data were first despiked and volume registered. For the ME data, the first echo dataset was volume registered and subsequent echoes used the transformation matrix from that registration. T2* was then estimated from the three echoes, and the echoes were then combined using the T2*-weighted technique3. The MEICA technique was used to denoise the data4. Voxelwise TSNR was computed by dividing the mean signal across time by the standard deviation of the timeseries. Functional data was registered to the MPRAGE and then to MNI space using the MPRAGE-MNI transformation matrices. Finally, the data was smoothed with a 4mm FWHM Gaussian kernel. A perfusion-weighted (PW) time-series was computed using the surround subtraction method8.Task Paradigm
For the checkerboard task, subjects looked at a cross hair on a black background for 32s followed by a flashing checkerboard for 32s. This was repeated four times.
Individual Level Statistics
A GLM was used to compute beta coefficients and t-statistics using the six rigid-body motion parameters as nuisance regressors and detrending with a third-degree polynomial. A square-wave convolved with a double-gamma HRF was used to model the task.
Group Level Statistics
A one sample t-test was conducted across subjects for all sequences and compared between MBSE, MBME, and MBME pCASL sequences. Maps were thresholded at p < 0.005 and cluster size corrected using 3dClustSim in AFNI (minimum cluster size = 72 voxels, α < 0.05). Mean whole-brain TSNR was extracted from each subject and sequence, averaged across subjects and compared across sequences. A p-value < 0.05 was considered significant.
Results
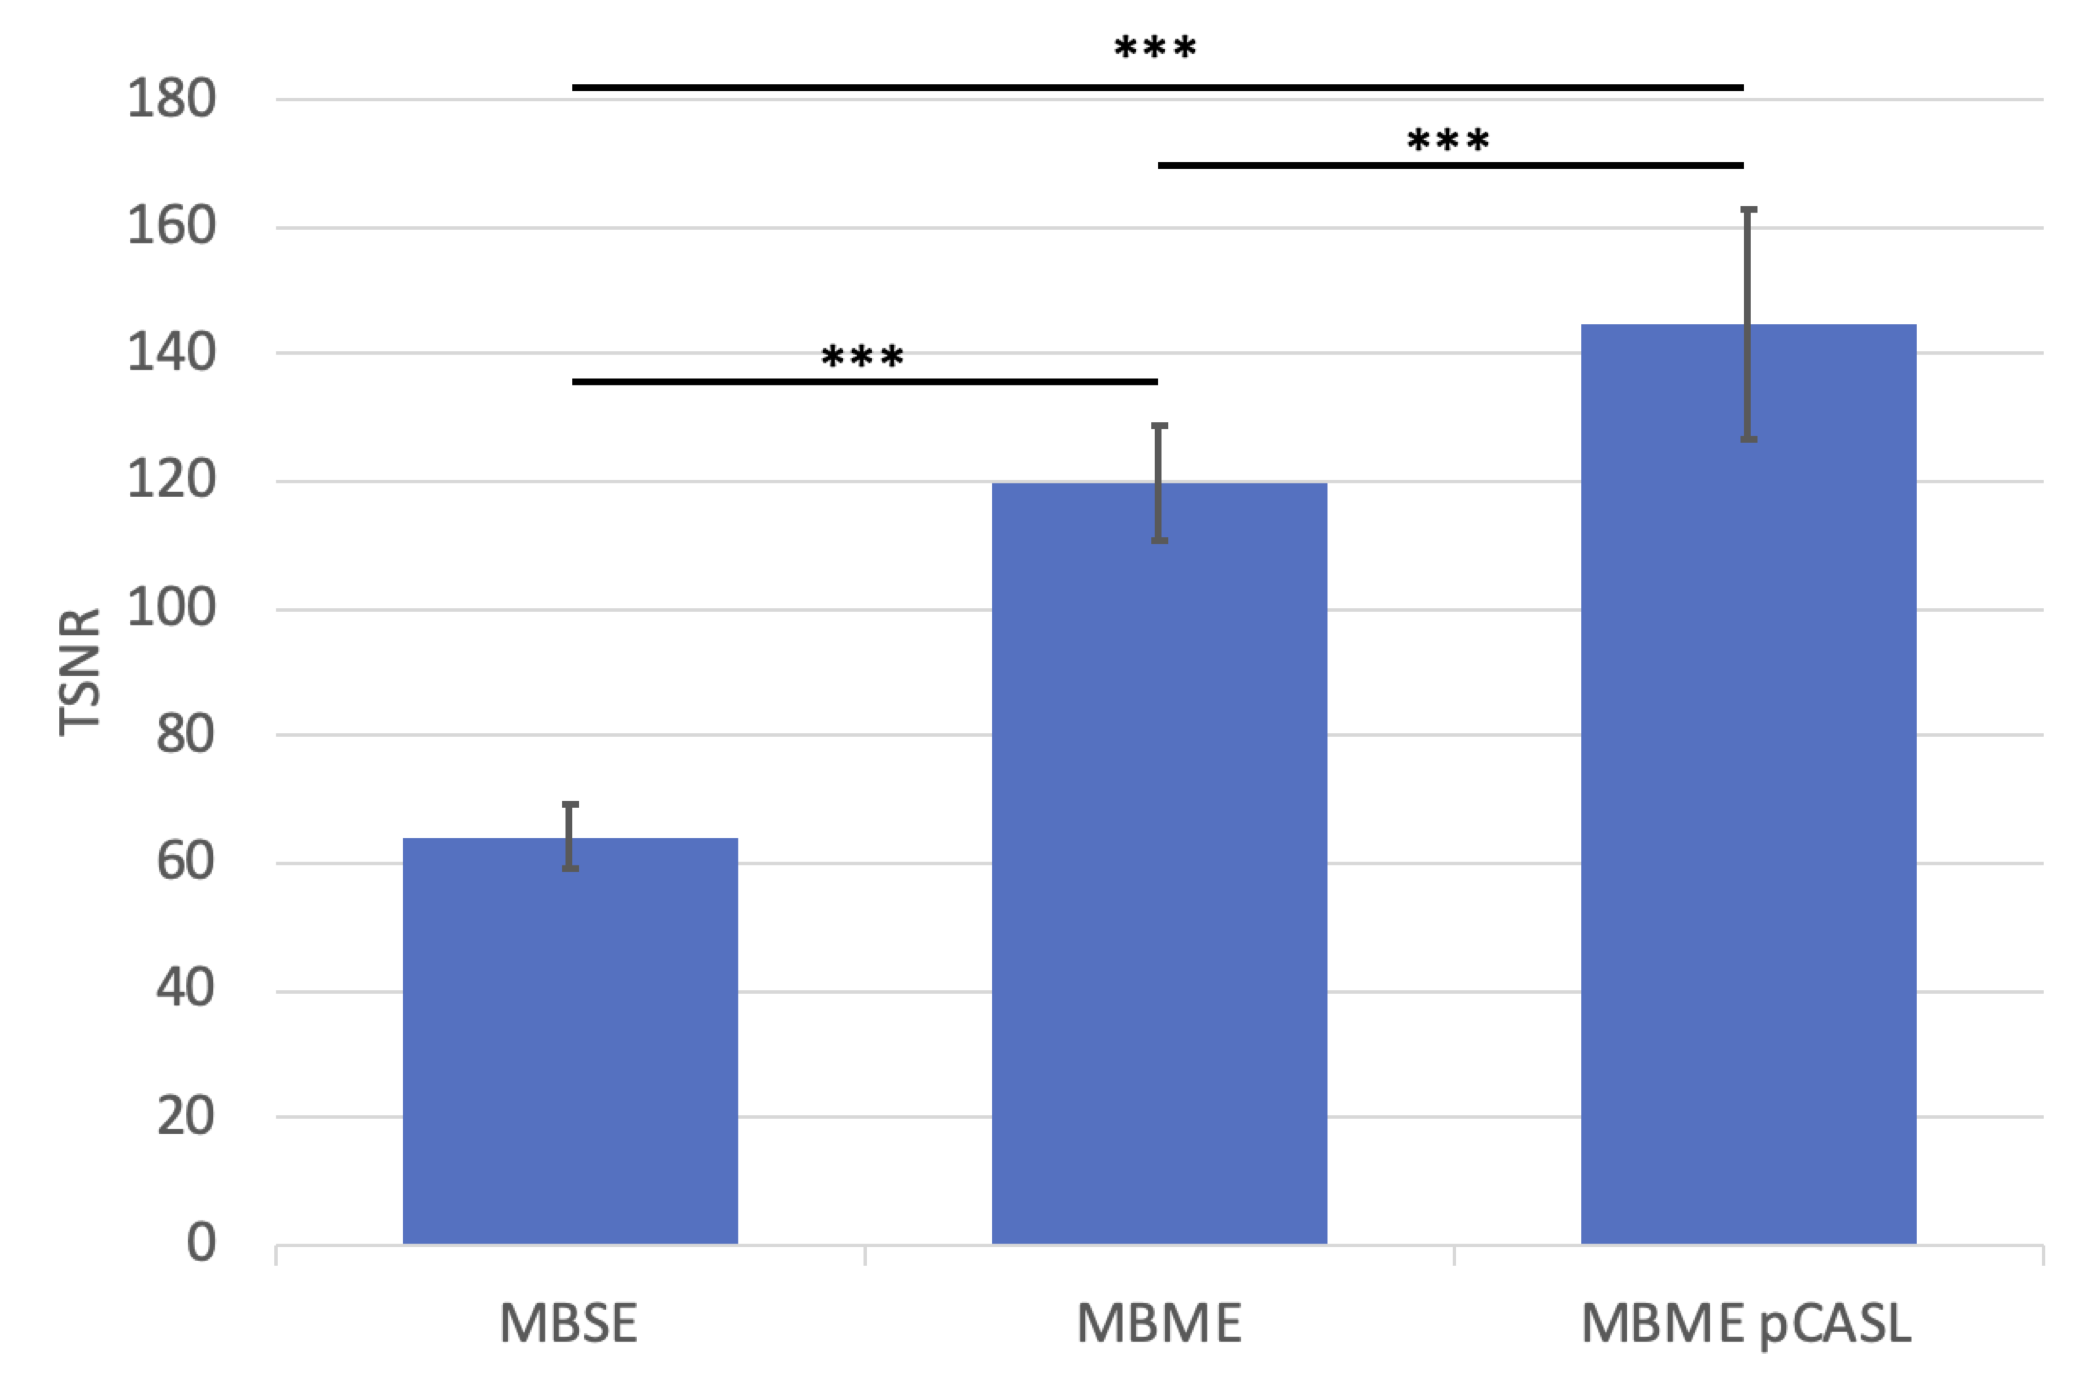
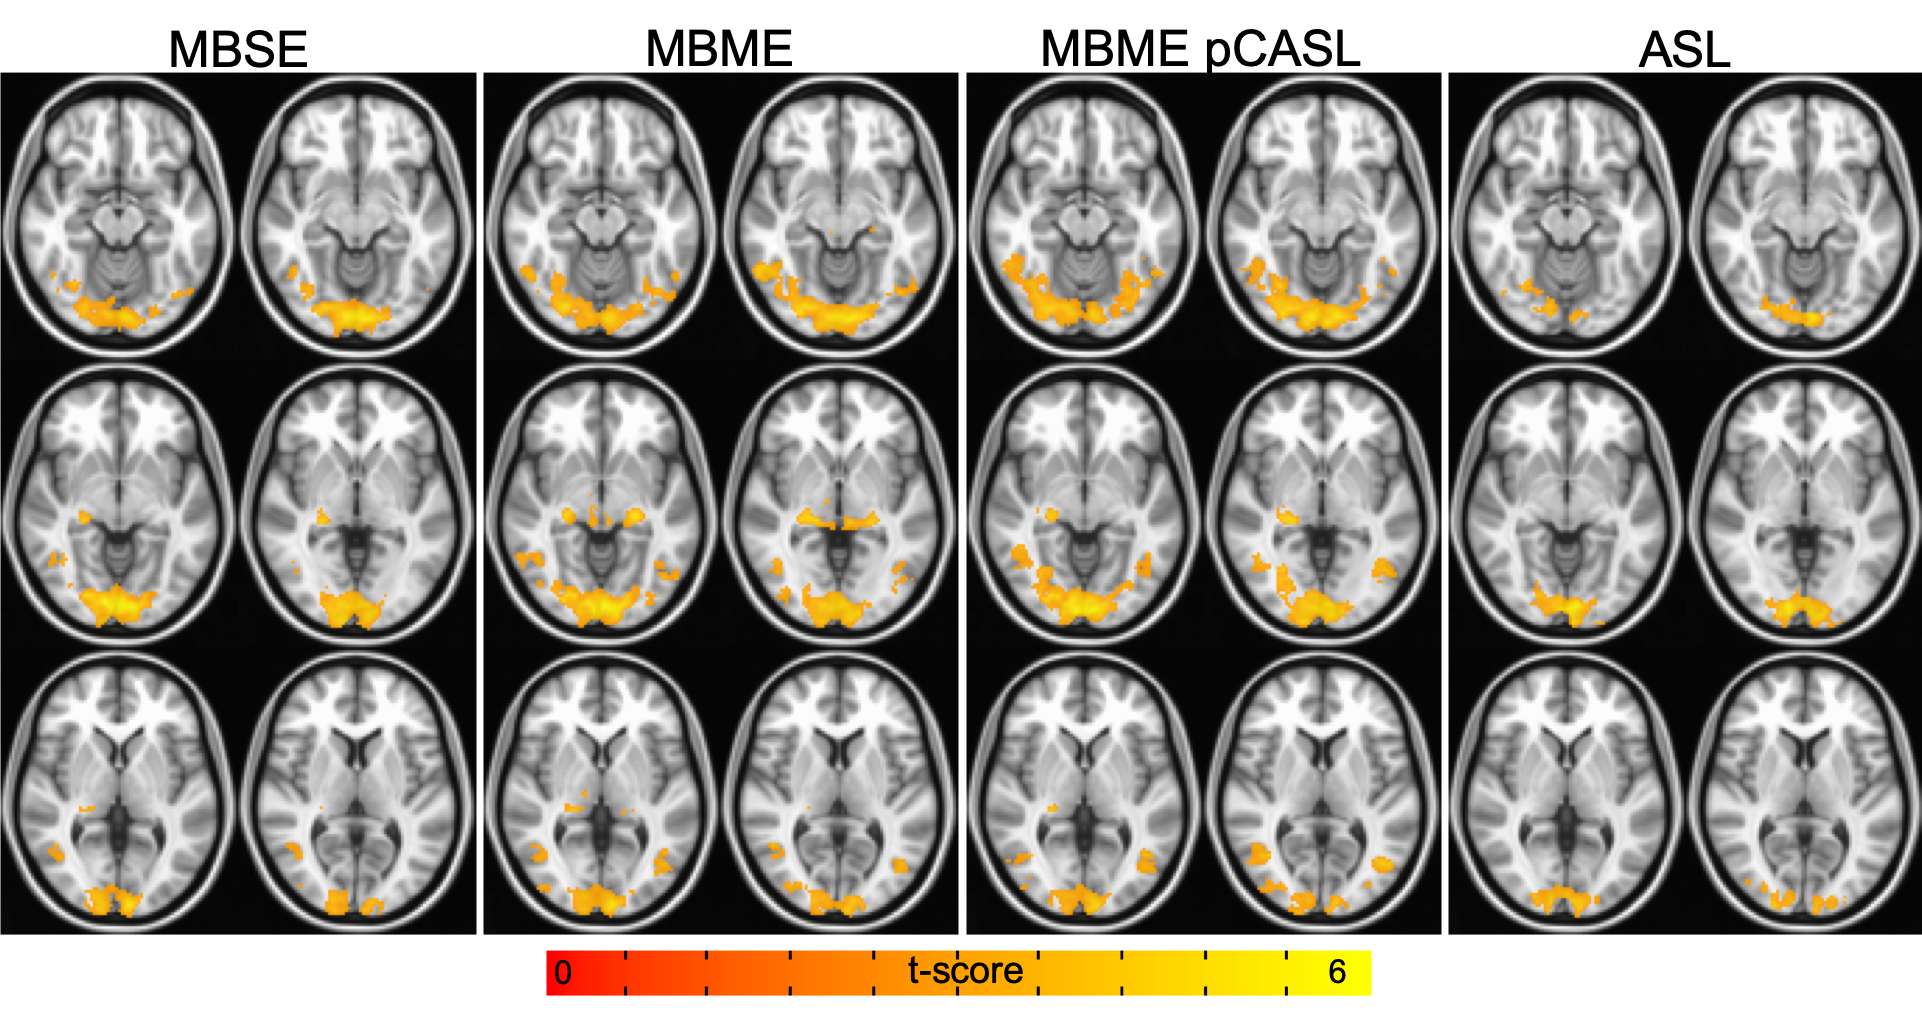
TSNR was higher for the MBME pCASL sequence compared to the MBME and MBSE sequences (Figure 1, p < 0.001). For the Checkerboard task, there was more group activation for the MBME pCASL and MBME sequences compared to the MBSE sequence (Figure 2). Group activation was comparable between the MBME pCASL and MBME sequences. Less PW activation was seen compared to BOLD activation, but significant activation was still observed in the visual cortexDiscussion
Increased group activation was seen for the ME sequences vs. the MBSE sequence. This is likely due to reduced intersubject variance for the ME scans. On an individual level there was no significant difference in activation volume between sequences. Interestingly, MBME pCASL tSNR was also significantly higher than MBME TSNR, likely due to the increased TR, which has been shown to lead to increased SNR as magnetization is allowed to fully recover9. This does not necessarily lead to increased activation, however, as activation is related to the number of timepoints collected10. Comparable group checkerboard activation was achieved for the MBME pCASL sequence compared to MBME despite a significantly longer TR (900 vs 3500ms) leading to a reduced number of time points. MBME pCASL has the advantage of providing an additional imaging contrast, ASL.Conclusion
This study shows the benefits of ME acquisitions for task fMRI, despite higher TR. Furthermore, the addition of pCASL labeling provides an additional imaging contrast while not reducing BOLD task activation.Acknowledgements
No acknowledgement found.References
1. Kundu P, Voon V, Balchandani P, Lombardo MV, Poser BA, Bandettini PA. Multi-echo fMRI: a review of applications in fMRI denoising and analysis of BOLD signals. Neuroimage 2017;154:59-80.
2. Poser BA, Versluis MJ, Hoogduin JM, Norris DG. BOLD contrast sensitivity enhancement and artifact reduction with multiecho EPI: parallel‐acquired inhomogeneity‐desensitized fMRI. Magnetic Resonance in Medicine: An Official Journal of the International Society for Magnetic Resonance in Medicine 2006;55(6):1227-1235.
3. Posse S, Wiese S, Gembris D, Mathiak K, Kessler C, Grosse‐Ruyken ML, Elghahwagi B, Richards T, Dager SR, Kiselev VG. Enhancement of BOLD‐contrast sensitivity by single‐shot multi‐echo functional MR imaging. Magnetic Resonance in Medicine: An Official Journal of the International Society for Magnetic Resonance in Medicine 1999;42(1):87-97.
4. Kundu P, Inati SJ, Evans JW, Luh W-M, Bandettini PA. Differentiating BOLD and non-BOLD signals in fMRI time series using multi-echo EPI. Neuroimage 2012;60(3):1759-1770.
5. Olafsson V, Kundu P, Wong EC, Bandettini PA, Liu TT. Enhanced identification of BOLD-like components with multi-echo simultaneous multi-slice (MESMS) fMRI and multi-echo ICA. Neuroimage 2015;112:43-51.
6. Cohen AD, Nencka AS, Lebel RM, Wang Y. Multiband multi-echo imaging of simultaneous oxygenation and flow timeseries for resting state connectivity. PloS one 2017;12(3):e0169253.
7. Cohen AD, Nencka AS, Wang Y. Multiband multi-echo simultaneous ASL/BOLD for task-induced functional MRI. PloS one 2018;13(2):e0190427.
8. Wong EC, Buxton RB, Frank LR. Implementation of quantitative perfusion imaging techniques for functional brain mapping using pulsed arterial spin labeling. NMR in Biomedicine 1997;10(4‐5):237-249.
9. Constable RT, Spencer DD. Repetition time in echo planar functional MRI. Magnetic Resonance in Medicine: An Official Journal of the International Society for Magnetic Resonance in Medicine 2001;46(4):748-755.
10. Murphy K, Bodurka J, Bandettini PA. How long to scan? The relationship between fMRI temporal signal to noise ratio and necessary scan duration. Neuroimage 2007;34(2):565-574.
Figures