3898
Improved Accuracy of Resting State Fluctuation Amplitude for Cerebrovascular Reactivity Estimation Using a Multiband Multi-Echo Acquisition1Medical College of Wisconsin, Milwaukee, WI, United States, 2GE Healthcare, Waukesha, WI, United States, 3GE Healthcare, Buc, France, 4GE Healthcare, Menlo Park, CA, United States
Synopsis
Resting state fMRI (rs-fMRI) can potentially be used to measure cerebrovascular reactivity (CVR). Specifically, resting state fluctuation amplitude (RSFA) is related to the breath hold response. In this study a multiband (MB), ME sequence was compared to a MB, single echo (SE) sequence in terms of their ability to estimate CVR using rs-fMRI-derived RSFA by comparing to BH-CVR. The MBME scan showed higher voxelwise across-subject correlation between RSFA and CVR. The spatial correlation between mean RSFA and CVR maps was also higher for MBME scans, indicating improved accuracy of RSFA as an alternative to CVR using an MBME sequence.
Introduction
Recent work has shown resting state functional MRI (rs-fMRI) has the potential to be used as a surrogate for hypercapnia-based cerebrovascular reactivity (CVR) measurements1-3. For example, Kannurpatti and Biswal showed resting state fluctuation amplitude (RSFA) is related to the breath hold (BH) response3. There are many different approaches for collecting fMRI data. Multi-echo (ME) approaches have shown increased BOLD sensitivity for resting state acquisitions4. Thus, in this study a multiband (MB), ME sequence was compared to a MB, single echo (SE) sequence in terms of their ability to estimate CVR using rs-fMRI-derived RSFA. A BH task was used to estimate CVR.Methods
Sixteen healthy subjects were recruited for this study and were imaged on 3T scanner (GE Signa Premier, 32-channel NOVA head coil) with two pulse sequences: MBSE and MBME. Subjects underwent two functional scans for each sequence: resting state and BH. All scans had FOV = 24cm, matrix size = 80x80, 3x3x3 mm3 voxel size, MB-factor = 4, 44 total slices, and in-plane acceleration with R = 2. The MBSE scans had TR/TE = 650/30ms with FA = 60deg, and the MBME scans had TR/TE = 900/11,30,48ms with FA = 60deg. A T1-weighted anatomical dataset was acquired for coregistration to standard space. Data analyses were completed using FSL and AFNI. First, the MPRAGE data was nonlinearly registered to MNI space. Functional data were despiked and the first echo was volume registered. For the ME data, subsequent echoes were volume-registered using the transformation matrix from the first-echo registration. Echoes were combined using the T2*-weighted method following the estimation of T2*5. The multi-echo independent component analysis (MEICA) technique was used to denoise the data6. Functional data were registered to the MPRAGE and then to MNI space using the MPRAGE-MNI transformation matrices. Finally, the data was smoothed with a 4mm FWHM Gaussian kernel.Task Paradigms and Data Processing
The BH task consisted of four blocks of 24s of paced breathing followed by a 16s breath hold on expiration and 16s of self-paced breathing. During the rs-fMRI scans, subjects were asked to lay still with their eyes closed. Resting state scans lasted six minutes. CVR was calculated from the BH scans. A GLM was used to estimate beta coefficients and t-statistics and included the six rigid-body motion parameters as nuisance regressors and detrending with a 3rd order polynomial. The respiration response function (RRF) was used to model the BH task7, and CVR was computed as the percent signal change. For the rs-fMRI acquisitions, the six rigid body motions parameters were regressed from the data and data was detrended with a 3rd order polynomial. Data was then bandpass filtered with 0.01 < f < 0.08 Hz. Finally, RSFA was computed using 3dRSFC in AFNI. RSFA was correlated with CVR across subjects using Pearson's R on a voxelwise basis for the MBSE and MBME scans. In addition, RSFA and CVR maps were spatially correlated using Pearson's R on an individual subject basis and using maps averaged across subjects for the MBSE and MBME scans.
Results
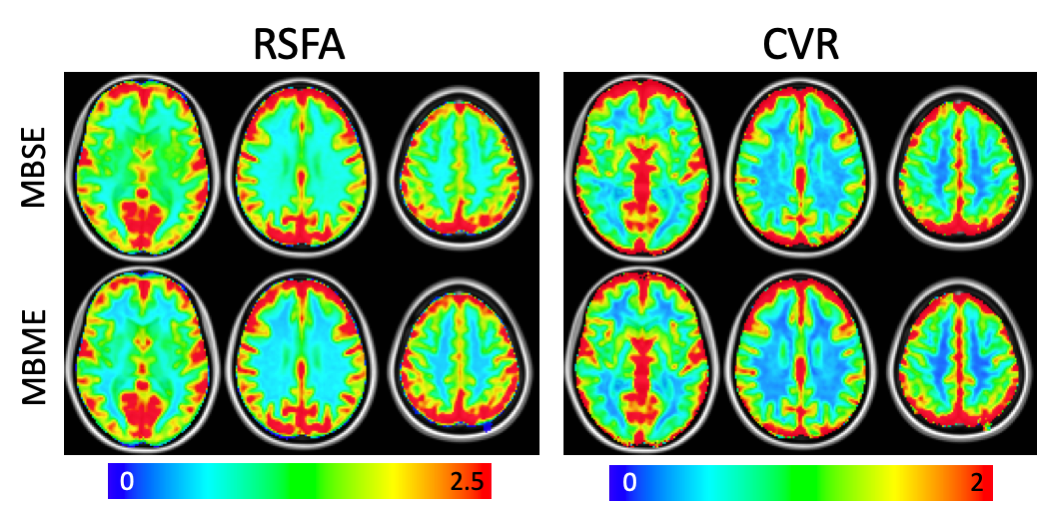
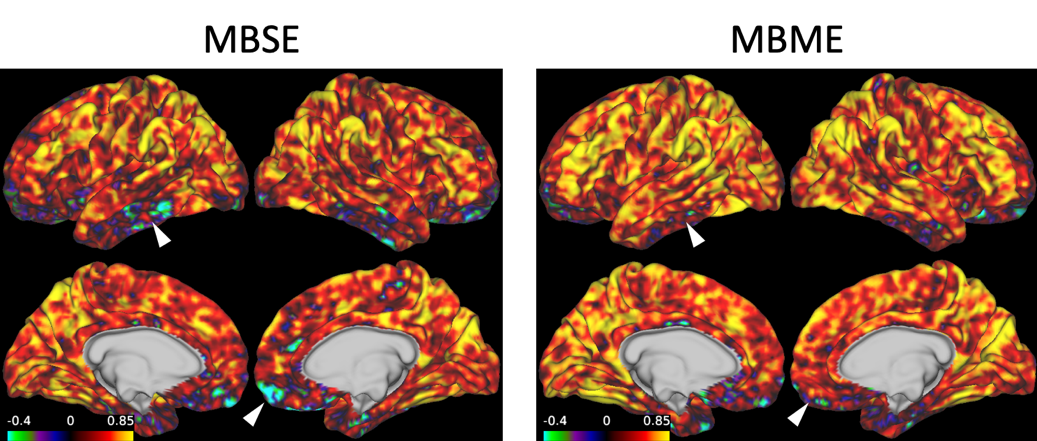
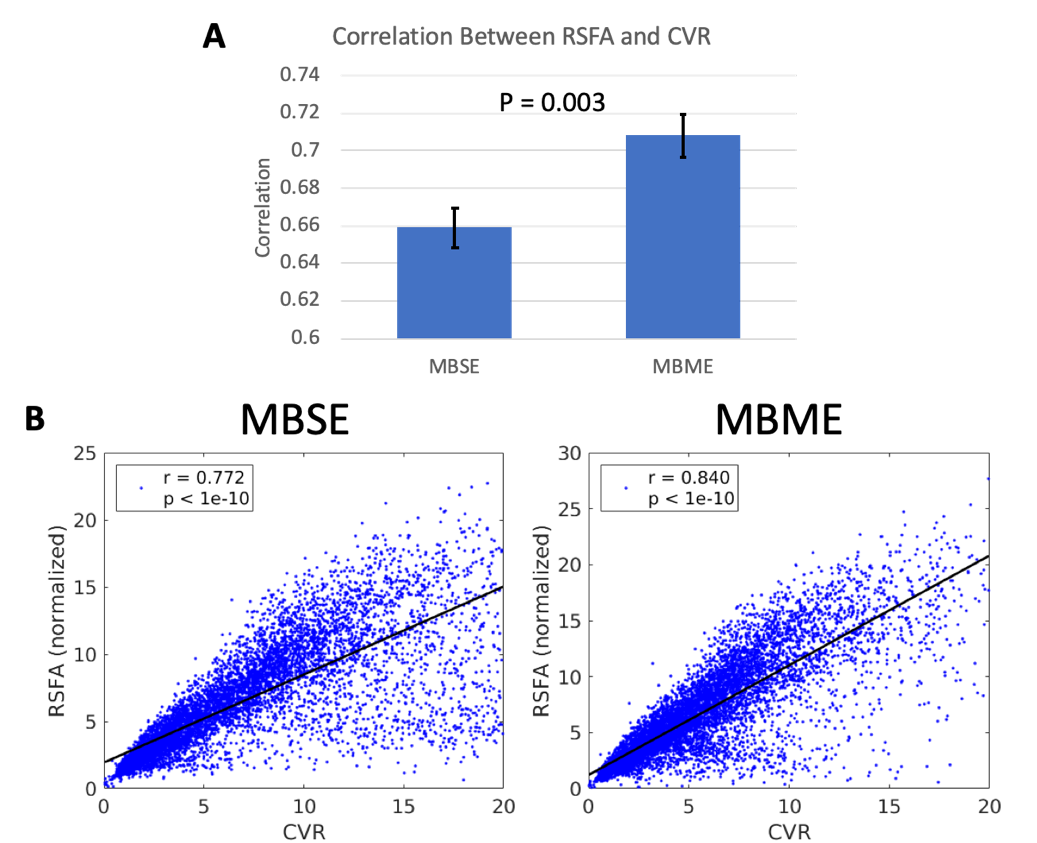
Mean RSFA and CVR maps across subjects are shown in Figure 1. Qualitatively the MBSE and MBME maps appeared similar, although slightly higher gray matter/white matter contrast was seen for the MBME acquisition compared to MBSE. Figure 2 shows voxelwise correlation between RSFA and CVR across subjects. The MBME scan showed higher correlation between the two metrics. The spatial correlation between mean RSFA and CVR maps was also higher for MBME compared to MBSE scans on an individual basis (Figure 3A, P = 0.003) and using maps averaged across subjects (Figure 3B). The MBSE scans had more data points with high CVR and low RSFA (Figure 3B, bottom right corner of the plots).Discussion
BH-CVR was used as the “gold standard” with which to compare RSFA as a surrogate for CVR. This was because controlled gas inhalation and end tidal CO2 monitoring, which have been shown to be superior to BH for computing CVR, were unavailable at our institution. Previous studies have shown BH to be acceptable for computing CVR in the absence of these other techniques, and BH-CVR is improved with a multi-echo acquisition8. Lower, and even negative, correlations between RSFA and CVR were seen in the temporal lobe and inferior frontal cortex, areas of known susceptibility dropout for EPI-based fMRI, on the MB scans (Figure 2, white arrows). These spurious negative correlations were less evident on the MBME scans, as the inclusion of shorter TEs reduced susceptibility-induced signal dropout.Conclusion
This study showed improved accuracy of RSFA as an alternative to CVR using MBME compared to MBSE acquisitions.Acknowledgements
No acknowledgement found.References
1. Jahanian H, Christen T, Moseley ME, Pajewski NM, Wright CB, Tamura MK, Zaharchuk G, Group SSR. Measuring vascular reactivity with resting-state blood oxygenation level-dependent (BOLD) signal fluctuations: A potential alternative to the breath-holding challenge? Journal of Cerebral Blood Flow & Metabolism 2017;37(7):2526-2538.
2. Liu P, Li Y, Pinho M, Park DC, Welch BG, Lu H. Cerebrovascular reactivity mapping without gas challenges. Neuroimage 2017;146:320-326.
3. Kannurpatti SS, Biswal BB. Detection and scaling of task-induced fMRI-BOLD response using resting state fluctuations. Neuroimage 2008;40(4):1567-1574.
4. Poser BA, Versluis MJ, Hoogduin JM, Norris DG. BOLD contrast sensitivity enhancement and artifact reduction with multiecho EPI: parallel‐acquired inhomogeneity‐desensitized fMRI. Magnetic Resonance in Medicine: An Official Journal of the International Society for Magnetic Resonance in Medicine 2006;55(6):1227-1235.
5. Posse S, Wiese S, Gembris D, Mathiak K, Kessler C, Grosse‐Ruyken ML, Elghahwagi B, Richards T, Dager SR, Kiselev VG. Enhancement of BOLD‐contrast sensitivity by single‐shot multi‐echo functional MR imaging. Magnetic Resonance in Medicine: An Official Journal of the International Society for Magnetic Resonance in Medicine 1999;42(1):87-97.
6. Kundu P, Inati SJ, Evans JW, Luh W-M, Bandettini PA. Differentiating BOLD and non-BOLD signals in fMRI time series using multi-echo EPI. Neuroimage 2012;60(3):1759-1770.
7. Birn RM, Smith MA, Jones TB, Bandettini PA. The respiration response function: the temporal dynamics of fMRI signal fluctuations related to changes in respiration. Neuroimage 2008;40(2):644-654.
8. Cohen AD, Wang Y. Improving the Assessment of Breath-Holding Induced Cerebral Vascular Reactivity Using a Multiband Multi-echo ASL/BOLD Sequence. Scientific reports 2019;9(1):5079.
Figures