3896
Progressive gray matter atrophy and altered structural covariance network in pontine infarction1The First Affiliated Hospital of Zhengzhou University, Zhengzhou, China, 2GE Healthcare, MR Research China, GE Healthcare, MR Research, Beijing, China
Synopsis
In order to identify longitudinal changes in gray matter volumes (GMVs) and structural covariance network after pontine infarction (PI), eleven patients and twenty normal underwent MRI scans and neurological examinations during six-month period. Changes of GMV were evaluated by using the voxel-based morphometry (VBM), and structural covariance networks were constructed. In general, the patients exhibited significant decreased GMV in bilateral cerebellum posterior lobe and extended disordered structural covariance network. In addition, the GMVs were correlated with behavior scores showing the abnormal results may be the mechanism of some impaired neurological function.
Introduction
Pontine infarction (PI) is a common type of posterior circulatory infarction. Secondary changes of gray matter volumes (GMVs) in chronic PI has been detected by some studies [1], but few longitudinal studies of GMVs in PI have been reported. In addition, some researches have shown that there is a structural covariance network (SCN) in the developing brain, and the inter-regional synchronous activity of GMVs was due to mutual neurotrophic or neurodegenerative processes, but the changes of SCN after cerebral infarction has not been well studied [2-3]. Here, we explore the longitudinal changes in GMVs and identify seed-based gray matter SCN associated with PIMethod
Eleven patients with PI within 7days after symptom onset and twenty age-matched healthy controls were enrolled in this study. High-resolution T1-weighted three-dimensional anatomical images were acquired on GE Discovery MR 750 scanners with a standard 8 channel head coil at 1week, 1month, 3months, 6months after infarction. The main parameters are as follows: repetition time/echo time = 8.2/3.2 ms; field of view = 256×256 mm2; matrix = 256×256; slice thickness = 1.0 mm, no gap; 188 slices. All participants underwent a series of behavioral assessments including motor, memory and attention function. The statistical analysis was performed by using one-way analysis of variance (ANOVA), with post-hoc contrasts by Bonferroni test. In order to eliminate the effect of lesion side, images of patients with right hemisphere lesions were flipped from right to left, then the GMV maps were calculated using the VBM8 and significantly different brain regions were also analyzed by using ANOVA. Then the GMVs of statistically significant brain regions were extracted as seed regions of interest (ROIs) and the brain volumetric SCN was defined as the correlation between the regional brain volumetric measures of different brain regions. Partial correlation analyses were conducted for the volume measurements of these regions in each group respectively to determine the positive or negative correlation with the ROIs. Threshold of statistical significance was set at p<0.05, and the family-wise error rate (FWE) was corrected with cluster size>100.Result and Discussion
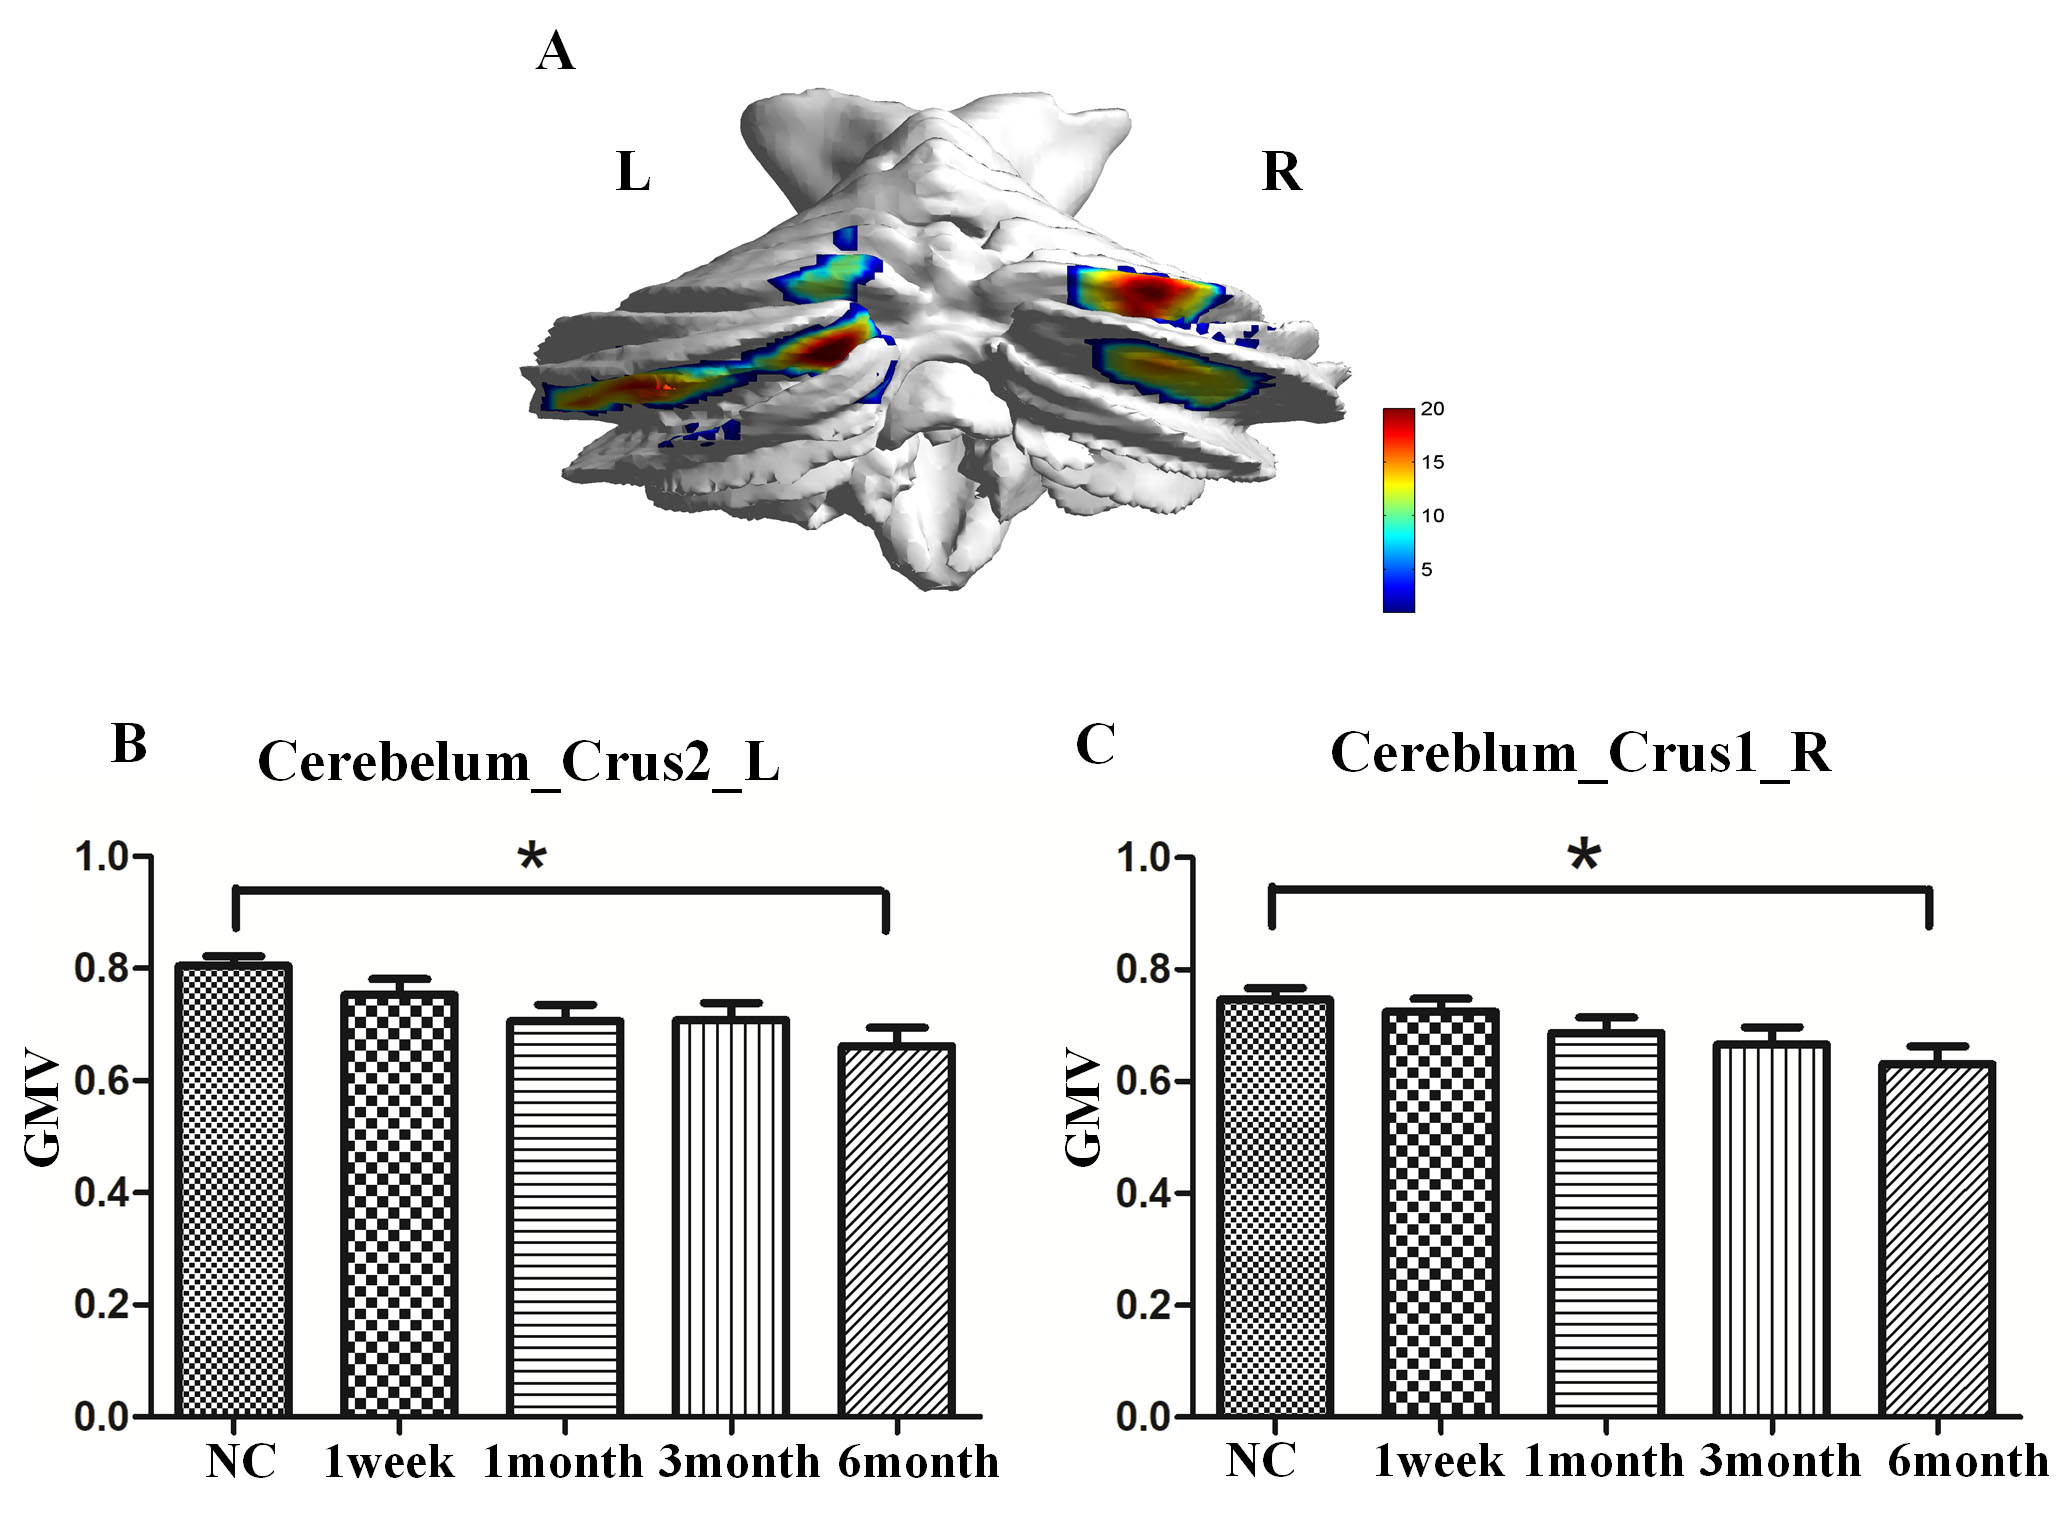
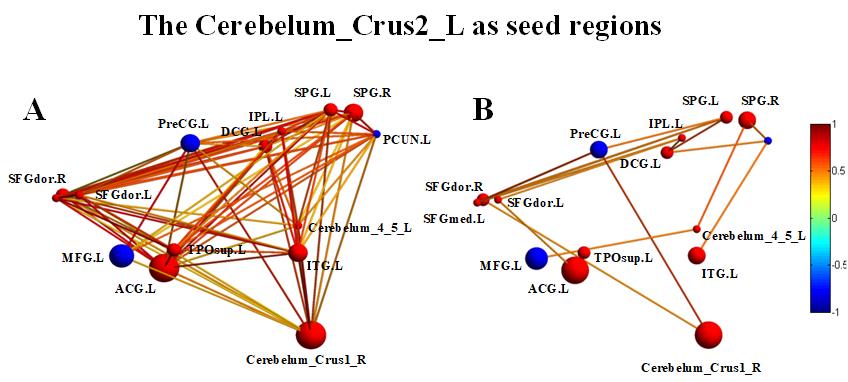
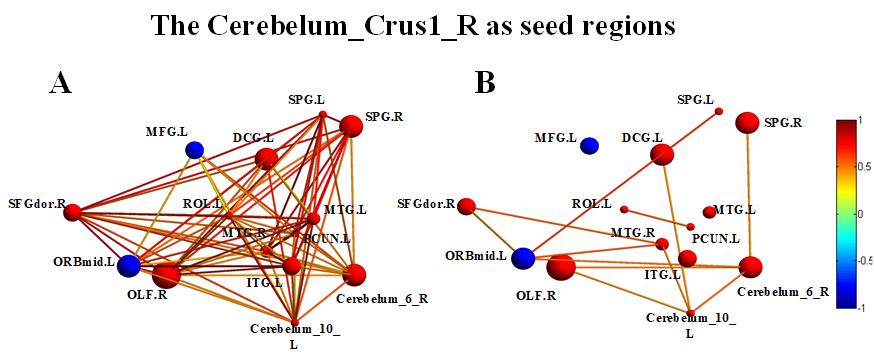
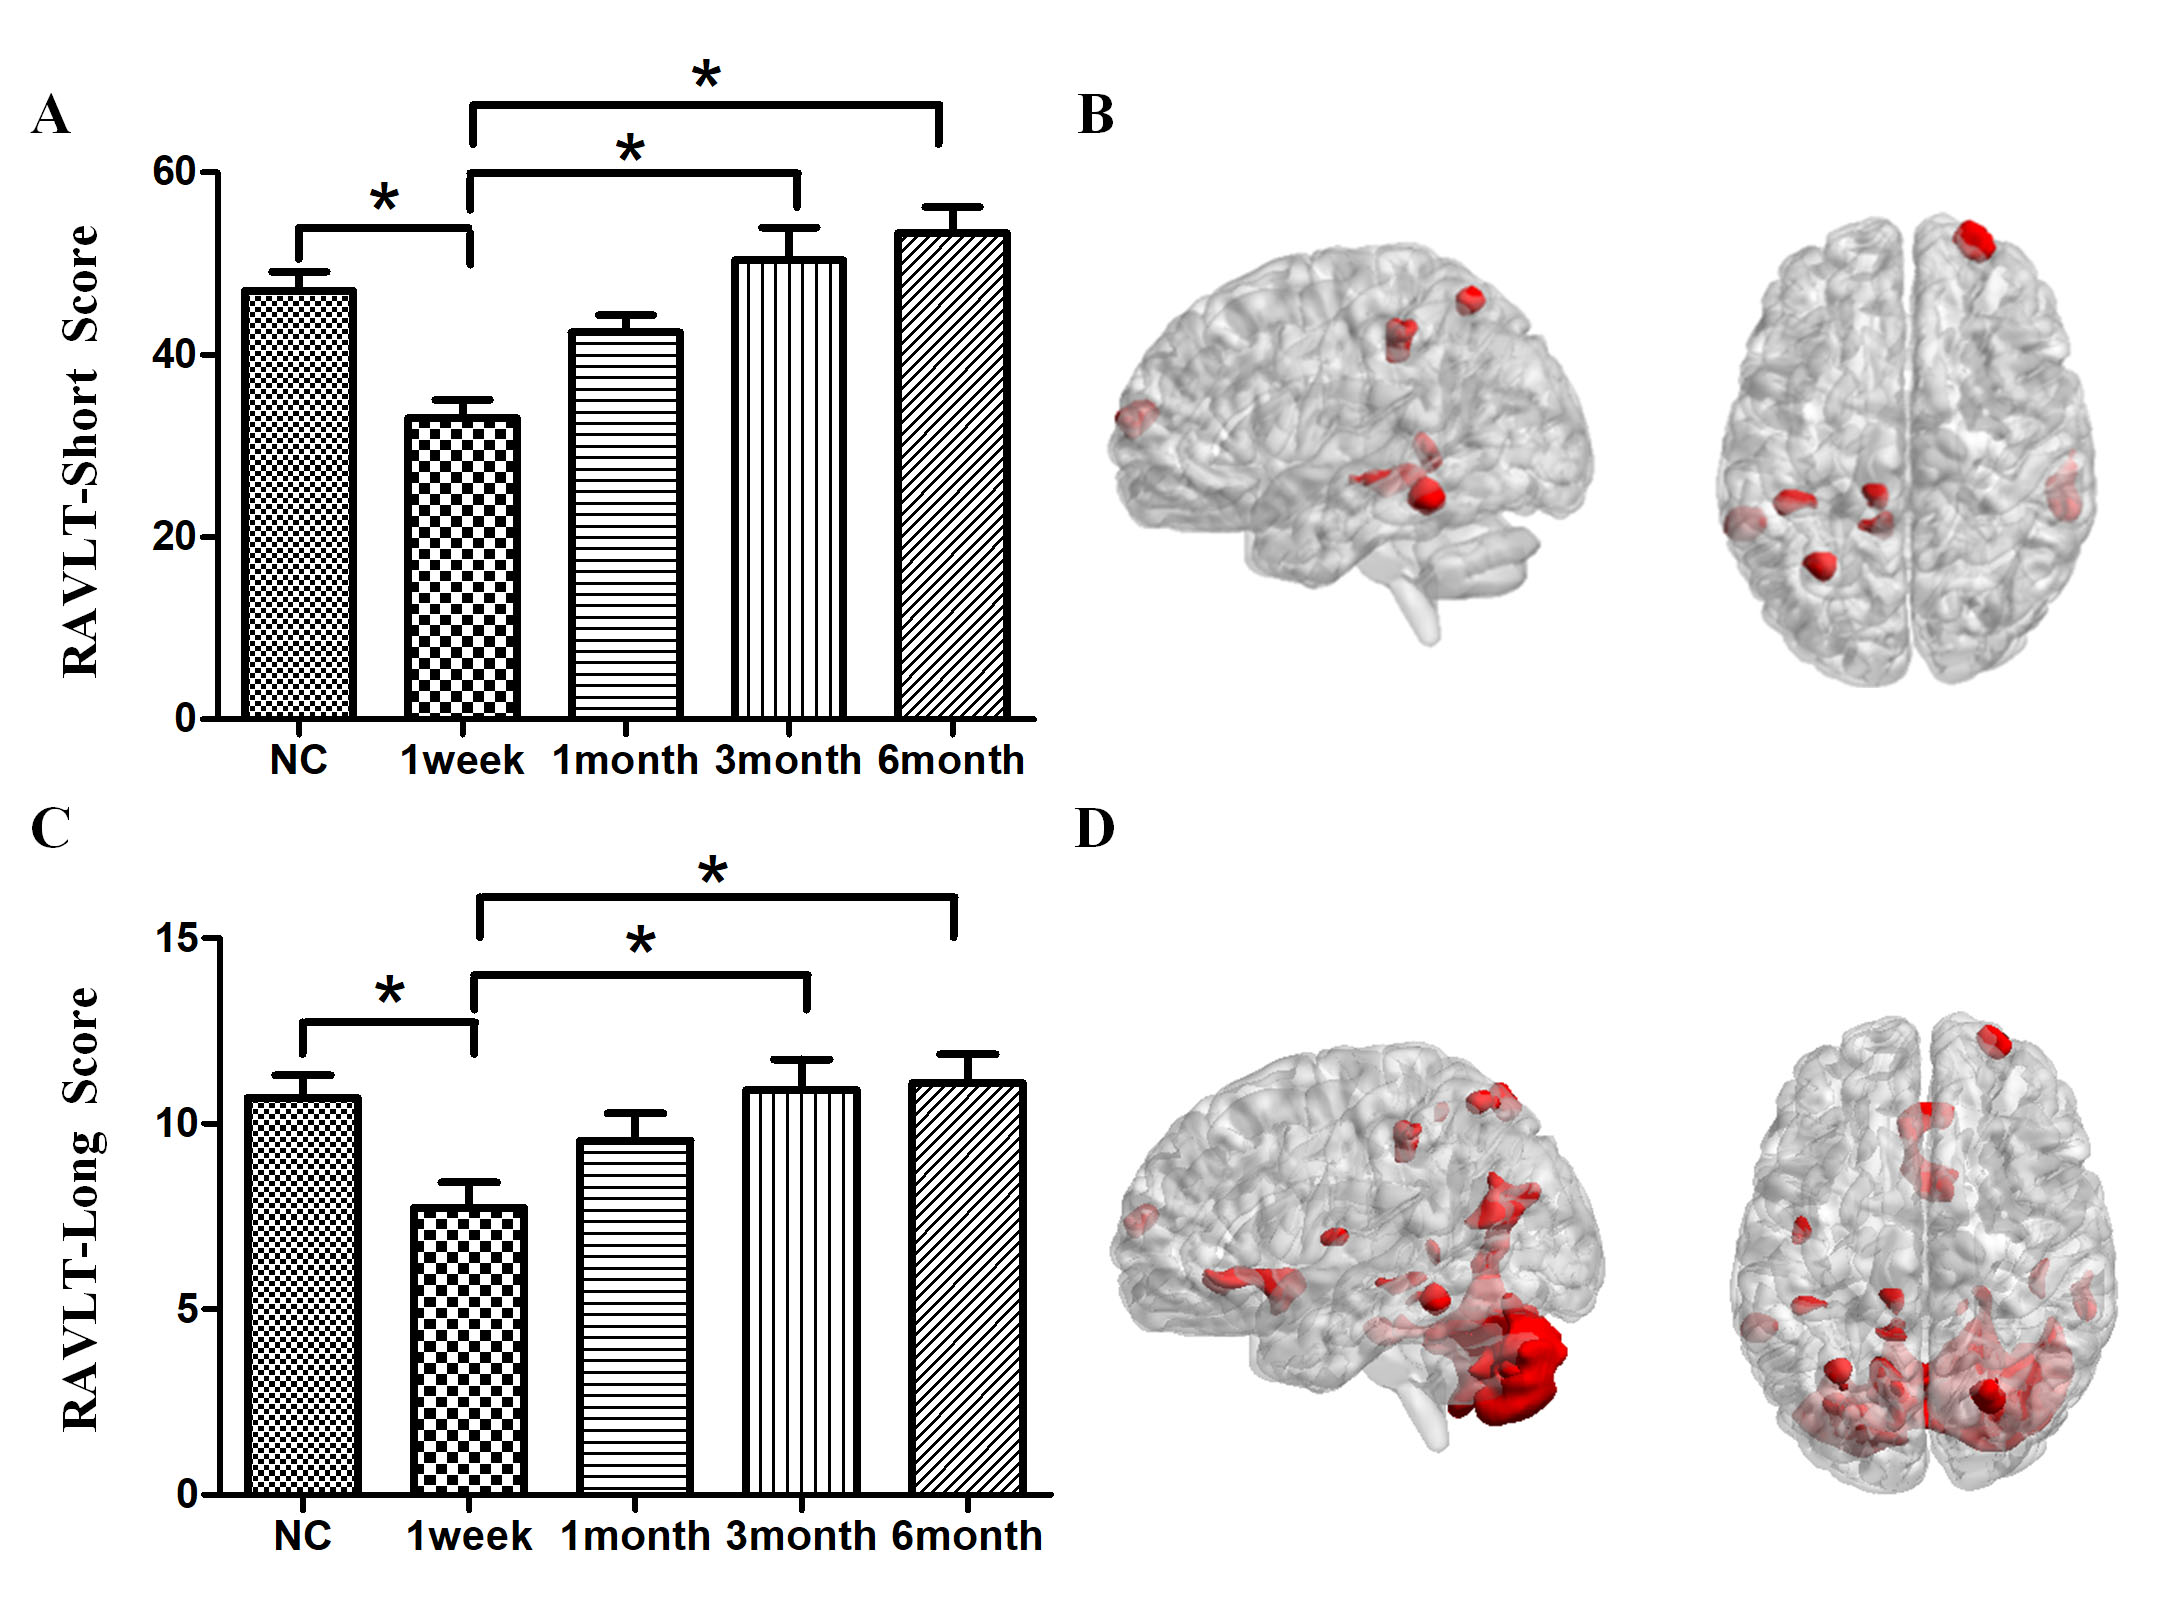
Compared with normal controls, the stroke patients performed worse in RAVLT test, showing a downward trend in the acute phase and then gradually recovering. Compared with NC group, GMVs of the bilateral cerebellum posterior lobe in PI group decreased significantly (Cerebellum _Crus2_L, F=20.023; Cerebellum _Crus1_R, F=22.121). The GMVs of the two brain areas in the PI group and NC group at different times were shown in Fig 1. Significant cerebral atrophy occurred in the sixth month after stroke onset (p<0.05). The Cerebelum_Crus2_L was used as a seed ROI. The seed-base correlation analysis showed significant positive correlations between two of the left cerebellum anterior lobe (Cerebelum_4_5_L), the right cerebellum posterior lobe (Cerebelum_Crus1_R), the left cingulate gyri, the left middle frontal gyrus, the left medial superior frontal gyrus, the right dorsolateral superior frontal gyrus, the left angular gyri, the bilateral superior parietal gyrus, the left inferior temporal gyrus and the left temporal pole. The negative correlated brain regions were observed in the left orbital part of inferior frontal gyrus, the left precentral gyrus and the left precuneus. Then the Cerebelum_Crus1_R was used as a seed region, and its positive covariance maps involved the bilateral cerebellum posterior (Cerebelum_10_L, Cerebelum_6_R), the left median cingulate and paracingulate gyri, the right superior frontal gyrus, the right olfactory cortex, the bilateral superior parietal gyrus, the left precuneus, the left rolandic operculum, left inferior temporal gyrus and the bilateral middle temporal gyrus. The negative correlation regions were observed in the left inferior frontal gyrus and the left middle frontal gyrus. For NC subjects, there were no significant positive or negative covariance maps. Subsequently, we further generated multi-connectivity matrices to perform the structural covariance analysis by using covariant brain regions as nodes and connectivity r values as the weights of the undirected edges. The results show that, compared with NC group, PI group exhibited more structural connections and fewer interrupted structural connection. Furthermore, in PI group, the changes of GMV values in the left cerebellum anterior lobe, the median cingulate and paracingulate gyri, the superior parietal gyrus, the inferior parietal gyrus, the precuneus, the inferior temporal gyrus, the right dorsolateral of superior frontal gyrus, the middle temporal gyrus were positively correlated with RAVLT-Short scores. In addition to these eight brain regions, changes of GMVs in the bilateral cerebellum posterior lobe, the olfactory cortex, the ipsilateral rolandic operculum were positively correlated with the changes in RAVLT-Long Scores. These findings can potentially lead us to a better understanding of the neurobiology mechanisms of clinical behavioral impairment and recoveryConclusion
In patients with pontine stroke, significant gray matter atrophy occurs in bilateral cerebellum posterior and extensive structural connections is disrupted involving the cortical brain regions, where the GMVs are correlated with behavioral scores. Therefore, the disordered changes in GMV and structural covariance may provide useful information in designing individualized rehabilitative strategies for pontine stroke patientsAcknowledgements
We are indebted to our patients and their caregivers for generously supporting our study. This study was supported by the Natural Science Foundation of China (81601467, 81871327, 81601472).References
Reference:
1. Diao, Q., et al., Regional structural impairments outside lesions are associated with verbal short-term memory deficits in chronic subcortical stroke. Oncotarget, 2017. 8(19): p. 30900-30907
2. Wang, C., et al., Structural covariance in subcortical stroke patients measured by automated MRI-based volumetry. Neuroimage Clin, 2019. 22: p. 101682.
3. Mechelli, A., et al., Structural covariance in the human cortex. J Neurosci, 2005. 25(36): p. 8303-10.
Figures