3894
Silent functional MRI for novel sound discrimination using the auditory oddball paradigm1Department of Neuroimaging, King's College London, London, United Kingdom, 2GE Healthcare, Munich, Germany
Synopsis
We present the first demonstration that a multi-echo variant of a silent fMRI pulse sequence (Looping Star) is sensitive to the BOLD response elicited by the processing of novel auditory stimuli. We employed an established event-related paradigm known as the ‘oddball’ task. Our results show remarkable consistency with a previous investigation using conventional loud fMRI with the same paradigm. We also demonstrate that Looping Star reveals activation differences between auditory challenges not visible using conventional fMRI. Additionally, between-subject correlations and differences in activation between sessions were evaluated. This study supports the use of Looping Star for studies of sound-averse populations.
Introduction
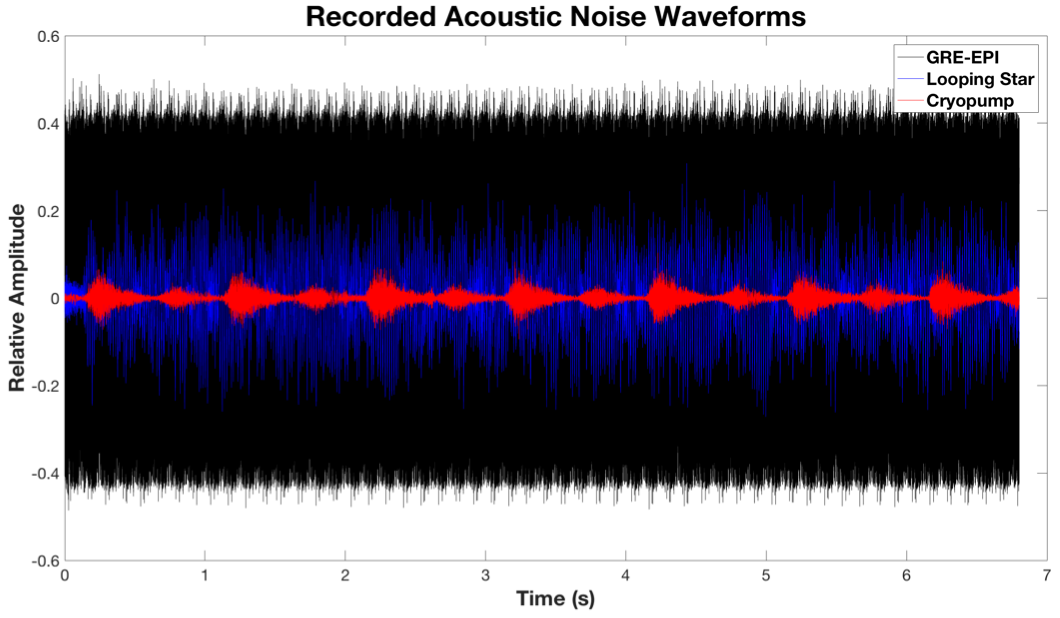
Looping Star (LS) is a multi-echo fMRI pulse sequence sensitive to the BOLD response evoked by blocked-design stimuli and rest1-5. Compared with conventional fMRI with gradient-echo echo-planar imaging (GRE-EPI), LS reduces acoustic noise by at least 33dBA4. This increases the tolerability of MRI examinations to patients averse or hypersensitive to high acoustic noise, and minimises the acoustic noise confound in data interpretation6,7.Event-related auditory paradigms have been widely used to investigate questions unsuited to blocked designs8,9, but implementation using fMRI has been difficult due to the high acoustic noise of GRE-EPI. The sensitivity of LS to BOLD responses during an event-related paradigm and the consistency of the evoked responses identified across sessions remains to be shown.
We hypothesised that LS would be sensitive to the BOLD response during an event-related auditory paradigm and could prove useful for recognising novel auditory stimuli due to its lower acoustic noise.
Methods
Twelve healthy participants (6 female; mean age=31.5±8.0 years) were scanned in two sessions at least one week apart whilst executing an event-related auditory oddball paradigm10. Participants’ comprehension of the paradigm and hearing ability were tested prior to the first scan using a frequency-shifted, shorter version of the paradigm.The paradigm involved three tone types (P=probability of occurrence), Deviant (P=0.09), Novel (P=0.07) and Standard (P=0.84) played with event duration 80ms and interval 625ms. Participants indicated with a button-box when either a Deviant or Novel tone was heard through MR-safe headphones. Six silent rest blocks of 10-second duration were evenly distributed and a video of neutral visual distractors was played throughout the paradigm. Deviant and Standard tones were swapped halfway through, to prevent tone habituation and boredom.
A 3T General Electric MR750 scanner with a 12-channel receive-only head coil was used. Acquisition parameters for single-echo GRE-EPI10: TE/TR=27.5/2500ms; slice thickness/slices=4mm/20; slice-gap=1mm; in-plane resolution=3.125mm; flip-angle=82°; 240 volumes; duration=10min. For multi-echo LS: TE/TR=0,16.1,32.2/2648ms; resolution=3.2mm; flip-angle=3°; readout bandwidth=46.875kHz; 24 spokes per echo; 72 spokes per segment; 1080 spokes per volume; 240 volumes; duration=10:35min. A 1.2mm resolution structural IR-SPGR image was also acquired.
The first ten volumes were removed for both modalities. Sequence order was randomised between participants and sessions. Sound levels were measured in a pilot session using a Casella 62X sound meter suspended in foam ~1.5m from the scanner bore. Image reconstruction for LS was conducted offline using nearest-neighbour gridding1.
GRE-EPI and optimally-combined11 LS volumes were pre-processed using a standard SPM-1212 pipeline after bias-field correction using ANTS N4-ITK13. This included slice-timing correction for GRE-EPI, spatial normalisation with images saved at 4mm isotropic resolution and smoothing with an 8mm FWHM kernel. For LS, the echo volumes were co-registered to the T1 image using the mean TE=0 image. De-noising, filtering and white matter/CSF regression were excluded.
Single-subject fixed-effects and group-level random-effects analyses were conducted in SPM-12 with cluster-level inference using an uncorrected cluster-forming threshold of p<0.001. Standard tones were not modelled, serving as an implicit baseline. The first-level general linear model included motion parameters as nuisance regressors and three conditions: Deviant, Novel and Silent. MNI co-ordinates14 and Brodmann areas were compared using BioImage Suite15.
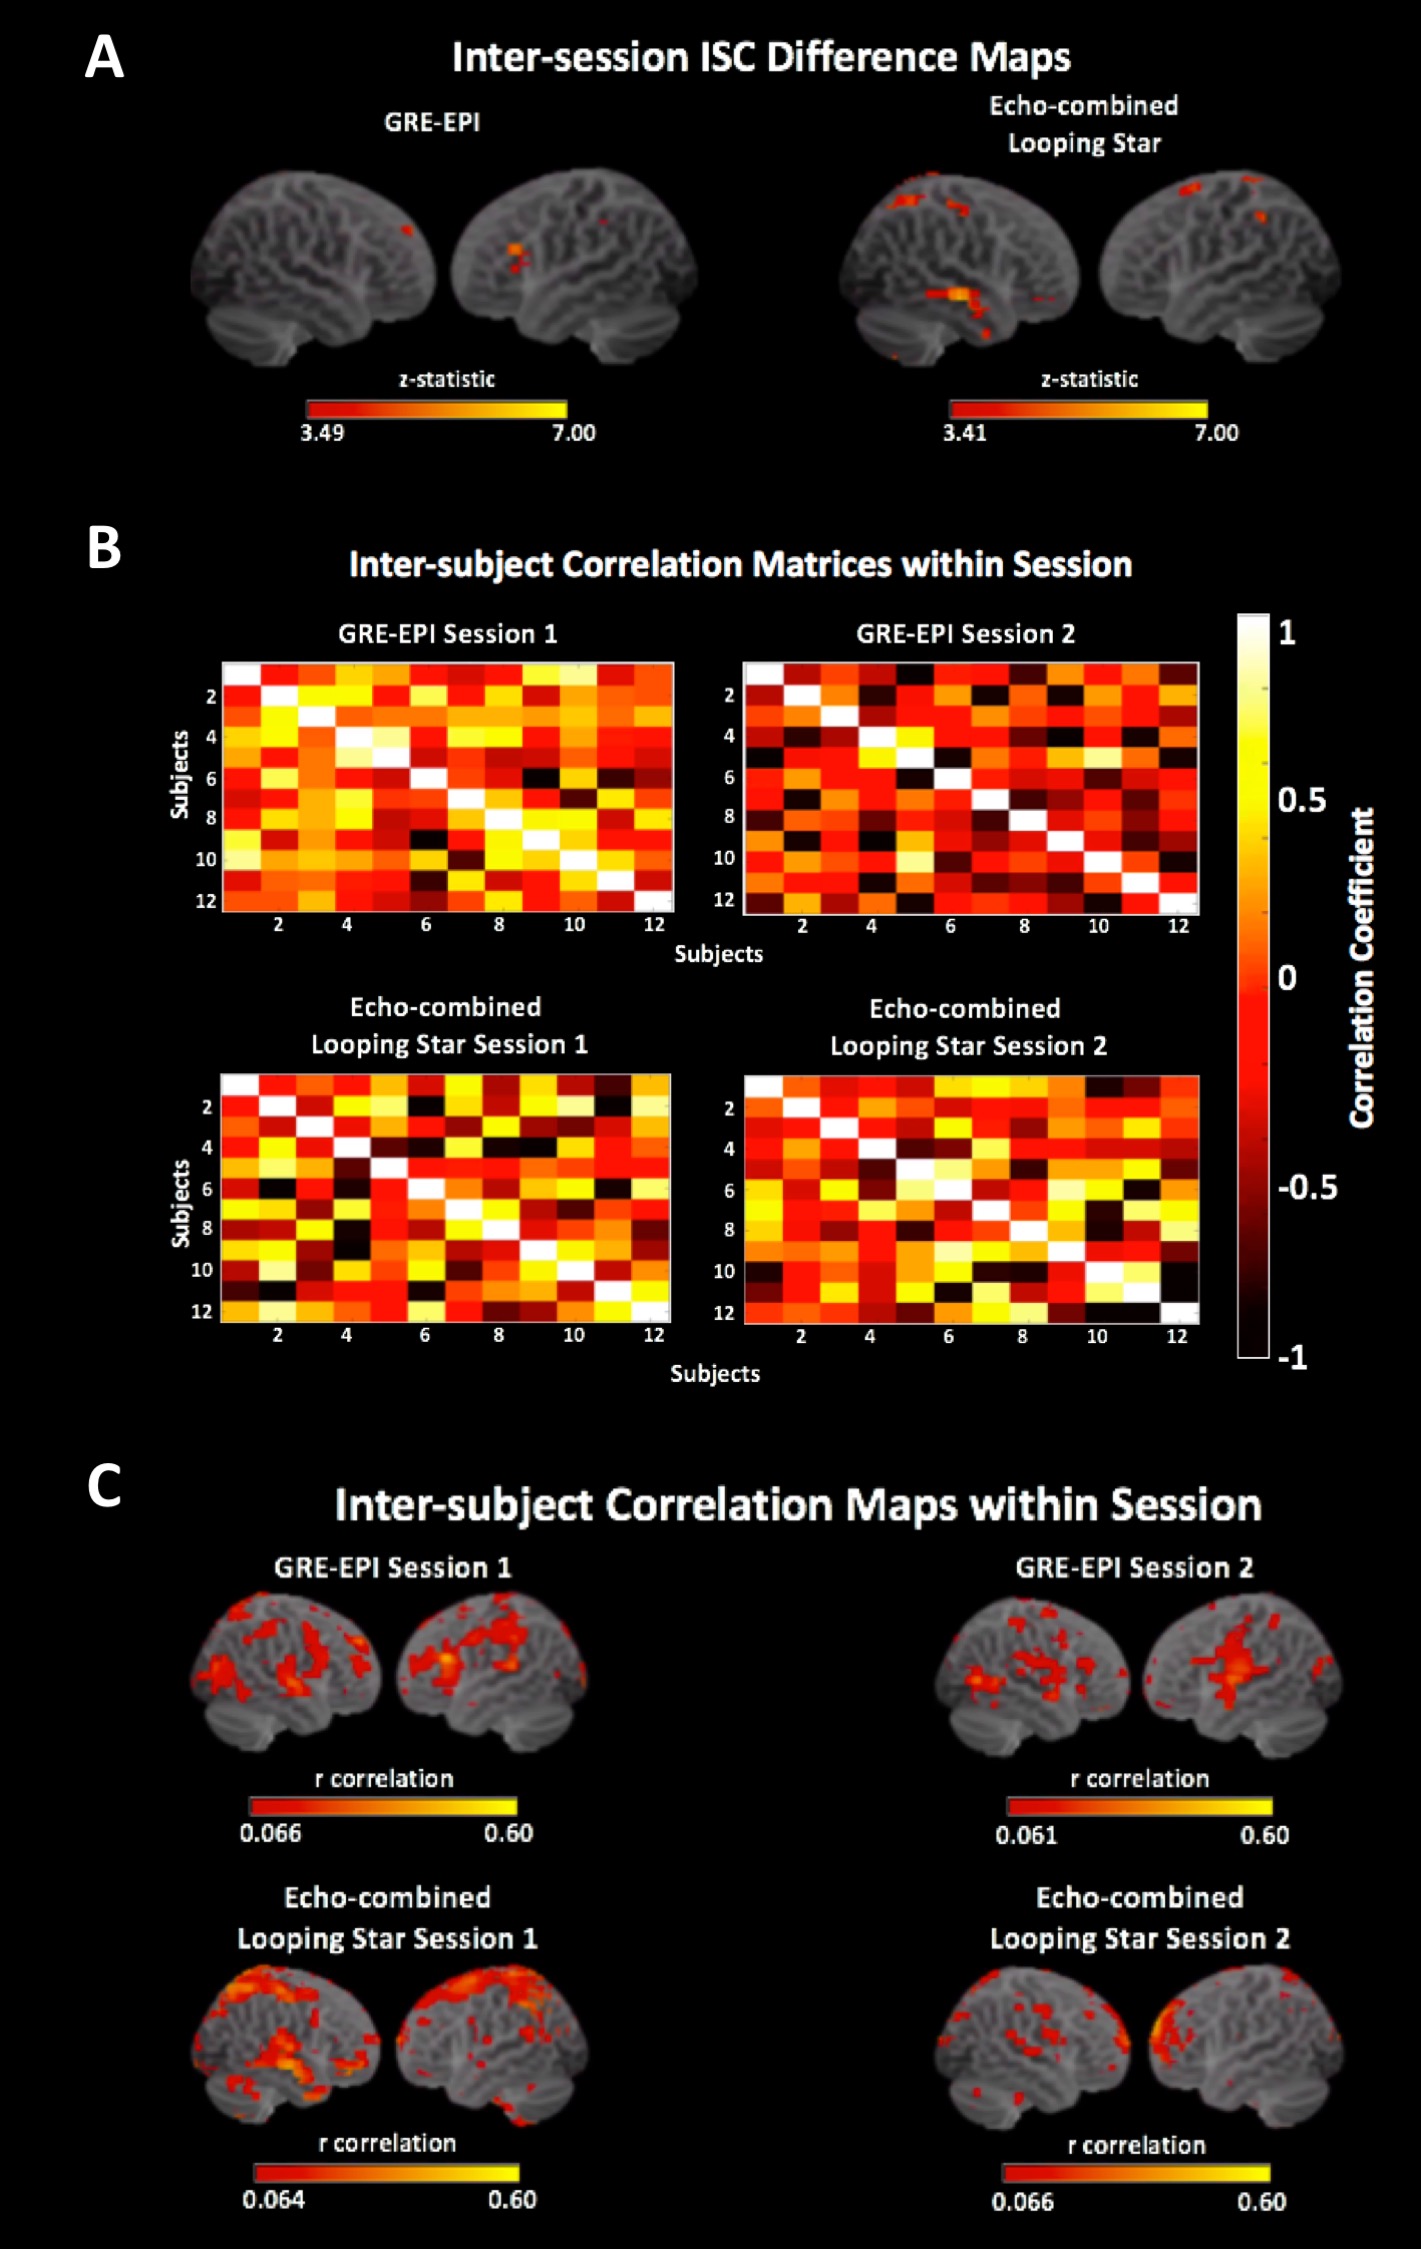
Inter-subject correlations (ISCs) and difference maps were calculated using the ISC toolbox16 to evaluate between-subject consistency. An inter-session paired t-test was performed to evaluate differences in activation between sessions.
Results
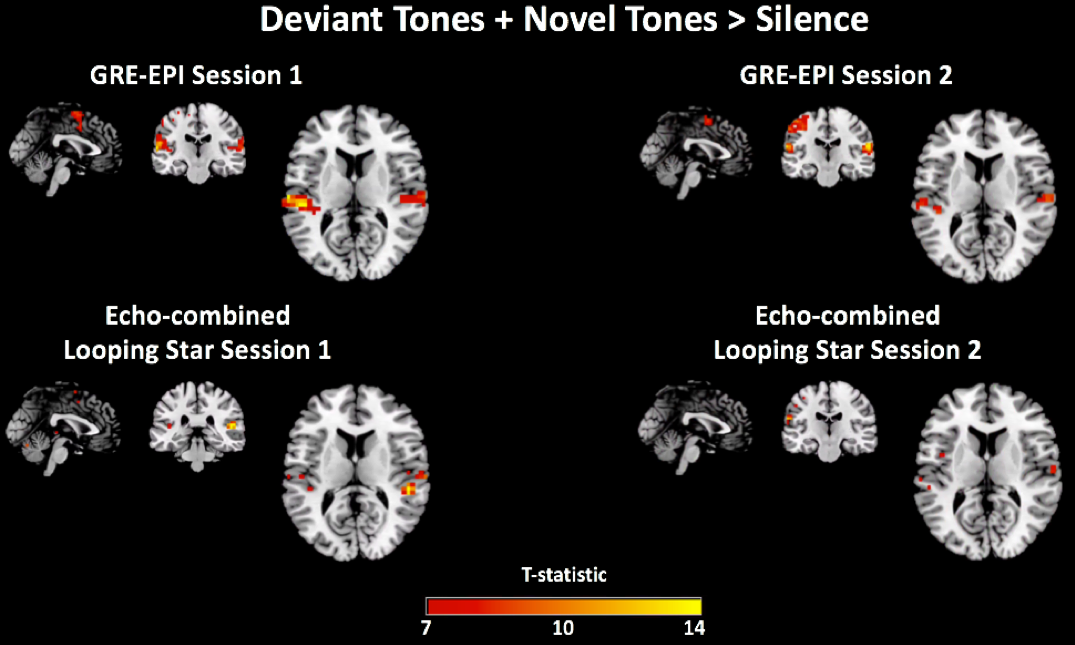
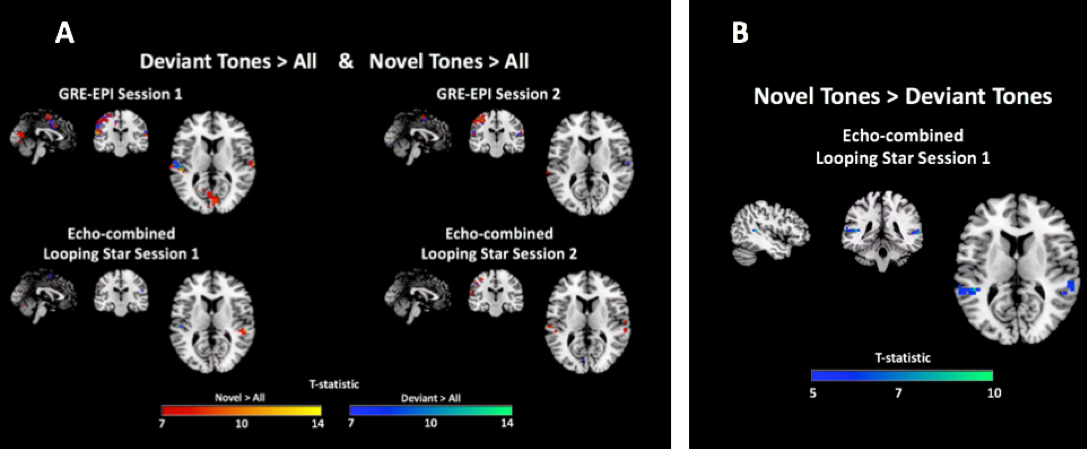
Analysis of behavioural responses indicated that participants comprehended the paradigm prior to scanning. Participants demonstrated best accuracy with lowest variability during the Session 1 LS scan. Mean accuracy across subjects was >86% in all cases. Figure 1 highlights acoustic waveform differences between modalities.We evaluated sensitivity to all tones compared with silence (Figure 2), which was detected in both sessions and modalities in auditory and motor regions as expected. GRE-EPI demonstrated broader activity at equal threshold. The responses to Deviant and Novel independently, demonstrated agreement with regions previously identified10 (Figure 3A).
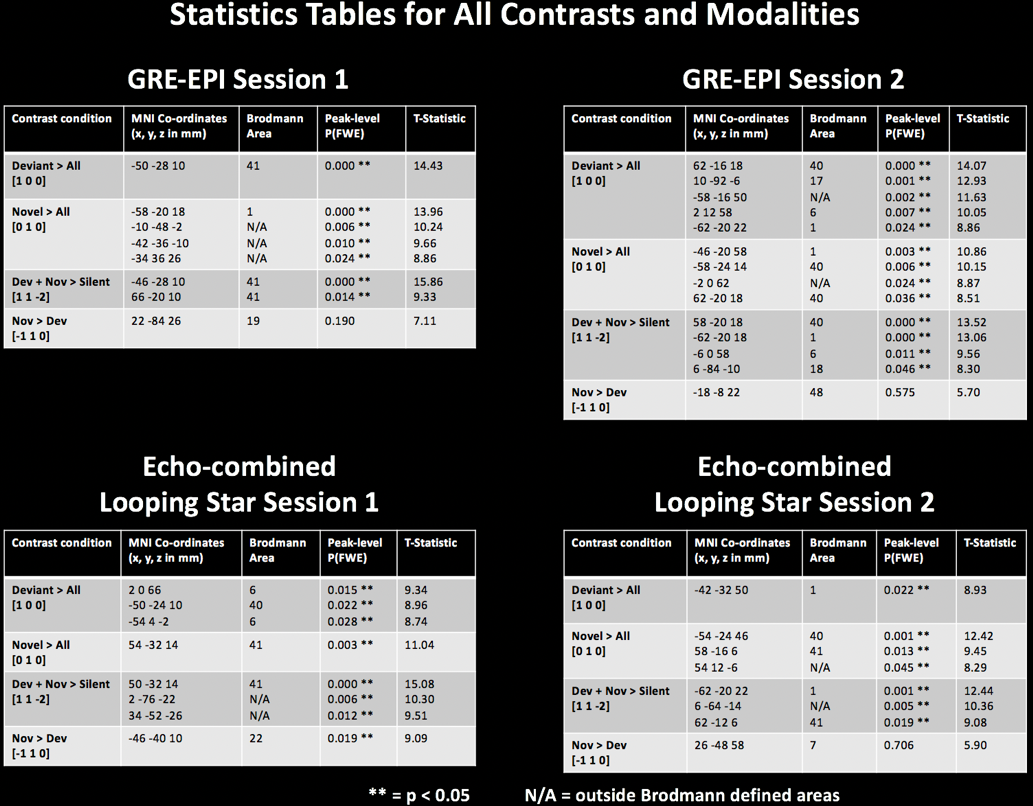
Importantly, we explored the benefit of silent scanning using the contrast Novel>Deviant and the only significant result appeared in LS Session 1 (Figure 3B). Statistical tables are shown in Figure 4. Furthermore, no modelled contrast produced significance for the paired t-test in either session direction or modality, suggesting no significant differences in activity between sessions.
Finally, ISCs indicated regions with consistent activation between subjects in both modalities, though the difference map highlighted regions in LS where ISCs differed between sessions (Figure 5).
Discussion
Our results indicate that LS offers adequate sensitivity to event-related auditory paradigms. Significant differences in the BOLD response between novel stimuli were only seen in LS Session 1, likely due to the low acoustic noise. The paired t-test suggested no inter-session regional differences in activation.Inter-session ISCs suggested greater consistency of between-subject correlations in GRE-EPI. This could relate to numerous subject-level mechanisms varying between sessions and modalities, such as attention/wakefulness17, habituation18 and error awareness19. This consistency in GRE-EPI could also result from the constant acoustic load, which is absent in LS. This requires further study.
Conclusions
We conclude that LS can be used to investigate auditory processing using event-related paradigms, and may better suit such studies due to minimisation of the acoustic noise confound. This study supports the efforts to translate LS to further investigations, especially those involving sound-averse populations, alongside silent structural techniques20,21.Acknowledgements
This study represents independent research supported by the National Institute for Health Research (NIHR) Biomedical Research Centre at South London and Maudsley NHS Foundation Trust and King’s College London. The first author (ND) is in receipt of a PhD studentship funded by the NIHR Maudsley Biomedical Research Centre. The views expressed are those of the author(s) and not necessarily those of the NHS, the NIHR or the Department of Health and Social Care.References
1. Wiesinger, F., Menini, A. and Solana, A.B. 2019. Looping Star. Magnetic resonance in medicine, 81(1), pp.57-68.
2. Damestani, N.L., Zelaya, F.O., and Lythgoe, D.J. 2018. Looping Star: a novel silent approach to imaging brain function in health and disease. In Proceedings of British Chapter for ISMRM. Oxford, United Kingdom.
3. Dionisio, B. and Solana-Sanchez, A. B. 2018. Silent Simultaneous EEG-fMRI using Looping-Star. In Proceedings of the 26th Annual Meeting of ISMRM. Paris, France. Abstract 4523.
4. Damestani, N.L., Lythgoe, D.J., Wiesinger, F., Solana, A.B., Williams, S.C.R., and Zelaya, F. 2019. Looping Star silent fMRI: a platform for improving studies of auditory processing. In Proceedings of the 27th Annual Meeting of ISMRM. Montreal, Canada. Abstract 0363.
5. Damestani, N.L., Lythgoe, D.J., Wiesinger, F., Solana, A.B., Williams, S.C.R., and Zelaya, F. 2019. Identifying functional resting state networks in silence using Looping Star. In Proceedings of the 25th Annual Meeting of OHBM. Rome, Italy. Abstract 1929.
6. Gaab, N., Gabrieli, J., and Glover, G.H. 2007. Assessing the influence of scanner background noise on auditory processing. I. An fMRI study comparing three experimental designs with varying degrees of scanner noise. Human Brain Mapping. 28:703‐720.
7. Gaab, N., Gabrieli, J., and Glover, G.H. 2007. Assessing the influence of scanner background noise on auditory processing. II. An fMRI study comparing auditory processing in the absence and presence of recorded scanner noise using a sparse design. Human Brain Mapping. 28:721‐732
8. Del Re, E.C., Spencer, K.M., Oribe, N., Mesholam-Gately, R.I., Goldstein, J., Shenton, M.E., Petryshen, T., Seidman, L.J., McCarley, R.W. and Niznikiewicz, M.A. 2015. Clinical high risk and first episode schizophrenia: auditory event-related potentials. Psychiatry Research: Neuroimaging, 231(2), pp.126-133.
9. Donkers, F.C., Schipul, S.E., Baranek, G.T., Cleary, K.M., Willoughby, M.T., Evans, A.M., Bulluck, J.C., Lovmo, J.E. and Belger, A. 2015. Attenuated auditory event-related potentials and associations with atypical sensory response patterns in children with autism. Journal of autism and developmental disorders, 45(2), pp.506-523.
10. Gomot, M., Bernard, F.A., Davis, M.H., Belmonte, M.K., Ashwin, C., Bullmore, E.T. and Baron-Cohen, S. 2006. Change detection in children with autism: an auditory event-related fMRI study. Neuroimage, 29(2), pp.475-484.
11. Kundu, P., Inati, S.J., Evans, J.W., Luh, W.M. and Bandettini, P.A. 2012. Differentiating BOLD and non-BOLD signals in fMRI time series using multi-echo EPI. Neuroimage, 60(3), pp.1759-1770.
12. The FIL Methods Group. SPM-12 Software Version 7219. Accessed October 2019. https://www.fil.ion.ucl.ac.uk/spm/software/spm12/
13. Tustison, N.J., Avants, B.B., Cook, P.A., Zheng, Y., Egan, A., Yushkevich, P.A. and Gee, J.C. 2010. N4ITK: improved N3 bias correction. IEEE transactions on medical imaging, 29(6), p.1310.
14. Evans, A.C., Collins, D.L., Mills, S.R., Brown, E.D., Kelly, R.L. and Peters, T.M. 1993. October. 3D statistical neuroanatomical models from 305 MRI volumes. In 1993 IEEE conference record nuclear science symposium and medical imaging conference (pp. 1813-1817). IEEE.
15. Papademetris, X. 2008. Brodmann Areas defined in MNI space using a new Tracing Tool in BioImage Suite. Human Brain Mapping. Accessed October 2019. http://sprout022.sprout.yale.edu/mni2tal/mni2tal.html
16. Kauppi, J.P., Pajula, J. and Tohka, J. 2014. A versatile software package for inter-subject correlation based analyses of fMRI. Frontiers in neuroinformatics, 8, p.2.
17. Mitchell, T.V., Morey, R.A., Inan, S. and Belger, A. 2005. Functional magnetic resonance imaging measure of automatic and controlled auditory processing. Neuroreport, 16(5), p.457.
18. Kiehl, K.A. and Liddle, P.F. 2003. Reproducibility of the hemodynamic response to auditory oddball stimuli: A six‐week test–retest study. Human Brain Mapping, 18(1), pp.42-52.
19. Harsay, H.A., Spaan, M., Wijnen, J.G. and Ridderinkhof, K.R. 2012. Error awareness and salience processing in the oddball task: shared neural mechanisms. Frontiers in Human Neuroscience, 6, p.246.
20. Ljungberg, E., Solana-Sanchez, A. B., Wood, T. C., Kolind, S., Wiesinger, F., and Barker, G. J. 2018. Silent T1-Mapping Using the Variable Flip Angle Method with Zero Echo Time. In Proceedings of the 26th Annual Meeting of ISMRM. Paris, France. Abstract 0270.
21. Wood, T. C., Ljungberg, E., Solana-Sanchez, A. B., and Wiesinger, F. 2019. Silent Myelin Imaging with a dipolar-coupled/inhomogeneous MT-Prepared ZTE Radial Sequence. In Proceedings of the 27th Annual Meeting of ISMRM. Montreal, Canada. Abstract 4896.
22. Audacity® software is copyright © 1999-2019 Audacity Team. Web site: https://audacityteam.org/. It is free software distributed under the terms of the GNU General Public License. The name Audacity® is a registered trademark of Dominic Mazzoni.
23. Holmes, C.J., Hoge, R., Collins, L., Woods, R., Toga, A.W. and Evans, A.C. 1998. Enhancement of MR images using registration for signal averaging. Journal of computer assisted tomography, 22(2), pp.324-333.
24. Rorden, C. and Brett, M. 2000. Stereotaxic display of brain lesions. Behavioural neurology, 12(4), pp.191-200.
Figures