3892
Paired Sham and Active Groups Activate Different Brain Regions to the Same Feedback Signal during fMRI Neurofeedback1Boston Children's Hospital and Harvard Medical School, Boston, MA, United States
Synopsis
There is growing interest in fMRI neurofeedback (fMRI-nf) to facilitate therapeutic reorganization of brain function. However, the mechanisms underlying self-regulation processes are incompletely understood. Here we interrogate the mechanisms of fMRI-nf using an experimental protocol designed to increase lateralized motor activity. Twelve right-handed healthy adults were assigned into age- and sex-matched active and sham study arms. Each participant received active or sham feedback during one scanning session. We constructed group-averaged activation maps and lateralization index. During neurofeedback, active and sham groups demonstrated different brain activation. We did not observe any long-lasting functional reorganization and improvement in lateralization index.
INTRODUCTION
Closed-loop fMRI neurofeedback uses imaging correlates of current brain activity to provide subject-specific feedback in real-time. Real-time feedback is expected to help participants develop mental strategies that engages intrinsic self-regulation processes, which could then lead to therapeutic reorganization of brain function1. To date however, the neuroanatomy specific to the neurofeedback process, and the mechanism by which the brain is able to modulate activity via fMRI-nf remain unknown. In this study, we use an fMRI-nf paradigm targeting an increase in lateralized motor activity, adapted from Neyedli and colleagues2, along with active and sham conditions in which matched feedback was provided to investigate the neural mechanisms of neurofeedback.METHODS
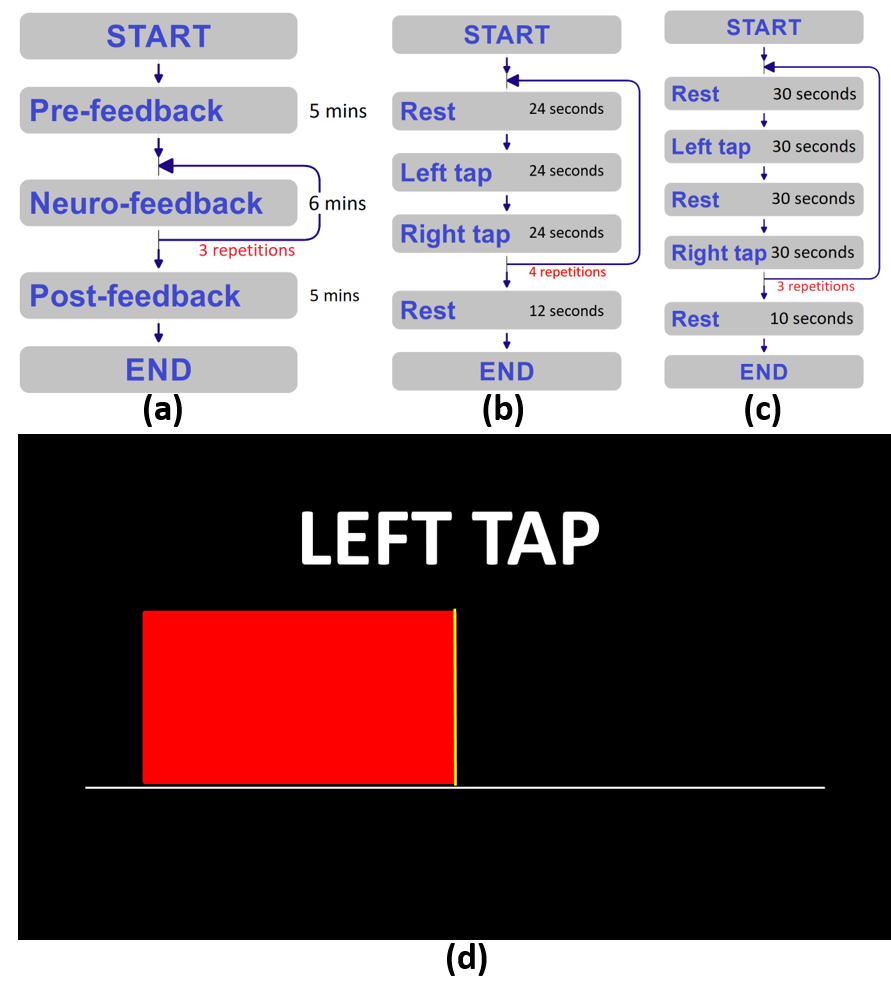
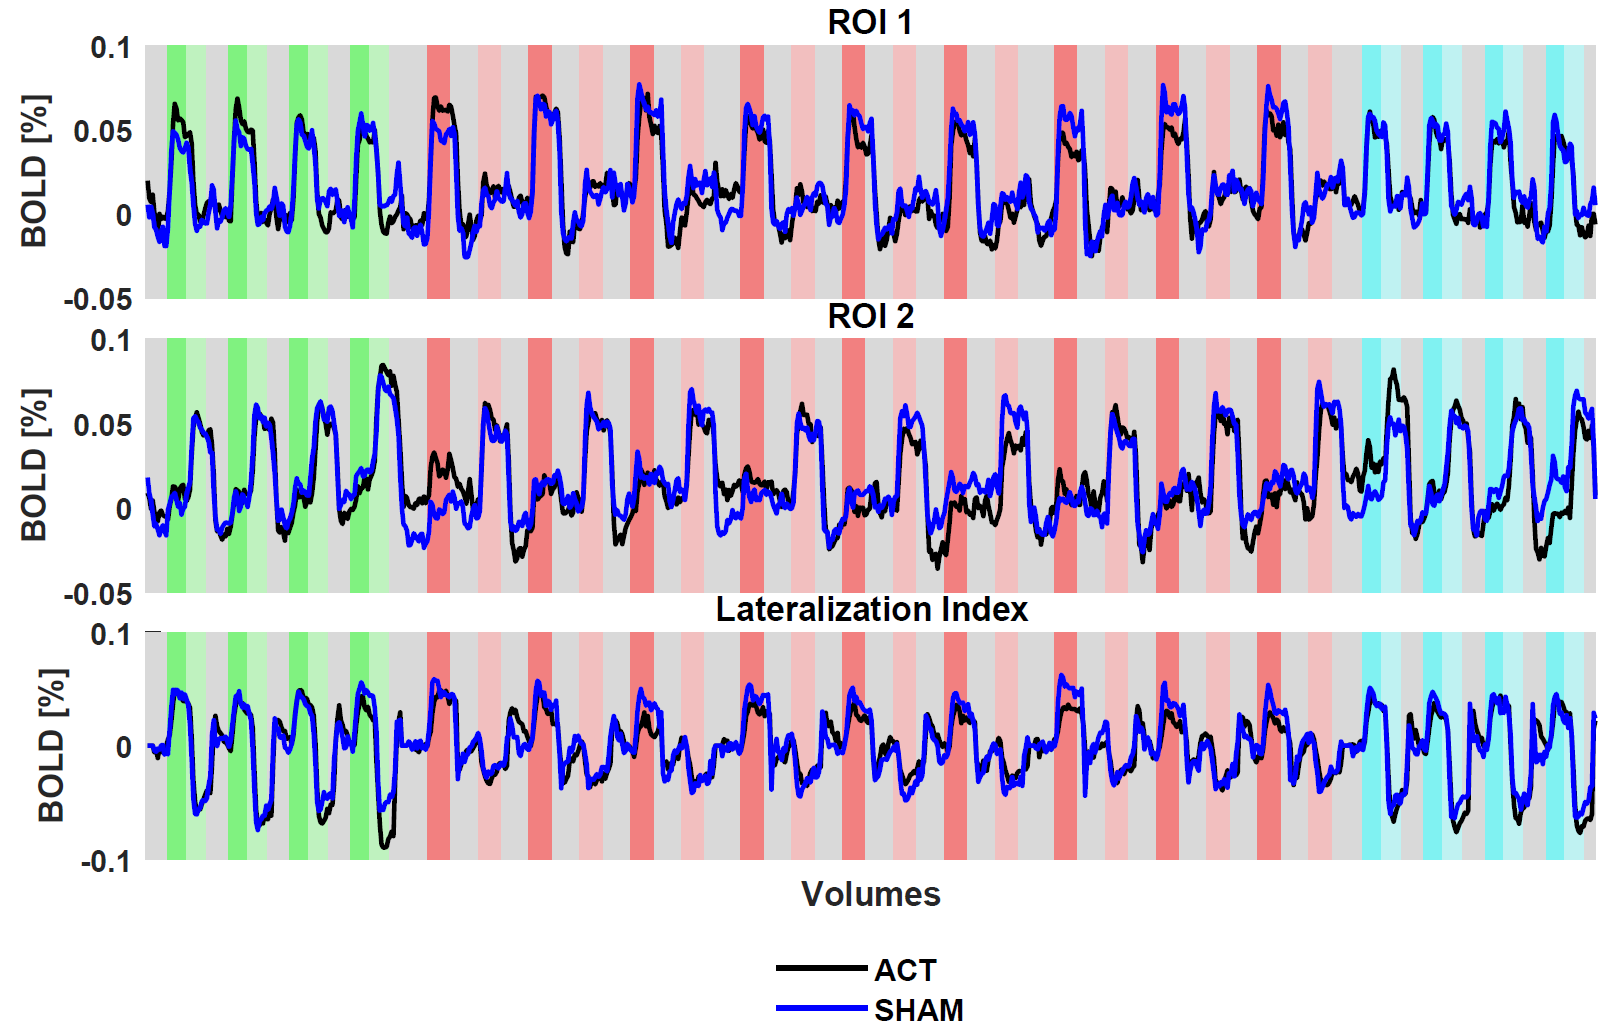
Twelve healthy, right-handed adult participants were assigned to age- and sex- matched active and sham groups. Participants in the Active group received feedback based on their own brain activity while Sham group participants received feedback based on pre-recorded brain activity of an age- and sex-matched participant from the Active group. For each scanning session, we acquired structural T1- and T2-weighted images and five finger-tap task fMRI runs, consisting of one pre-feedback, three neuro-feedback, and one post-feedback run (Figure 1). fMRI data were acquired using an EPI sequence with isotropic resolution of 3 mm and a repetition time (TR) of 2 seconds. Using the Turbo-BrainVoyager3 software package for real-time fMRI analysis and ROI timeseries extraction, we calculated a Laterality Index (LI), defined as the difference between percent signal change (PSC) in a left motor cortex ROI vs. a right motor cortex ROI, with the PSC calculated with respect to the most recent rest block. During neurofeedback runs, a rectangular bar whose width changed in real-time according to the LI was presented on the screen in addition to the instruction text (Figure 1). We compared activation maps of active vs sham groups during neuro-feedback, as well as post- vs pre-feedback to assess for functional reorganization. fMRIPrep4 was used for offline preprocessing of all fMRI data while statistical analyses were performed using FSL5, with group-level comparisons based on subject-level models. In addition, the effectiveness of the fMRI-nf paradigm was assessed by comparing the average LI between pre- and post-feedback scans, representing persistent effects of neurofeedback on the LI.RESULTS
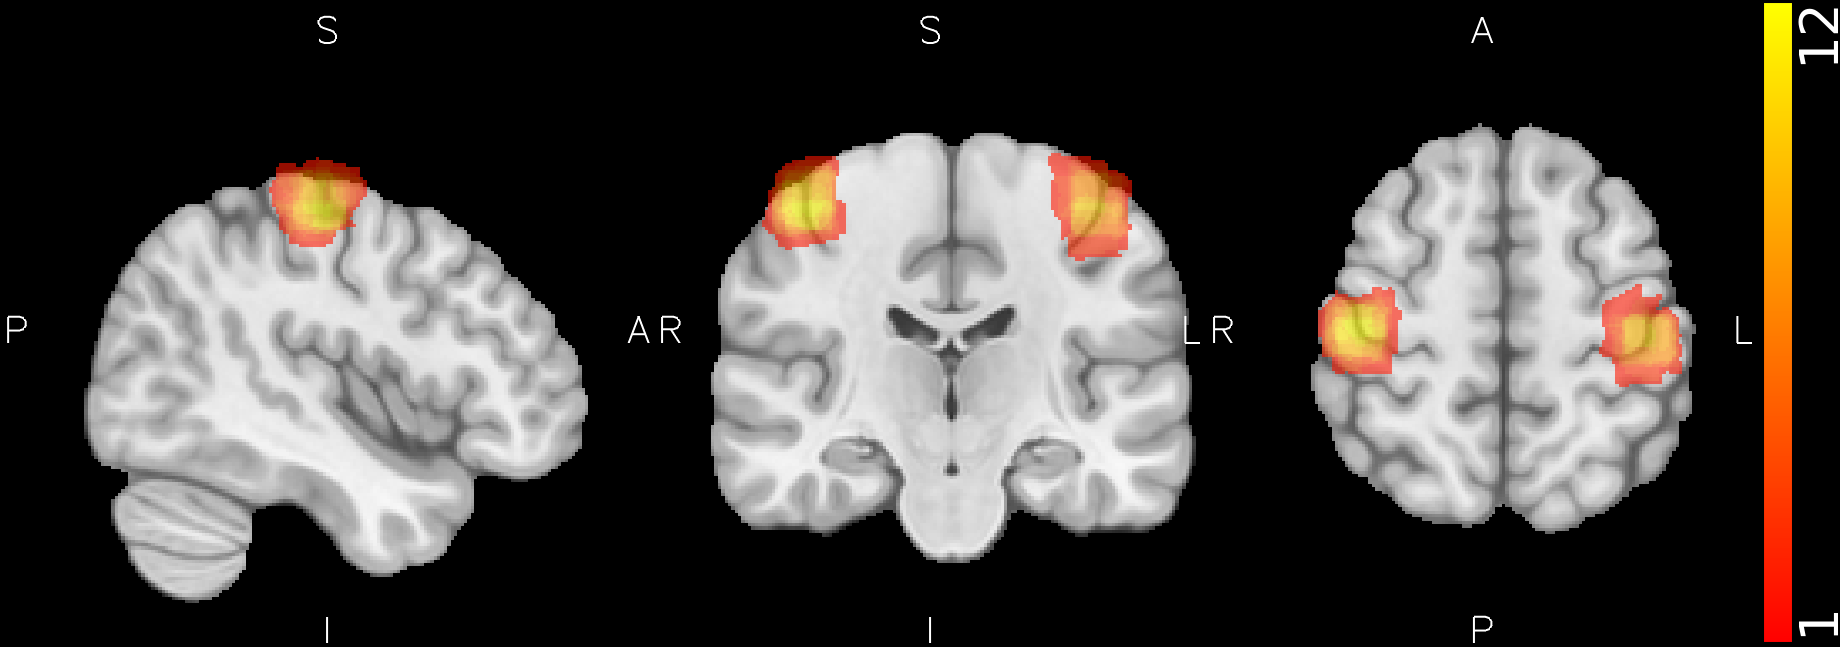
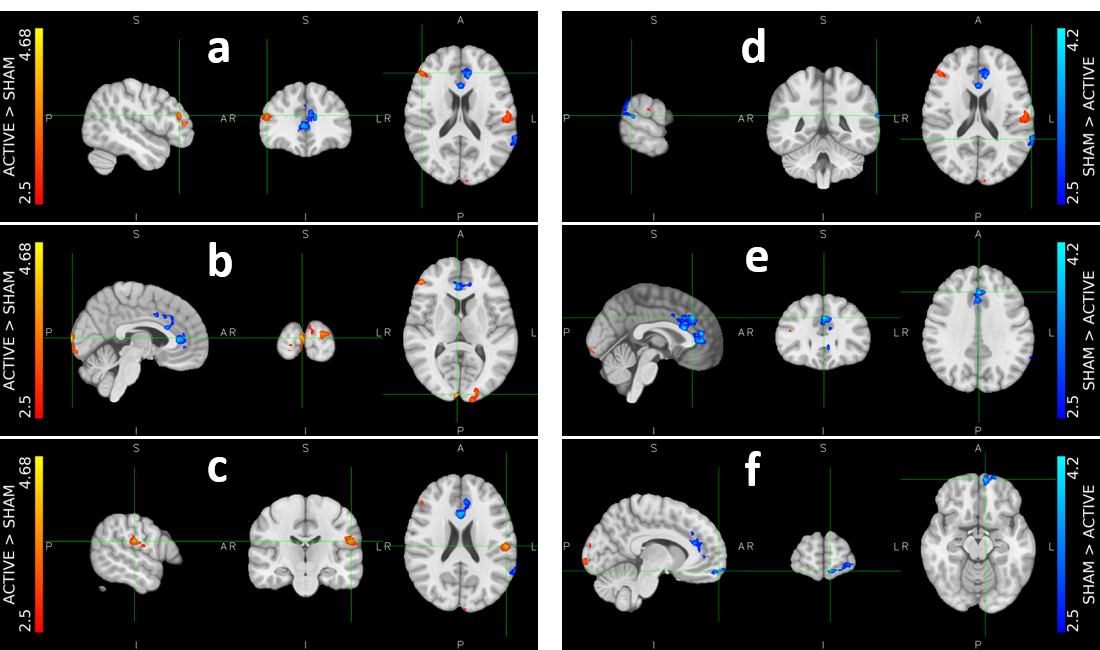
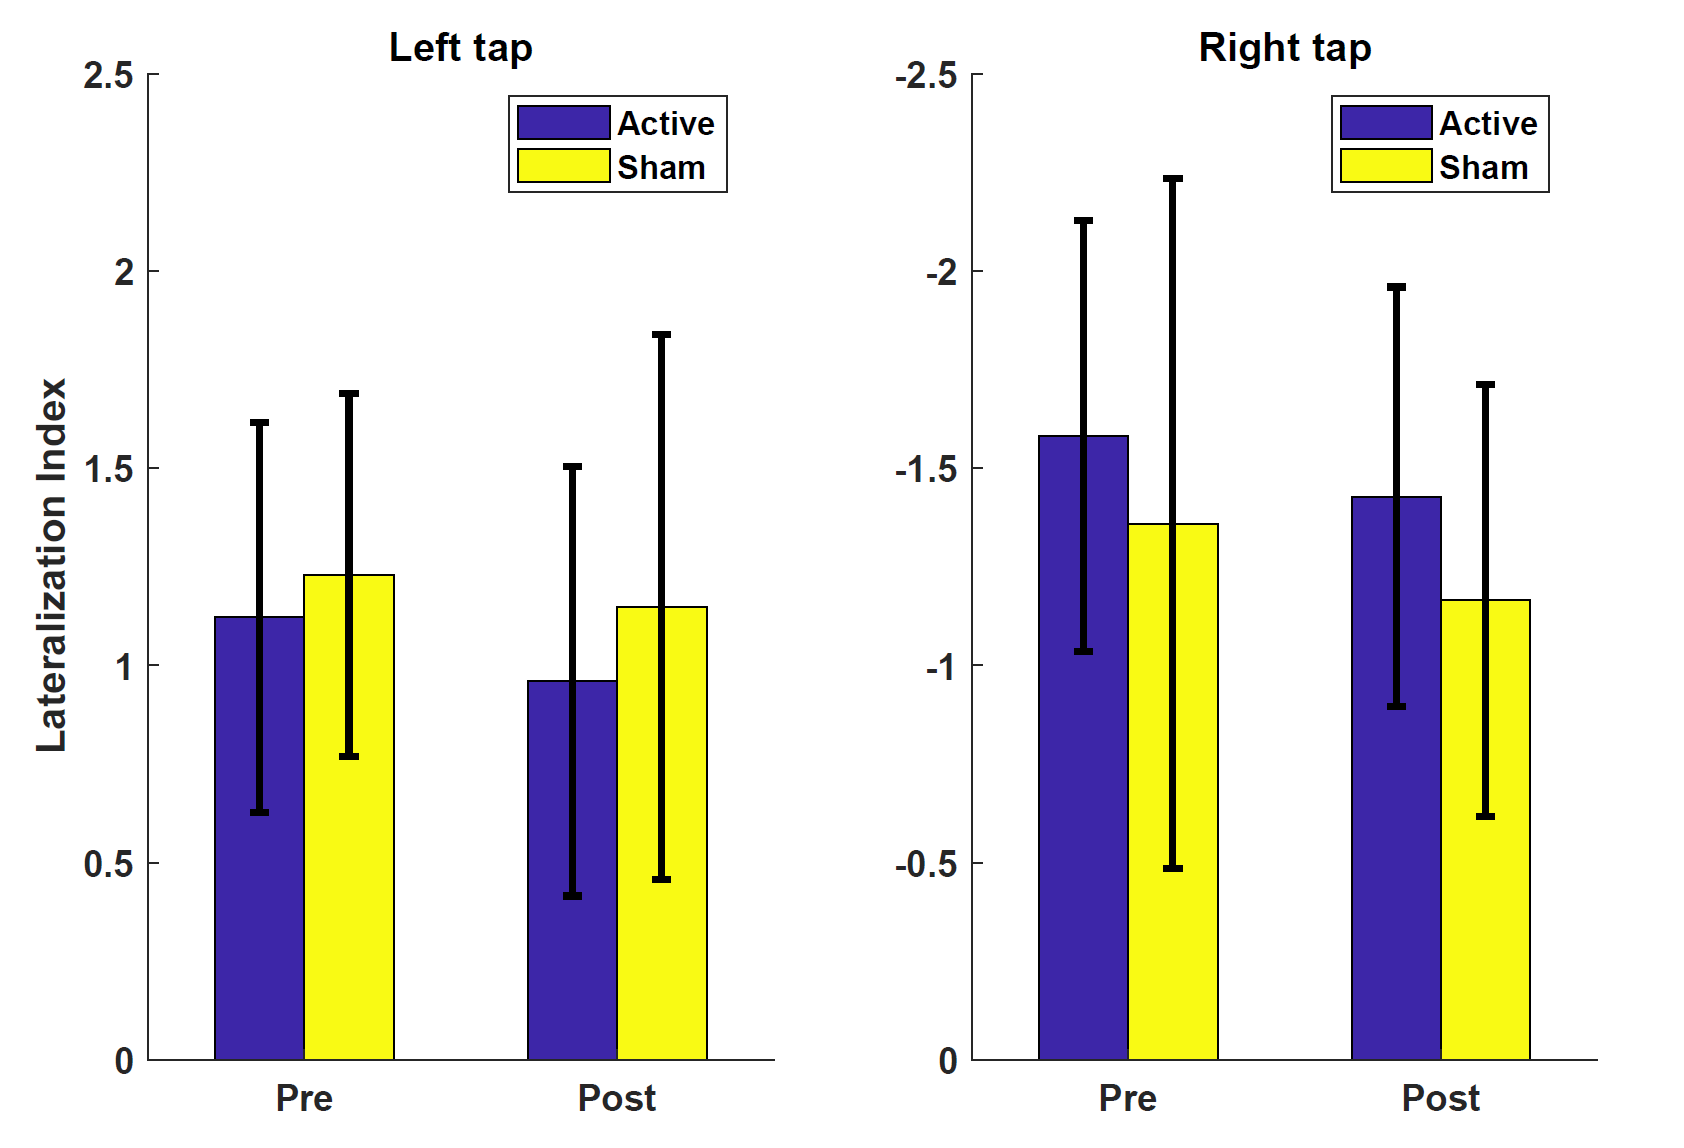
There was a significant overlap across all selected ROIs (Figure 2) when mapped to template space, consistent with predicted hand motor cortex representations. For all participants to perceive a similar experience regardless of group assignment, we matched one-to-one the visual stimuli of the participants in the active and sham groups. We believe this placebo condition gave participants in the sham group a similar feel as participants in the active group. Indeed, both active and sham participants thought they had a strong control over the bar size based on the questionnaire, with average scores of 3.2 ± 0.8 and 3.0 ± 1.1 out of 5, respectively. Regardless, Comparison of activation maps of pre- and post-feedback scan showed no long-lasting functional reorganization in either group. However, during neurofeedback runs, there was consistently higher activation in visual cortex, somatosensory cortex, and inferior frontal gyrus in the active group compared to the sham group while the sham group demonstrated higher activation of regions in cingulate gyrus, frontal pole, and subramarginal gyrus (Figure 3). Interestingly, the measured LI during neuro-feedback runs is smaller than that of pre- and post-feedback runs (Figure 4). While comparison of the LI averaged across the left-tap and right-rap blocks of the pre- and post-feedback runs, for both active and sham groups found no statistically significant change in the lateralization index from pre- to post-feedback despite a slight decrease across both taps and groups (Figure 5).DISCUSSION
We investigated brain activity during neurofeedback using an experimental protocol designed to facilitate increased lateralized motor activity. Our findings suggest that sham subjects engage different brain circuits than active group despite the exact stimuli. This could potentially be an indicator of error-detection/conflict resolution networks that sham subjects activate due to irrelevant (however plausible) feedback they receive. Alternatively, these results may indicate specific regions that need to be activated or de-activated to achieve effective neurofeedback. However, while these results are suggestive, further investigation to draw concrete conclusion due to our small sample size is needed. In addition to a larger sample size, we intend to improve upon several aspects of the current experimental design, such as facilitating a double-blind protocol, automatic ROI-selection, and integration of button boxes.CONCLUSION
In this proof of concept study, we demonstrate the feasibility of neurofeedback with fMRI as well as identify several regions that are differentially utilized by the brain during active vs sham neurofeedback which may indicate that these regions represent important mediators or moderators of effective neurofeedback. If replicated, these findings would lead to an ability to compare and select treatment paradigms and potentially predict response across participants.Acknowledgements
This research was supported in part by the following grants: NIH-5R01EB019483, NIH-4R01NS079788 and NIH-R44MH086984.References
1Neyedli, H.F., Sampaio-Baptista, C., Kirkman, M.A., Havard, D., Lührs, M., Ramsden, K., Flitney, D.D., Clare, S., Goebel, R. and Johansen-Berg, H., 2018. Increasing lateralized motor activity in younger and older adults using real-time fMRI during executed movements. Neuroscience, 378, pp.165-174.
2Thibault, R.T., Lifshitz, M. and Raz, A., 2016. The self-regulating brain and neurofeedback: experimental science and clinical promise. cortex, 74, pp.247-261.
3Goebel, R., 2012. BrainVoyager—past, present, future. Neuroimage, 62(2), pp.748-756.
4Esteban, O., Markiewicz, C., Blair, R.W., Moodie, C., Isik, A.I., Aliaga, A.E., Kent, J., Goncalves, M., DuPre, E., Snyder, M. and Oya, H., 2018. FMRIPrep: a robust preprocessing pipeline for functional MRI. bioRxiv, p.306951.
5Jenkinson, M., Beckmann, C.F., Behrens, T.E., Woolrich, M.W. and Smith, S.M., 2012. Fsl. Neuroimage, 62(2), pp.782-790.
Figures