3891
Connectivity analyses of accelerated 3D resting-state ASL1Radiology, Division of MRI Research, Beth Israel Deaconess Medical Center, Harvard Medical School, Boston, MA, United States, 2Neurology and Radiology, University of Pennsylvania, Philadelphia, PA, United States
Synopsis
We used a single-shot accelerated volumetric Arterial Spin Labeling (ASL) sequence to study brain connectivity in regions where resting-state (rs) BOLD analyses can be challenging due to low signal to noise ratio (SNR). Thus, we chose to study the medial prefrontal cortex, part of the default-mode network (DMN), and the subcallosal cortex for which RS-BOLD is impacted by susceptibility artifacts. We also studied the connectivity of the intracalcarine cortex because it belongs to a network involving deep nuclei, for which BOLD signal is reduced due to low blood volume.
Introduction
Brain functional connectivity has become a popular neuroscience research technique1. It is usually assessed by measuring resting-state fluctuations of the BOLD signal using fast Gradient-Echo EPI sequences. However, the BOLD signal is affected by non-neuronal noise2, susceptibility artifacts near air tissue interface and low blood volume within deep nuclei. An alternative method would therefore be valuable.Arterial Spin Labeling (ASL) can be used for functional connectivity by studying the resting-state fluctuations of cerebral blood-flow (CBF), which shows less susceptibility to non-neuronal noise3. Additionally, the use of non-EPI spin-echo sequences such as Stack-of-Spirals RARE shows less susceptibility towards off-resonance while allowing volumetric imaging.
Based on recent work using an approximate golden angle rotation of spirals between slice encodes and repetitions4, supporting high quality single-shot reconstruction with 3D parallel imaging/compressed sensing (CS), the study of resting-state network fluctuations with sufficient-enough spatiotemporal resolution using independent component analysis4 is now possible. Thus, the aim of this work was to study brain connectivity in regions where RS-BOLD suffers from low signal to noise ratio (SNR). We chose the medial prefrontal cortex (MPFC), part of the default mode network (DMN), the intracalcarine cortex and the subcallosal cortex.
Methods
Twenty-eight healthy volunteers were scanned twice on a 3T scanner (GE Discovery MR750) with a 32-ch head coil (Nova Medical). Acquisitions included a 1mm isotropic 3D T1-w FSPGR sequence and an ASL sequence using a golden-angle Stack-of-Spirals RARE trajectory, with 13 interleaves rotated by an approximate golden-angle (10π/13) of a 1536 points spiral waveform (TR/TE=6574/12.9ms, receiver bandwidth=125 kHz, echo-spacing 12ms, individual spiral waveforms of 6.1ms). Thirty-two centrically ordered slices of 4mm thickness were acquired within an acquisition time of 9 minutes. Label and control images were interleaved followed by rotations of the spiral encode patterns after each pair. 39 excitations were acquired corresponding to 3 averages of 13 rotations. The ASL preparation relied on a background-suppressed unbalanced pseudo-continuous ASL (pCASL) scheme (1.8s labeling, 1.8s post-labeling delay) with interleaved labeling and background suppression pulses.The thirty-nine single-shot perfusion-weighted volumes were reconstructed using a L1-wavelet CS reconstruction of the complex subtracted data using the BART toolbox5, as previously described4.
We post-processed the SS ASL volumes using SPM12 and homemade MATLAB scripts, as followed: (1) segmentation and normalization to the MNI152 space of the T1 volumes; (2) ASL time-series realignment for motion-correction using rigid registration; (3) registration of the perfusion volumes to the native gray matter map; (4) normalization of the coregistered SS ASL volumes to the MNI152 space by applying the deformation field calculated for the normalization of the 3DT1 images; (5) global normalization of the volumes to remove the global mean signal; (6) smoothing the globally normalized ASL volumes with a 4mm FWHM Gaussian kernel and (7) removal of the first volume of the time-series which can be affected by a transient effect.
We used the CONN toolbox6 with the default parameters to perform seed-to-voxel connectivity analyses using the following a priori regions of interest: medial prefrontal cortex (MPFC), left and right intracalcarine cortex and the subcallosal cortex. Both ASL exams were used for each subject but two due to poor labeling efficiency. Thus, the connectivity analyses were performed on 54 scans. Cluster-level T-contrasts are obtained using non-parametric statistics (permutation/randomization tests). Type I error was controlled through the use of voxel-level and cluster-level thresholds (respectively, p <0.01 uncorrected and p <0.05 cluster-size false discovery rate corrected).
Results
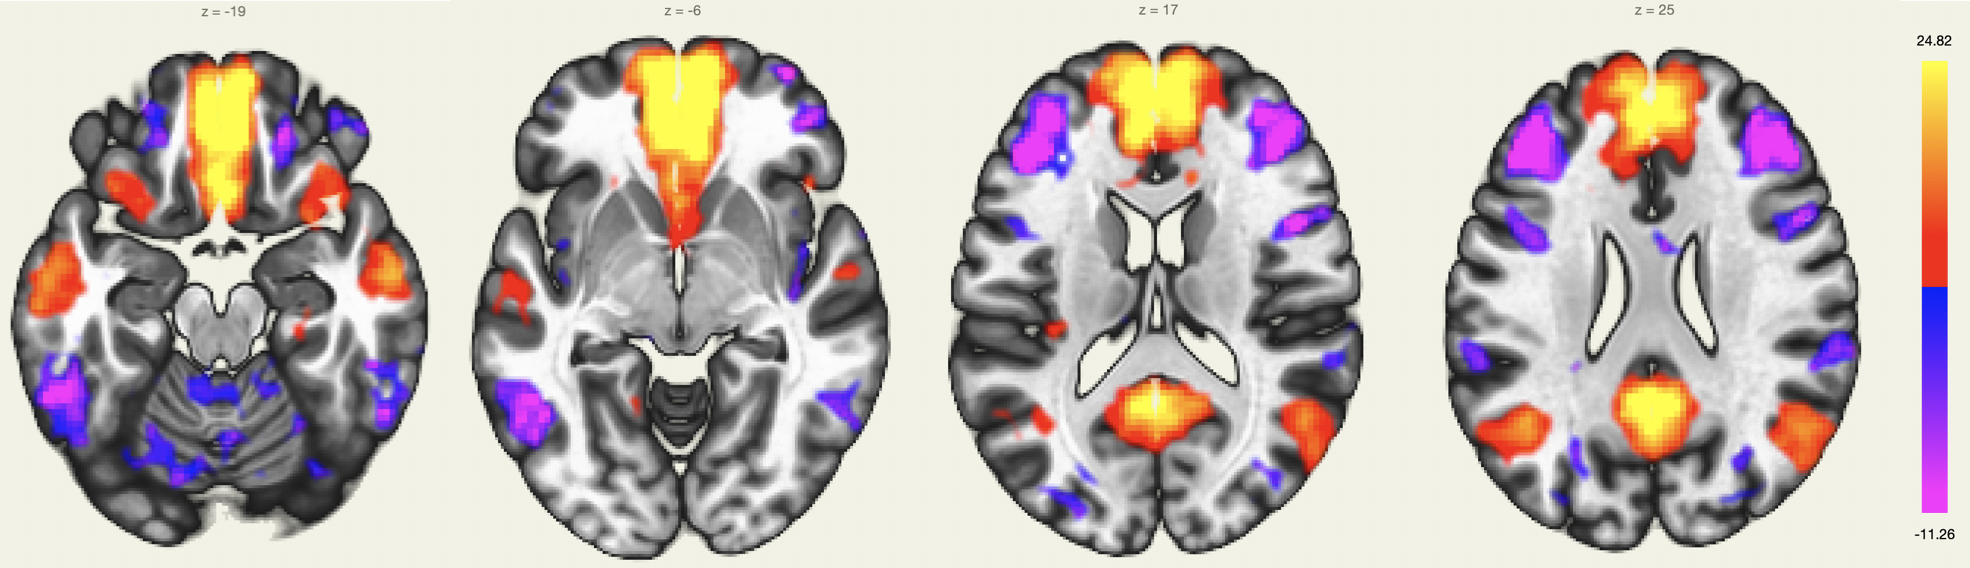
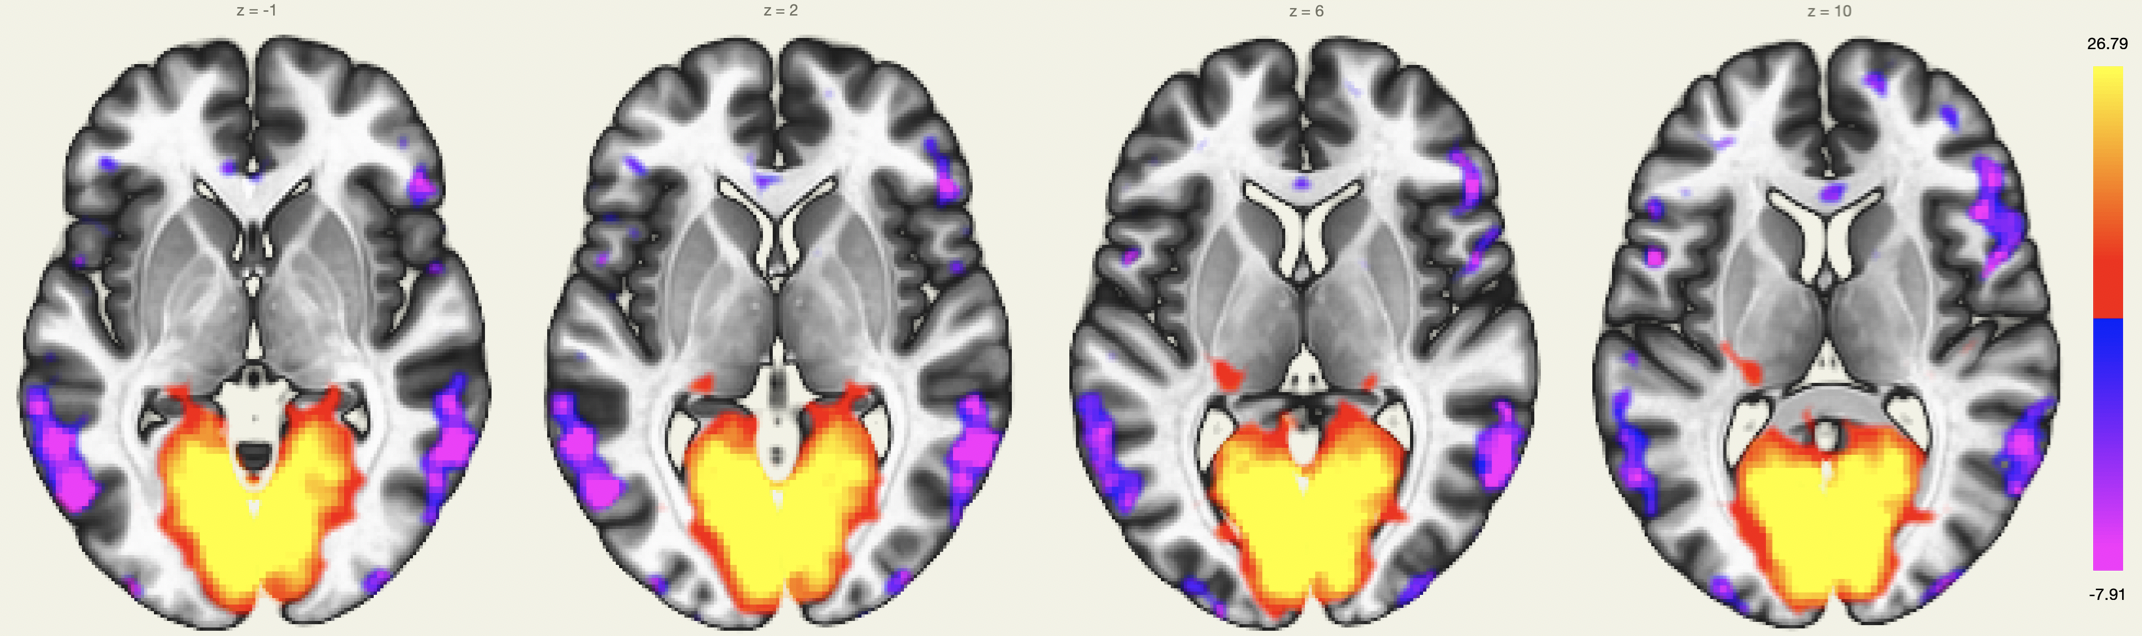
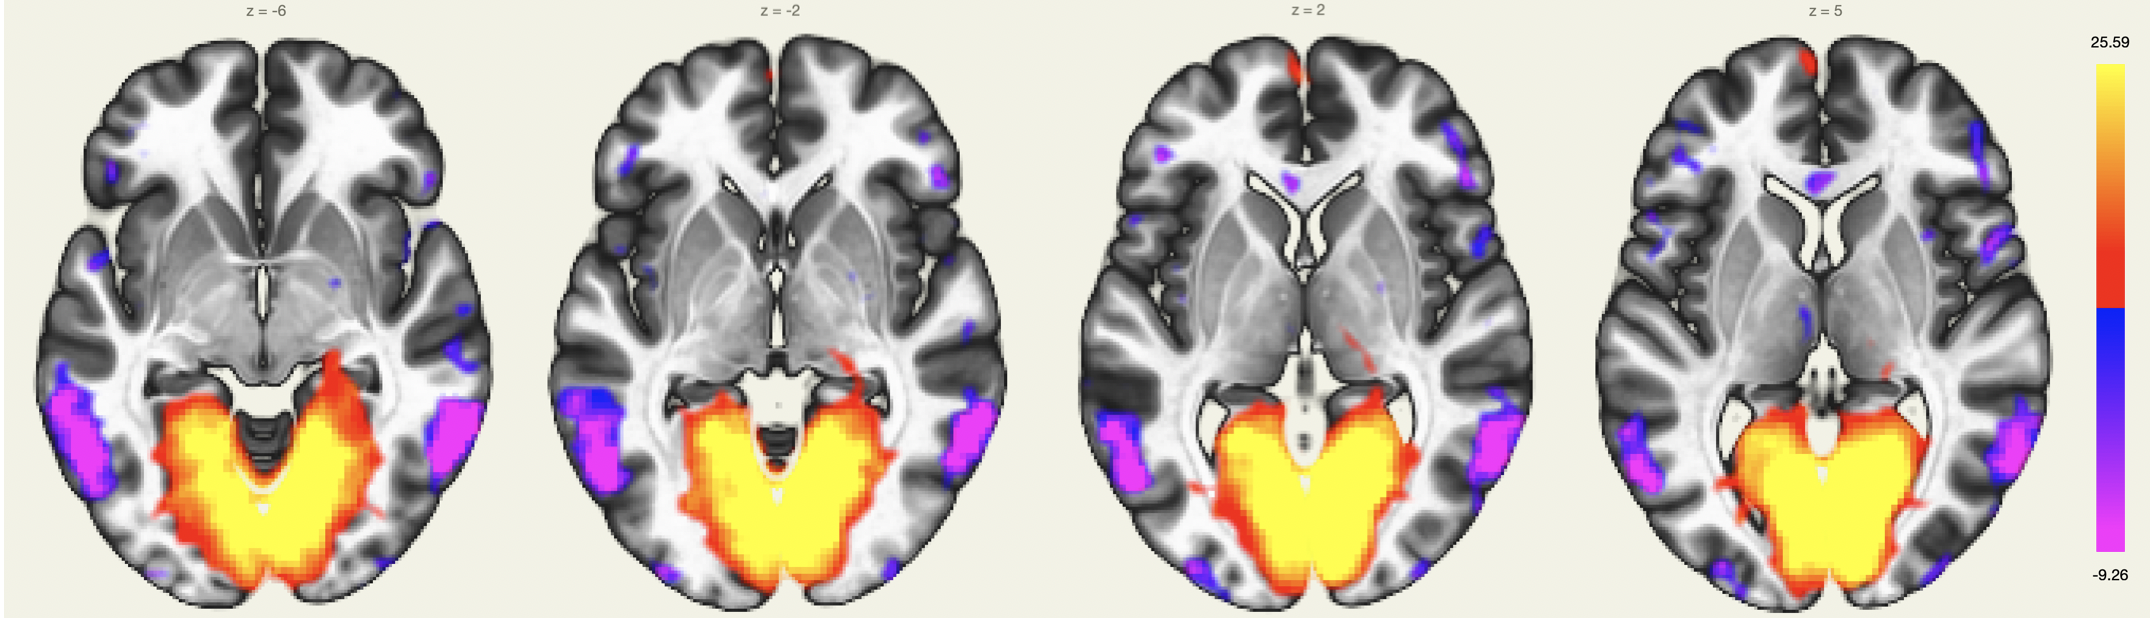
The MPFC is connected to the posterior cingulate cortex (PCC) and inferior parietal lobule (IPL), other regions involved in the DMN. The DMN also showed extensions in the orbitofrontal cortex and inferior temporal lobes (Figure 1).The intracalcarine cortex is where the primary visual cortex is concentrated and, thus, is involved in the visual network. It is directly connected to both lateral geniculate nuclei, located in the thalami, which were detected by rs-ASL analysis (Figure 2 and Figure 3).
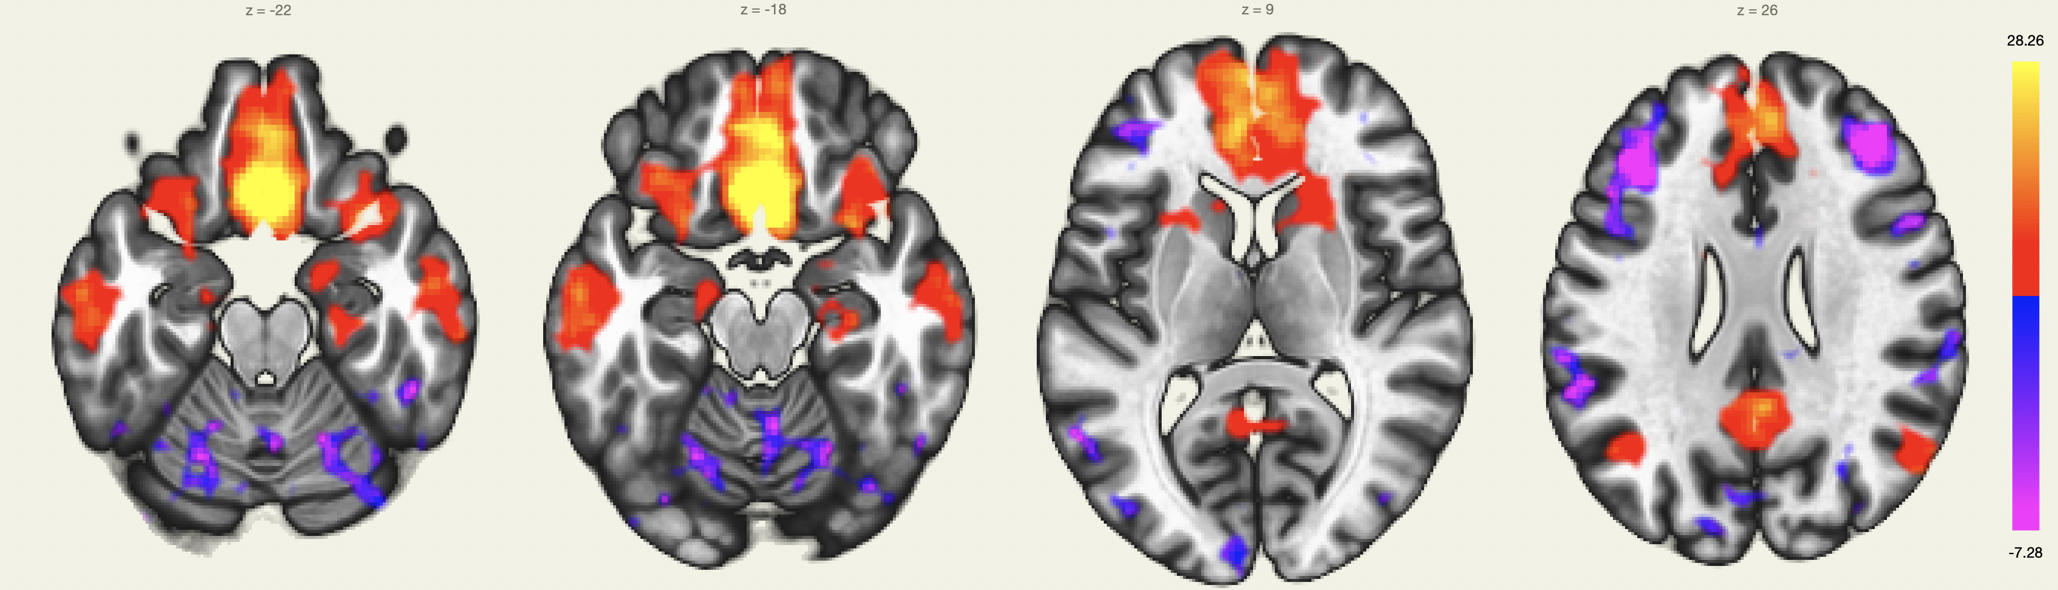
The subcallosal cortex belongs to the depression network, and thus, is connected to the amygdala, the hippocampus, the anterior and posterior portions of the cingulate cortex and negatively correlated with the prefrontal cortex (Figure 4).
Discussion
Using a single-shot accelerated volumetric ASL acquisition, we were able to study brain networks for which some regions are not always detected with rs-BOLD due to low SNR or susceptibility issues. An extension of the DMN in the orbitofrontal cortex and the temporal lobes was detected, as previously described3. Among the deep nuclei, lateral geniculate nuclei for the visual network, amygdala and hippocampus for the depression network were also highlighted. Seed-to-voxel connectivity analyses of rs-BOLD data for these subjects are in process to evaluate differences and potential benefits and pitfalls of both techniques.Acknowledgements
No acknowledgement found.References
1. Friston, K. J. Functional and Effective Connectivity: A Review. Brain Connectivity 1, 13–36 (2011).
2. Keilholz, S. D., Pan, W.-J., Billings, J., Nezafati, M. & Shakil, S. Noise and non-neuronal contributions to the BOLD signal: applications to and insights from animal studies. NeuroImage 154, 267–281 (2017).
3. Dai, W., Varma, G., Scheidegger, R. & Alsop, D. C. Quantifying fluctuations of resting state networks using arterial spin labeling perfusion MRI. J Cereb Blood Flow Metab 36, 463–473 (2016).
4. Munsch, F. et al. Rotated Stack of Spirals 3D RARE for Single-shot Volumetric ASL Acquisition. in Proceedings of the 27th annual meeting of the ISMRM vol. 3931 (2019).
5. Uecker, M. et al. Berkeley Advanced Reconstruction Toolbox. in Proc. Intl. Soc. Mag. Reson. Med 2486 (2015).
6. Whitfield-Gabrieli, S. & Nieto-Castanon, A. Conn: A Functional Connectivity Toolbox for Correlated and Anticorrelated Brain Networks. Brain Connectivity 2, 125–141 (2012).
Figures