3890
Dynamic Missing-data Completion Removes Additional Effect of Motion Contamination Caused by Temporal Filtering during fMRI Preprocessing1Boston Children's Hospital and Harvard Medical School, Boston, MA, United States, 2TrueMotion, Inc., Boston, MA, United States
Synopsis
Subject movement during fMRI acquisition creates motion artifact. “Scrubbing” removes motion-corrupted volumes and is performed after temporal filtering since it creates temporal discontinuities. Thus, it does not prevent the spread of corrupted time samples from high motion volumes to their neighbors during temporal filtering. To mitigate this “leakage”, we propose a novel method, Dynamic Missing-data Completion (DMC), that replaces motion corrupted volumes with synthetic data matching the temporal dynamics of the uncorrupted no-motion volumes. We analyzed six rsfMRI scans with different motion levels and found that DMC provides added benefit in further reduction of motion contamination that remains after scrubbing.
INTRODUCTION:
Subject movement during an fMRI acquisition introduces correlated noise that alters the timeseries of brain regions of interest (ROIs) and remains a significant issue in pediatric and clinical populations. “Scrubbing”, one method that aims to reduce the effect of subject motion, is the removal of motion-corrupted data volumes before functional connectivity analysis1. Since removing affected volumes creates temporal discontinuities in the data, scrubbing must be performed after temporal filtering. As such, scrubbing does not prevent the leakage of motion artifact from high motion volumes into neighboring volumes during temporal filtering. To address this issue, we propose a novel method, Dynamic Missing-data Completion (DMC), that replaces motion-corrupted data volumes with synthetic data that matches the temporal dynamics of the surrounding uncorrupted no-motion volumes prior to temporal filtering and excision. Specifically, DMC fills in missing data (corrupted volumes) by solving a convex relaxation of a Hankel-structured matrix rank minimization problem, which has less computational cost than the tensor factorization approach proposed by Yokota and colleagues2. Here, we compare DMC+Scrubbing to Scrubbing Alone and a Baseline pipeline that does not perform motion-based excision.METHODS:
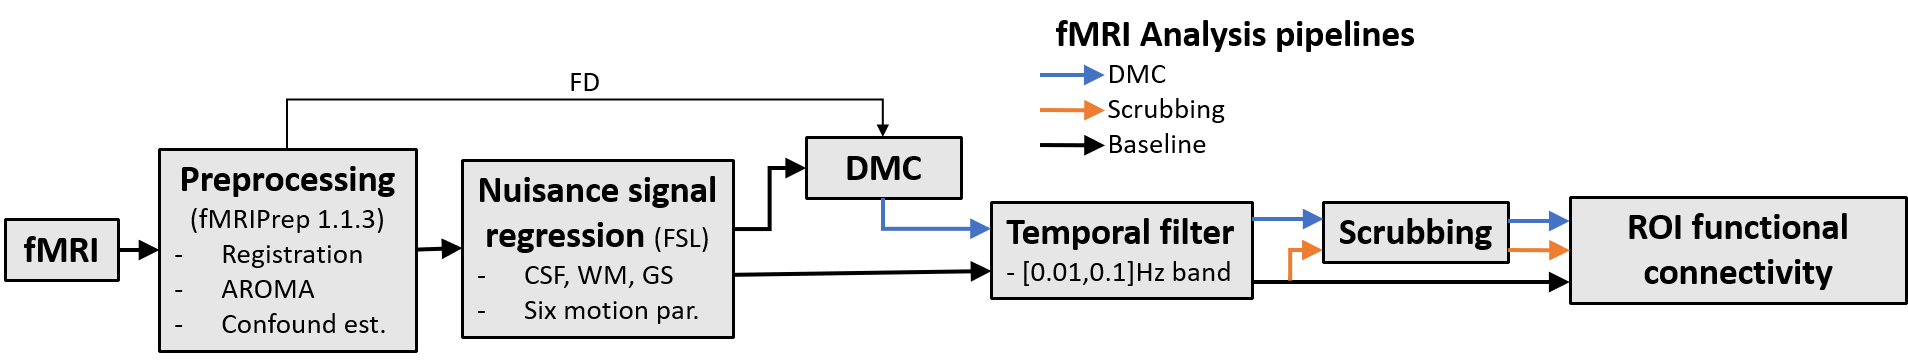
We acquired six rsfMRI runs with different levels of subject motion from a healthy volunteer to test our proposed method. Each run was analyzed using three pipelines (Baseline, Scrubbing, and DMC+Scrubbing), as shown in Figure 1. The Baseline pipeline was implemented using fMRIPrep3 and consisted of: registration to MNI space, intra-run re-alignment, and non-aggressive AROMA denoising4, followed by nuisance signal regression of white matter, cerebrospinal fluid, global signal average timeseries, and 6 motion parameters. A bandpass temporal filter with cut-off frequencies of 0.01-0.1Hz was applied before analysis. The Scrubbing pipeline added a step after temporal filtering that removed volumes with Framewise Displacement (FD) greater than 0.5 mm, along with 1 preceding and 2 succeeding volumes. Finally, the DMC pipeline also included the Scrubbing step, but first replaced high-motion volumes with synthetic data that matched the temporal dynamics of uncorrupted volumes prior to temporal filtering and subsequent Scrubbing. As such, DMC specifically addresses motion contamination, or ‘leakage’, caused by temporal filtering that is not captured by Scrubbing alone. To quantify the effect of leakage of motion artifact from high motion volumes to their neighbors during temporal filtering, we separated all data volumes in six rsfMRI runs into 3 categories: 1) uncorrupted no-motion volumes that were at least five volumes further (outside 5-neighborhood) from scrubbed data, 2) high-motion volumes that are scrubbed, and 3) volumes in 5-neighborhood of scrubbed data. We compared the mean and standard deviation of brain signal, defined as vectorized BOLD values of all brain voxels in the corresponding volume, in these 3 categories. We then used a published post-cingulate (PCC) ROI5 to create exemplary ROI-based functional connectivity timeseries and voxel-wise correlation maps.RESULTS:
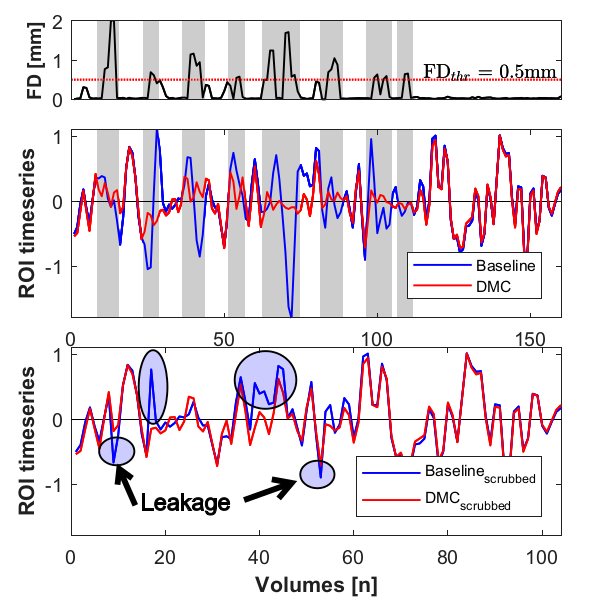
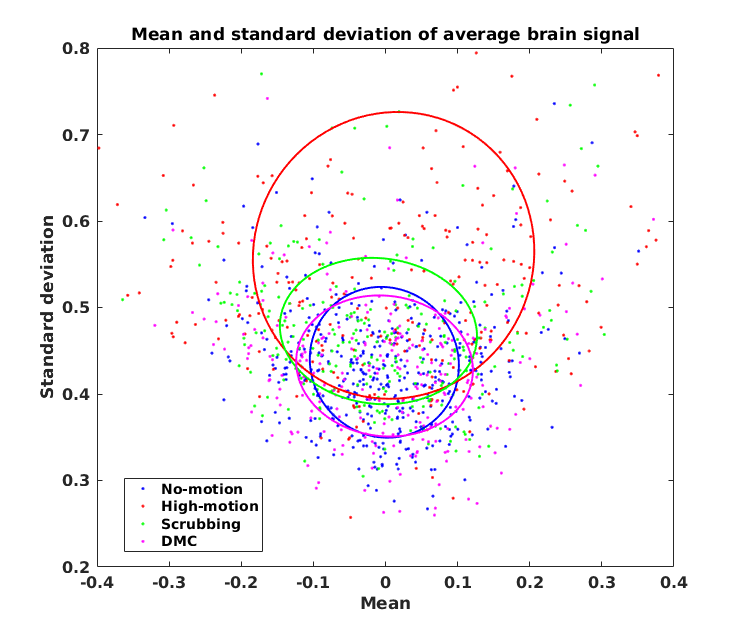
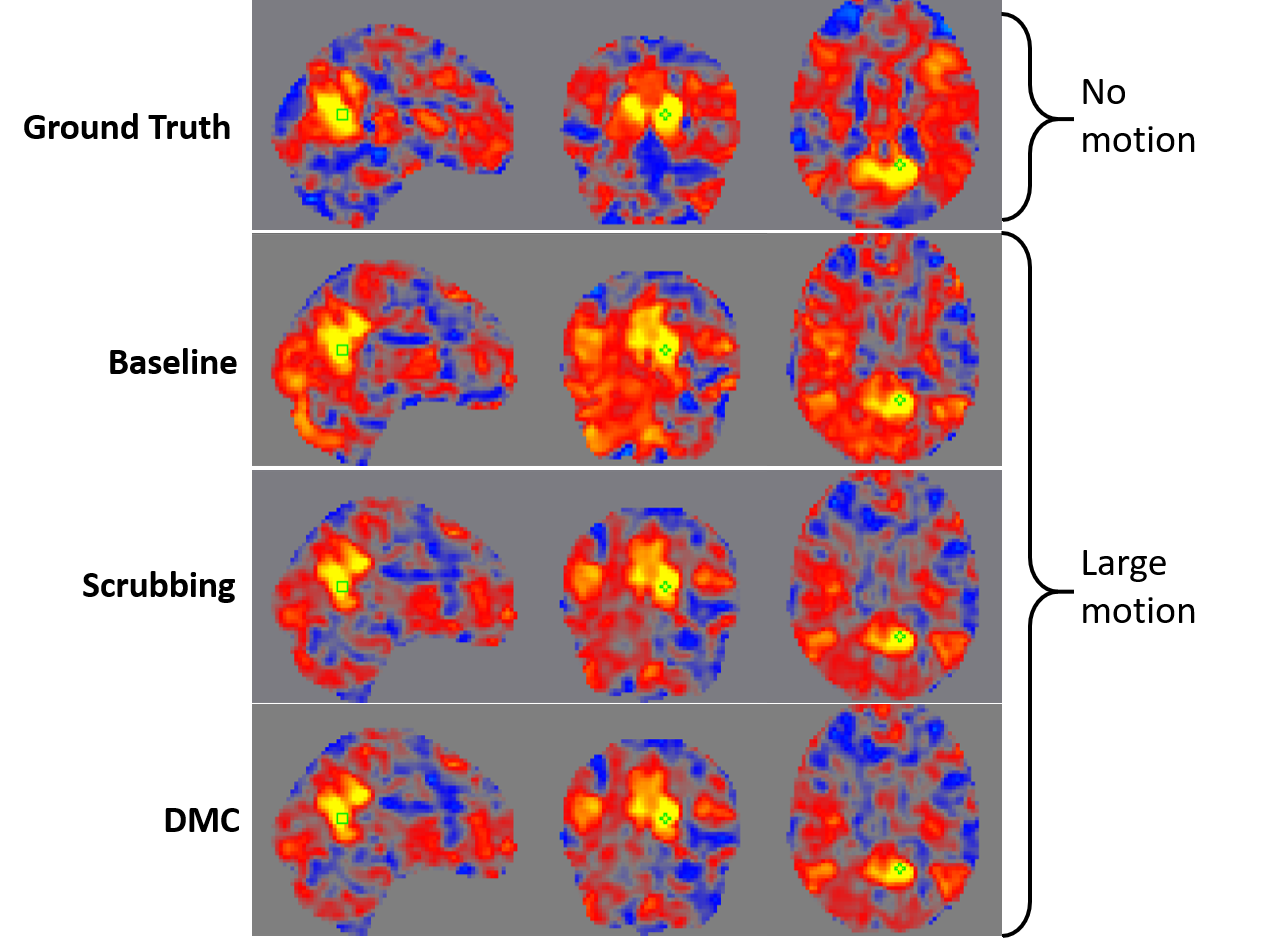
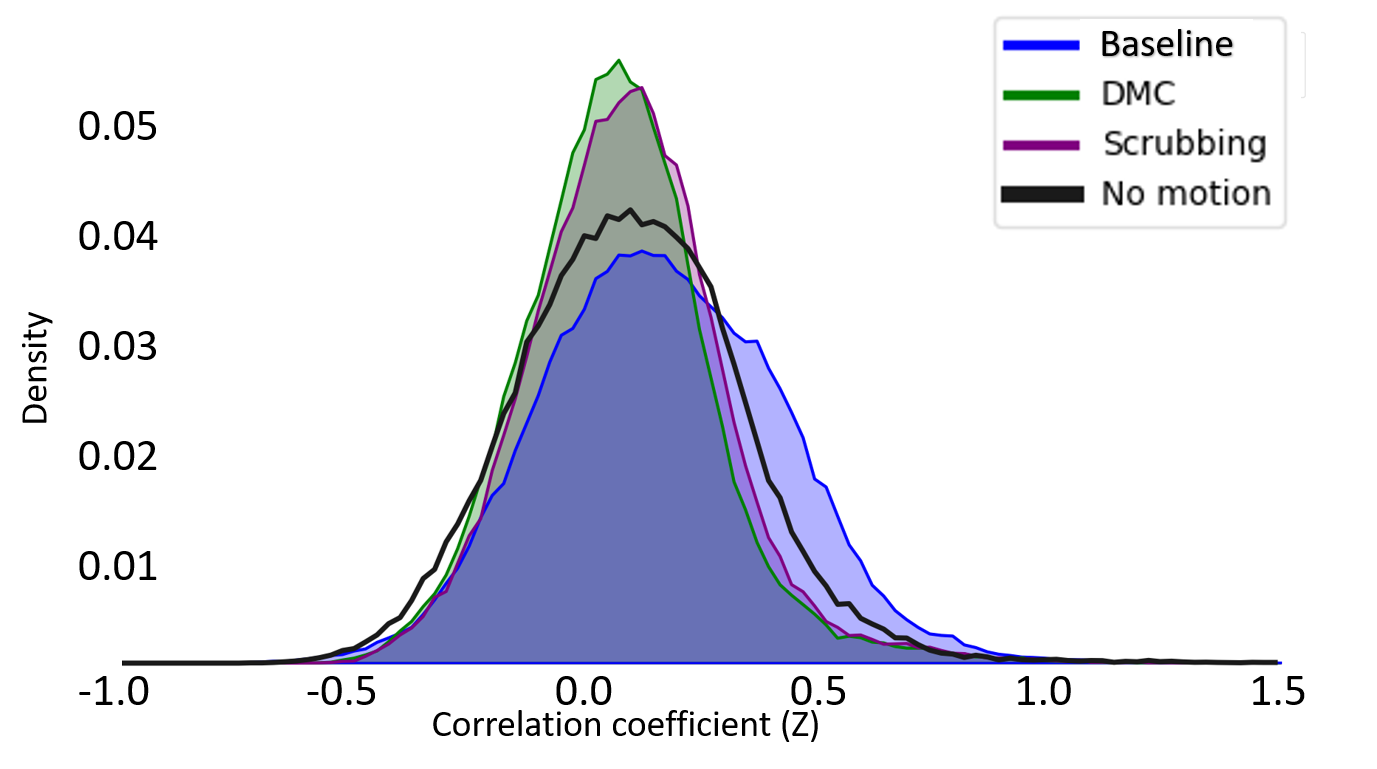
Figure 2 demonstrates the FD across a BOLD run (upper panel) and the associated demeaned and normalized ROI timeseries after temporal filtering for both Baseline and DMC pipelines, shown both prior to scrubbing (middle panel) and after scrubbing (lower panel). It can be seen that these timecourses diverge considerably at time points adjacent to high motion data volumes, highlighting the leakage of motion contamination caused by temporal filtering that DMC addresses. Figure 3 shows the scatter plot of mean and standard deviation of brain signal in all data volumes of six rsfMRI scans. The standard deviation in high-motion volumes is significantly higher than that of no-motion volumes (p<10-10). In addition, the standard deviation for volumes in the 5-neighborhood of scrubbed data in Scrubbing case is significantly higher than that of no-motion volumes (p=1.5x10⁻⁷). On the other hand, there was no statistically significant difference between standard deviation of brain signal in volumes in the 5-neighborhood of scrubbed data in DMC case and that of no-motion volumes. Seed-based correlation maps of the PCC ROI from a “large motion” run using each pipeline and from a “no motion” run are shown in Figure 4. Figure 5 shows the histograms of these four correlation maps. There is a subtle decrease in non-specific positive correlation in the DMC case compared to the Scrubbing pipeline, however the more dramatic comparison is between the Baseline vs either the Scrubbing or DMC. While subtle, the differences between the DMC and Scrubbing correlation maps are likely to become more dramatic with increased motion and/or reduction in total amount of data; i.e., the typical situation for clinical application.DISCUSSION:
DMC provides an additional level of motion mitigation when combined with Scrubbing by removing motion corrupted data volumes before temporal filtering and replacing them with customized synthetic data. This reduces the spread of motion corrupted signal, “leakage”, to neighboring volumes during temporal filtering. Our findings suggest that this leakage effect is sufficient to artifactually increase positive correlations in a broad fashion. As such, incorporation of DMC or similar approaches provides added benefit without requiring reacquisition or extraneous motion measurement in obtaining functional connectivity measures from populations where motion is a persistent confound and may play an even more prominent role in reduced duration datasets.CONCLUSION:
DMC removes additional effect of motion contamination caused by temporal filtering, an issue that cannot be addressed by Scrubbing alone without excessive censoring.Acknowledgements
This research was supported in part by the following grants: NIH-5R01EB019483, NIH-4R01NS079788 and NIH-R44MH086984.References
1Power, J.D., Barnes, K.A., Snyder, A.Z., Schlaggar, B.L. and Petersen, S.E., 2012. Spurious but systematic correlations in functional connectivity MRI networks arise from subject motion. Neuroimage, 59(3), pp.2142-2154.
2Yokota, T., Erem, B., Guler, S., Warfield, S.K. and Hontani, H., 2018, April. Missing Slice Recovery for Tensors Using a Low-rank Model in Embedded Space. In Proceedings of the IEEE Conference on Computer Vision and Pattern Recognition (pp. 8251-8259).
3Esteban, O., Markiewicz, C., Blair, R.W., Moodie, C., Isik, A.I., Aliaga, A.E., Kent, J., Goncalves, M., DuPre, E., Snyder, M. and Oya, H., 2018. FMRIPrep: a robust preprocessing pipeline for functional MRI. bioRxiv, p.306951.
4Pruim, R.H., Mennes, M., van Rooij, D., Llera, A., Buitelaar, J.K. and Beckmann, C.F., 2015. ICA-AROMA: A robust ICA-based strategy for removing motion artifacts from fMRI data. Neuroimage, 112, pp.267-277.
5Dosenbach, N.U., Nardos, B., Cohen, A.L., Fair, D.A., Power, J.D., Church, J.A., Nelson, S.M., Wig, G.S., Vogel, A.C., Lessov-Schlaggar, C.N. and Barnes, K.A., 2010. Prediction of individual brain maturity using fMRI. Science, 329(5997), pp.1358-1361.
Figures