3889
3D Inner Volume bSSFP Functional MRI: Preliminary results
Tianrui Luo1, Douglas Noll1, and Jon-Fredrik Nielsen1
1fMRI Lab, Univ. of Michigan., Ann Arbor, MI, United States
1fMRI Lab, Univ. of Michigan., Ann Arbor, MI, United States
Synopsis
3D inner-volume (IV) imaging enables increased spatiotemporal resolution within a reduced field-of-view (FOV), but is not directly compatible with steady-state sequences such as balanced SSFP. We present an IV bSSFP sequence for transition-band functional MRI, a technique that can produce high functional signal within a relatively narrow off-resonance frequency (B0) range. We use spatially tailored 3D radiofrequency (RF) pulses for IV excitation and outer-volume (OV) saturation, and a pair of gradient spoilers that make the overall sequence balanced (unbalanced) for IV (OV) spins. This approach produces good OV suppression in most regions, and high functional signal near a transition band.
Introduction
Inner-volume (IV) MRI enables increased spatiotemporal resolution within a reduced field-of-view (FOV) or region-of-interest (ROI). Since it is easier to mitigate B0 inhomogeneity (shimming) over a reduced FOV than over the corresponding full FOV, IV imaging may be compatible with non-standard MR sequences that are more sensitive to local off-resonance frequency than most standard sequences. One such sequence is 3D functional MRI (fMRI) using transition-band balanced steady-state free precession (tb-bSSFP), which can produce high functional signal for voxels within a relatively narrow band of off-resonance frequencies (near a transition band) [2,3]. Unfortunately, 3D IV bSSFP imaging has not yet been possible due to the difficulty of limiting the IV to a 3D region and suppressing unwanted steady-state outer-volume (OV) signal.Here we introduce a 3D IV bSSFP sequence based on the use of 3D spatially tailored radiofrequency (RF) pulses for both IV excitation and OV suppression. We choose 3D tailored pulses since they are needed for non-Cartesian imaging; for Cartesian/EPI sequences, 2D tailored pulses would suffice. We demonstrate that this strategy can produce good OV suppression, and large functional signal (~6%) in visual cortex.
Methods
Sequence design: Figure 1 shows the timing diagram of our IV bSSFP sequence. After IV excitation (designed using the method in [1]), and spiral readout with ky/kz phase-encoding, we append an OV saturation pulse consisting of 3D tailored OV excitation and a gradient spoiler. We insert an opposite-sign spoiler just before the OV pulse to balance the sequence for inner volume spins. The TE used for our functional experiment is 4.5 ms longer than TR/2, which adds some T2* contrast.We used the small-tip design algorithm described by Sun et al [1] for designing the tailored IV and OV pulses. This method initializes the excitation k-space trajectory using the “extended kT-points” method, parametrizes the trajectory with 2nd order B-splines, and then optimizes the B-spline coefficients using the interior-point-method subject to gradient and slew rate hardware limits.
To center the IV on the bSSFP transition band, we computed the average off-resonance frequency inside the IV and added a corresponding linear phase increment to our excitation pulses.
Imaging experiments: We conducted in vivo 3D bSSFP IV imaging experiments in a healthy volunteer. We acquired both a “structural” bSSFP image using slab excitation, and an IV fMRI time-series. Acquisition parameters: TR=38 ms (similar to the value used in [2]); IV flip angle 36°; OV flip angle 70°; Structural imaging FOV 24×24×24 cm³, image matrix size 240×240×240; Functional imaging TE=21 ms, FOV 12x12x5 cm³, image matrix size 48×48×20; fMRI volume-TR 0.76 s. Imaging experiments were performed on a GE Discovery MR750 3T scanner using an 8-channel receive head coil.
Both experiments used stack-of-spiral readouts: a) The structural acquisition was fully-sampled and has 240 platters, each composed of 12 constant density spiral interleaves. b) The functional acquisition has 20 prospectively under-sampled (R=3) platters (rotated stack-of-spirals), and 1 out of 3 variable density spiral interleaves is sampled in each. Sampling did not change across frames.
For the fMRI experiment, we presented 20 s on-and-off flashing full-field visual stimuli for 5 min. We used non-Cartesian GRAPPA [4] for under-sampled reconstruction before computing fMRI activation correlation maps.
Results
Figures 2 and 3 show images obtained with whole-brain excitation and IV excitation, respectively, and demonstrate the spatial selectivity of our sequence. These slices are regularly spaced. The excited region is mainly confined to the visual cortex, as intended. We observe two transition bands within the visual cortex from the sagittal images, indicating the need for improved localized shimming in our experimental setup.Figure 4 presents the bSSFP functional activation map. Time-course correlations with the stimulus are thresholded at 0.57. We observe high correlations within the visual cortex as expected.
Figure 5 plots the averaged time-course within the voxels above a threshold of +0.25. We observe ~6% signal changes, which is lower than [2] (9~10%) but higher than typical BOLD (3%). This might be caused by a mixture of transition band and pass band contrast.
Discussion and Conclusion
We have demonstrated that it is possible to perform IV bSSFP fMRI with good OV suppression, using tailored IV excitation and OV saturation pulses of approximately 4ms duration each which is short enough for use with the fMRI sequence used here. Including a pair of balanced gradient spoilers ensures that the sequence is balanced for IV spins, and unbalanced for OV spins. We observed high functional signal in regions near the transition-band, which points to the possibility of using this technique for high-resolution “zoomed” fMRI. Our experiments also point to the need for localized shimming over the IV, such that the whole IV can be placed near a transition-band.Acknowledgements
This work was supported by NIH grants R21EB019653, R21AG061839, R01EB023618.References
- Sun, Hao, et al. "Joint design of excitation k-space trajectory and RF pulse for small-tip 3D tailored excitation in MRI." IEEE Transactions on Medical Imaging 2016; 35(2): 468-479.
- Scheffler, Klaus, et al. "Detection of BOLD changes by means of a frequency‐sensitive trueFISP technique: preliminary results." NMR in Biomedicine: An International Journal Devoted to the Development and Application of Magnetic Resonance In Vivo 14.7‐8 (2001): 490-496.
- Miller, Karla L., et al. "Functional brain imaging using a blood oxygenation sensitive steady state." Magnetic Resonance in Medicine: An Official Journal of the International Society for Magnetic Resonance in Medicine 50.4 (2003): 675-683.
- Luo, Tianrui, et al. "A GRAPPA algorithm for arbitrary 2D/3D non‐Cartesian sampling trajectories with rapid calibration." Magnetic resonance in medicine 82.3 (2019): 1101-1112.
Figures
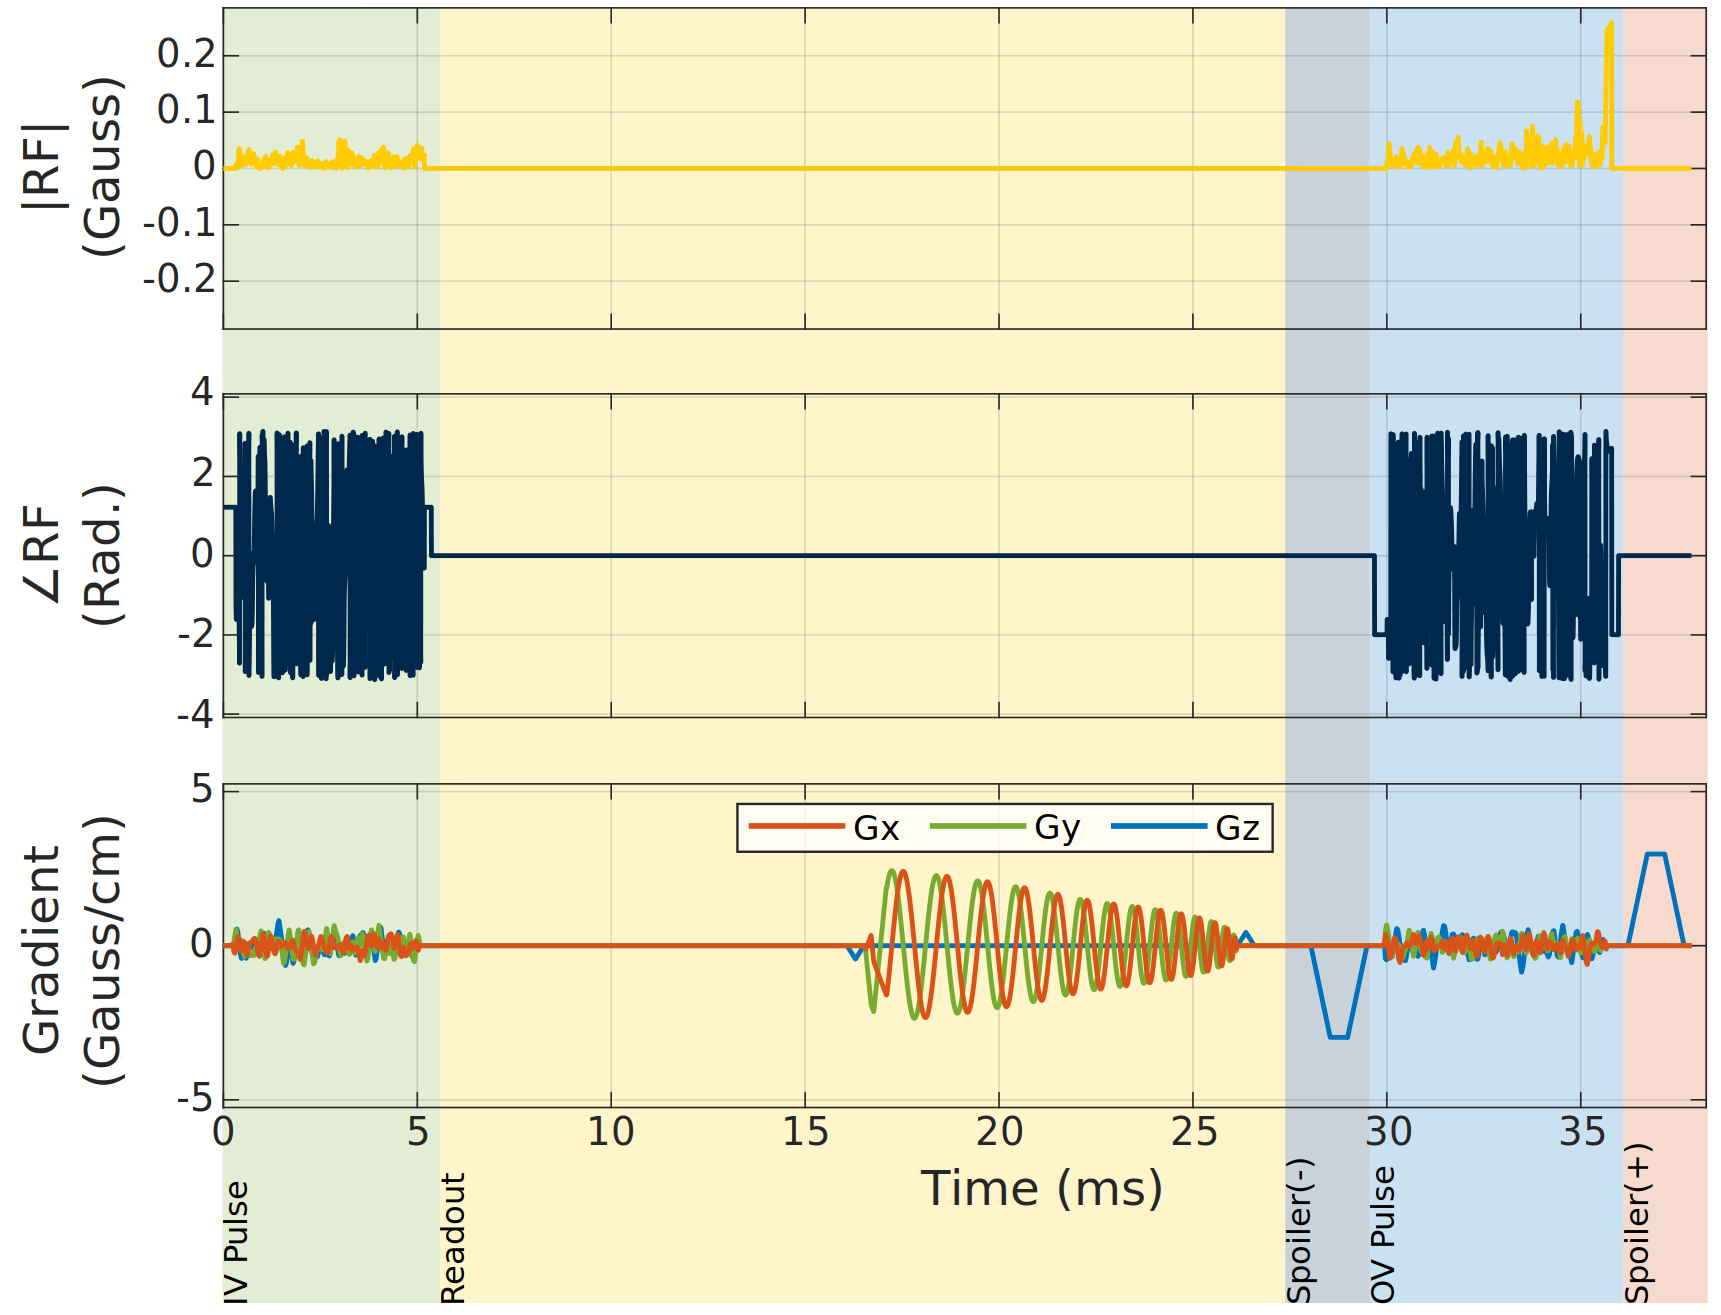
Sequence timing diagram for bSSFP. An OV saturation pulse is appended to the end of each TR, between a pair of balanced gradient spoilers. The IV and OV pulses are 3D tailored to excite only the IV and OV, respectively. The signal from OV is immediately spoiled by the Spoiler (+). An opposite Spoiler (-) is added to balance the sequence for IV spins.
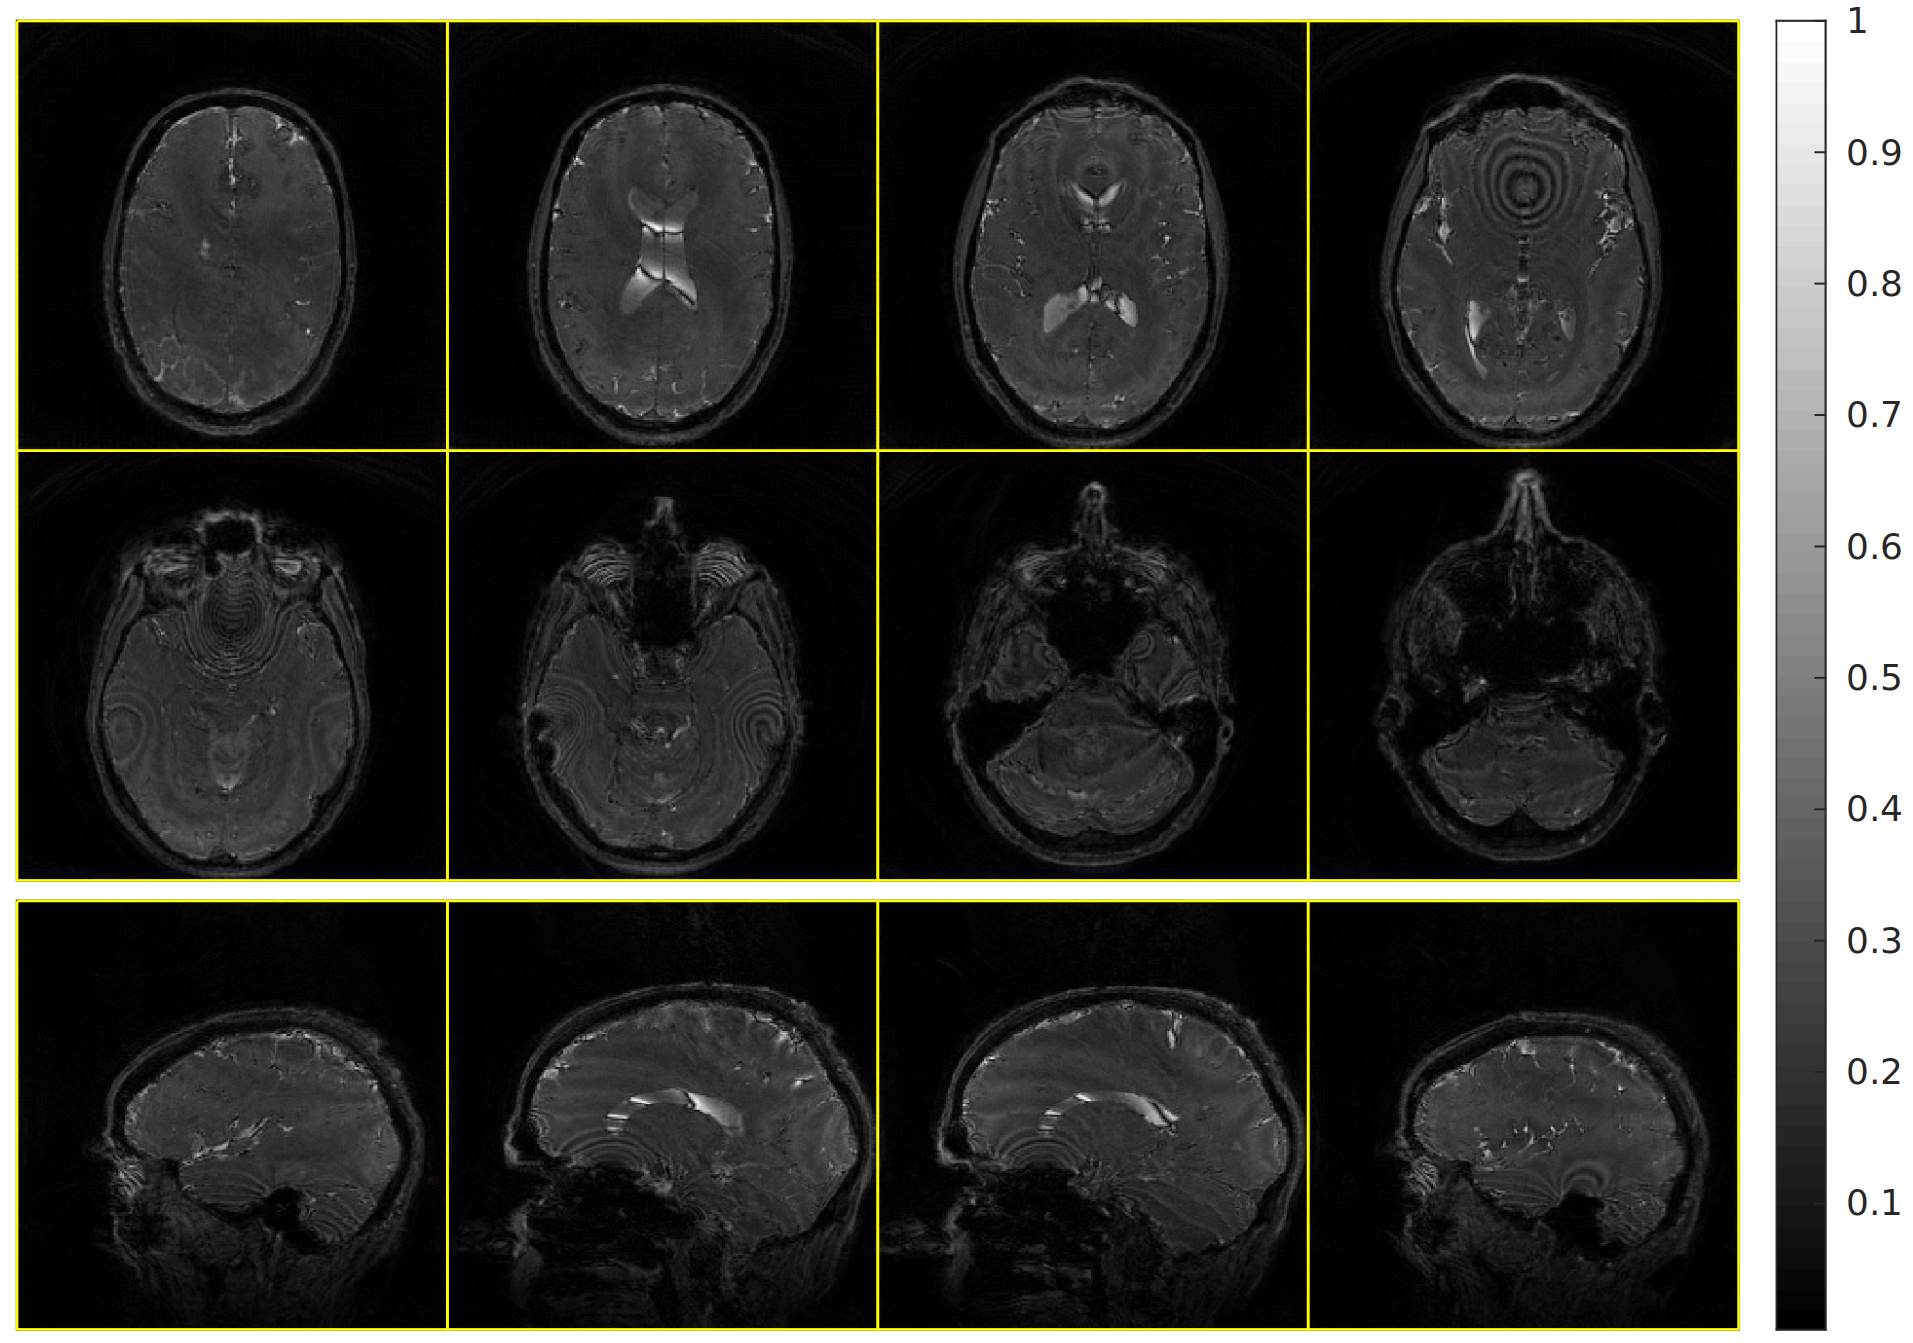
Structural bSSFP image using a slab excitation pulse, 1 mm isotropic resolution. TR=38 ms, TE=1 ms, FOV 24×24×24 cm³. 8 out of 240 axial slices, and 4 out of 240 sagittal slices, are shown.
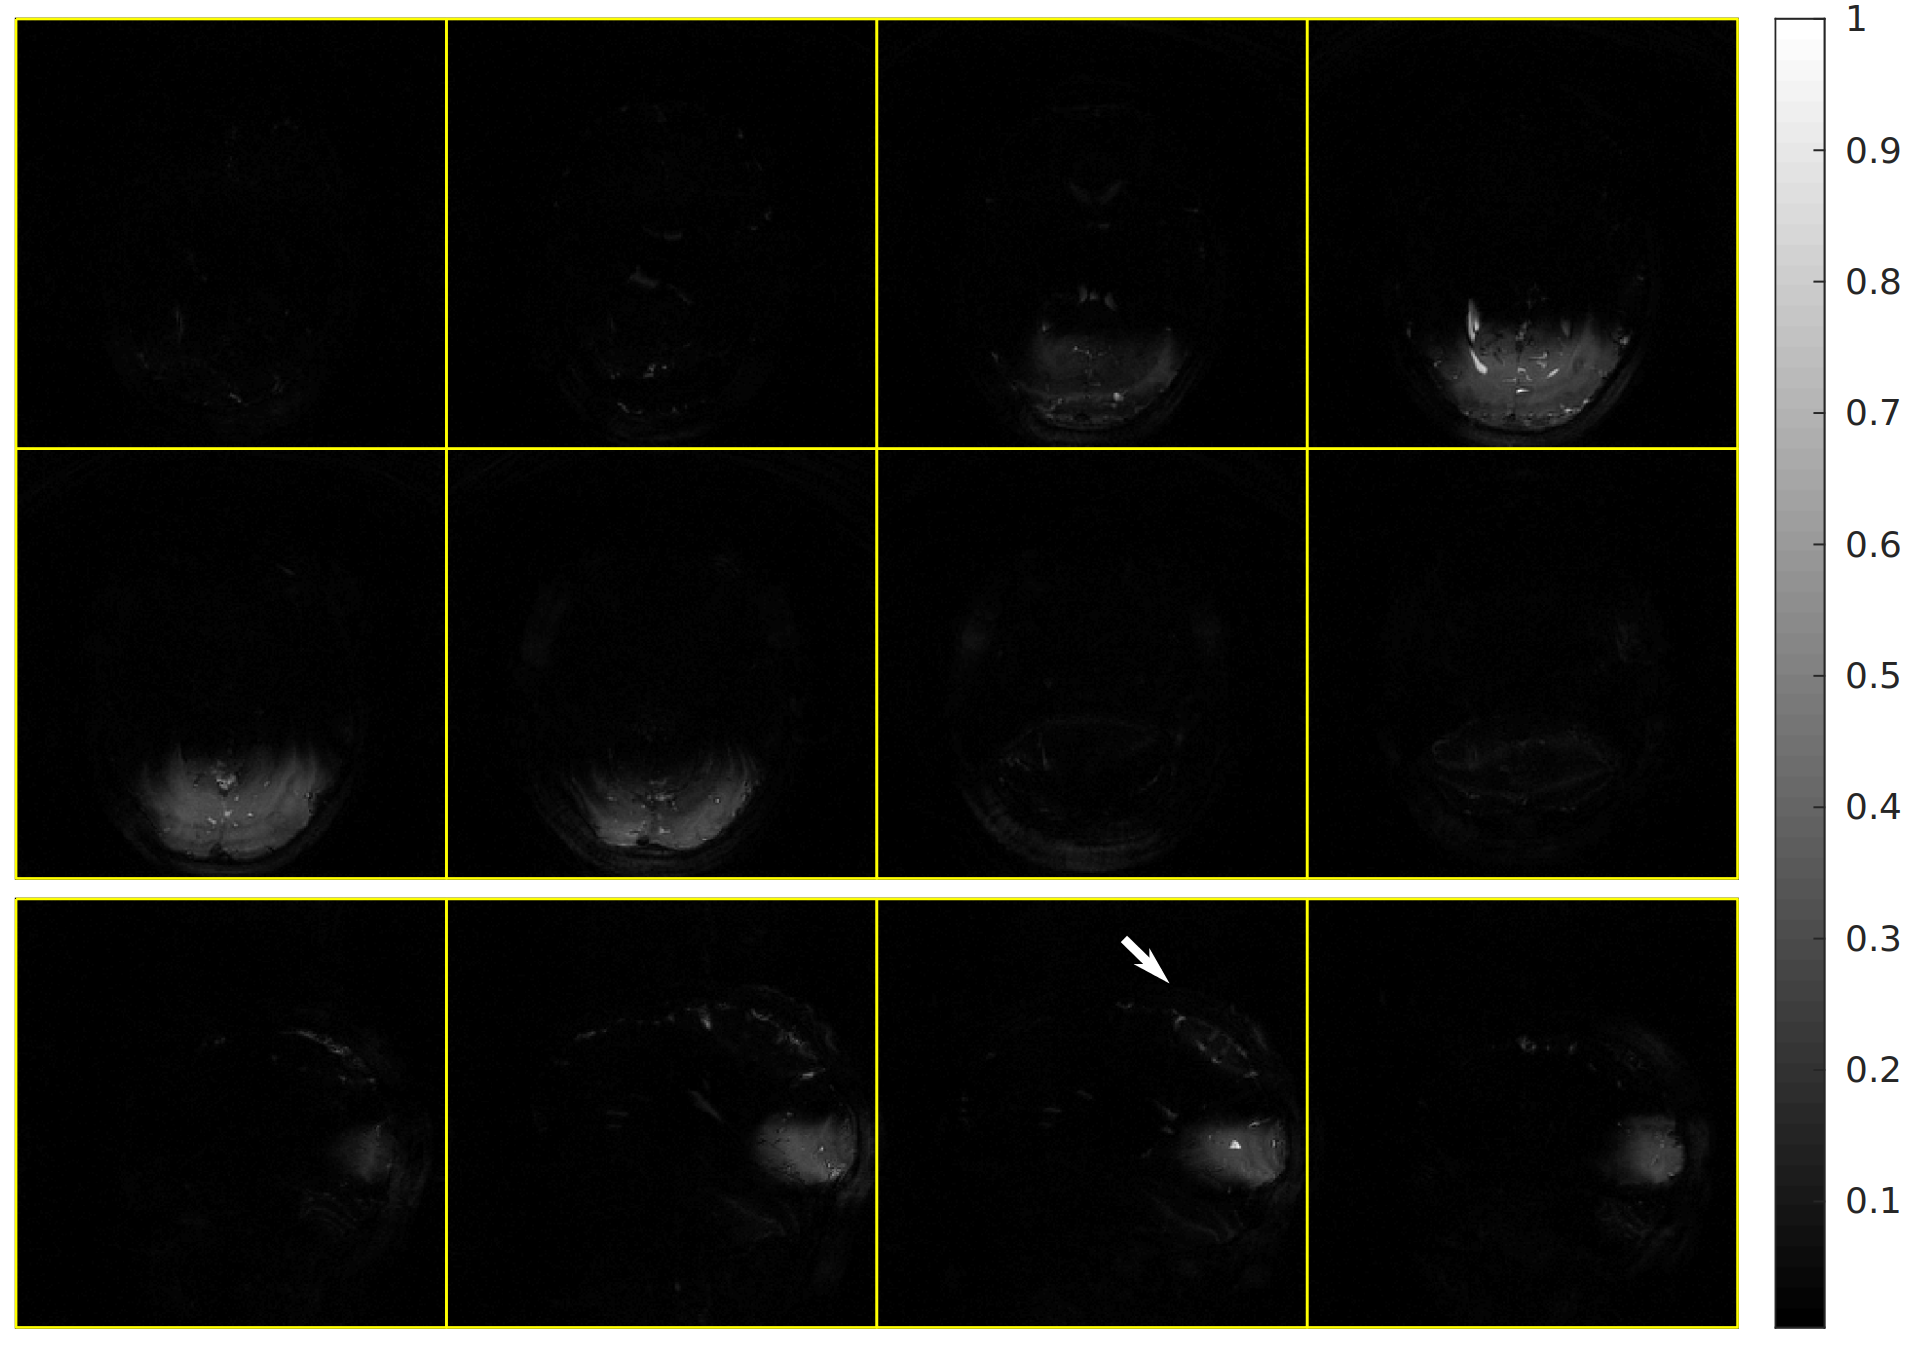
Structural IV bSSFP image, 1mm isotropic resolution. Sequence parameters (matrix, FOV) and presented slices are identical to those of Fig. 2. There are un-suppressed OV signals (arrow) near the top of the brain (in the sagittal images); we expect that a larger OV flip-angle can mitigate this problem.
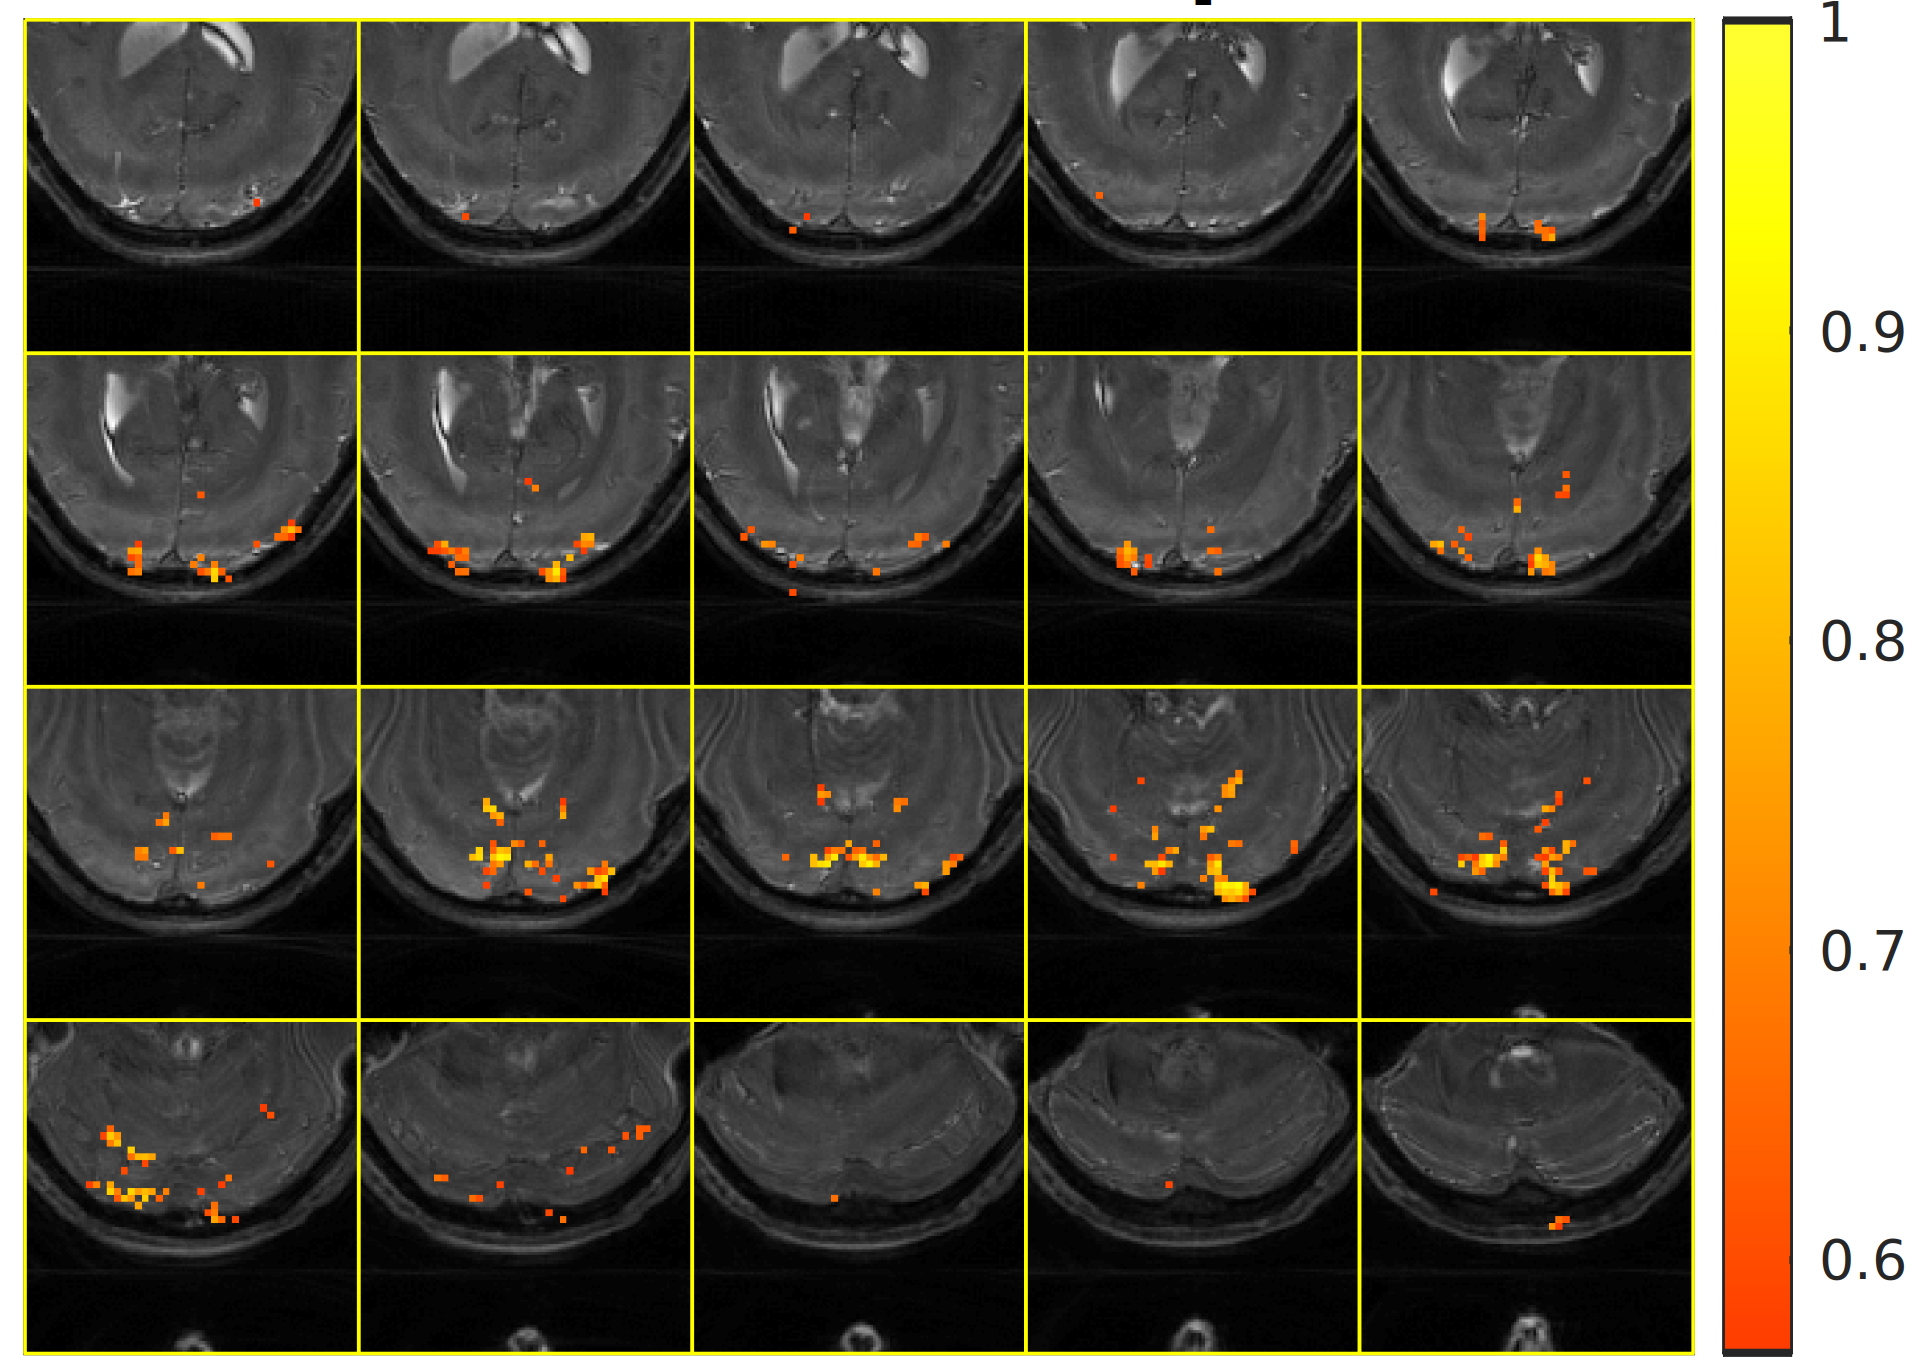
Preliminary IV bSSFP fMRI results. Temporally-filtered absolute functional activity map overlaid onto the zoomed-in high-resolution structural image. We primarily observe activations in the visual cortex as expected. Activations tend to be stronger near the transition bands (dark bands in the underlying structural image).
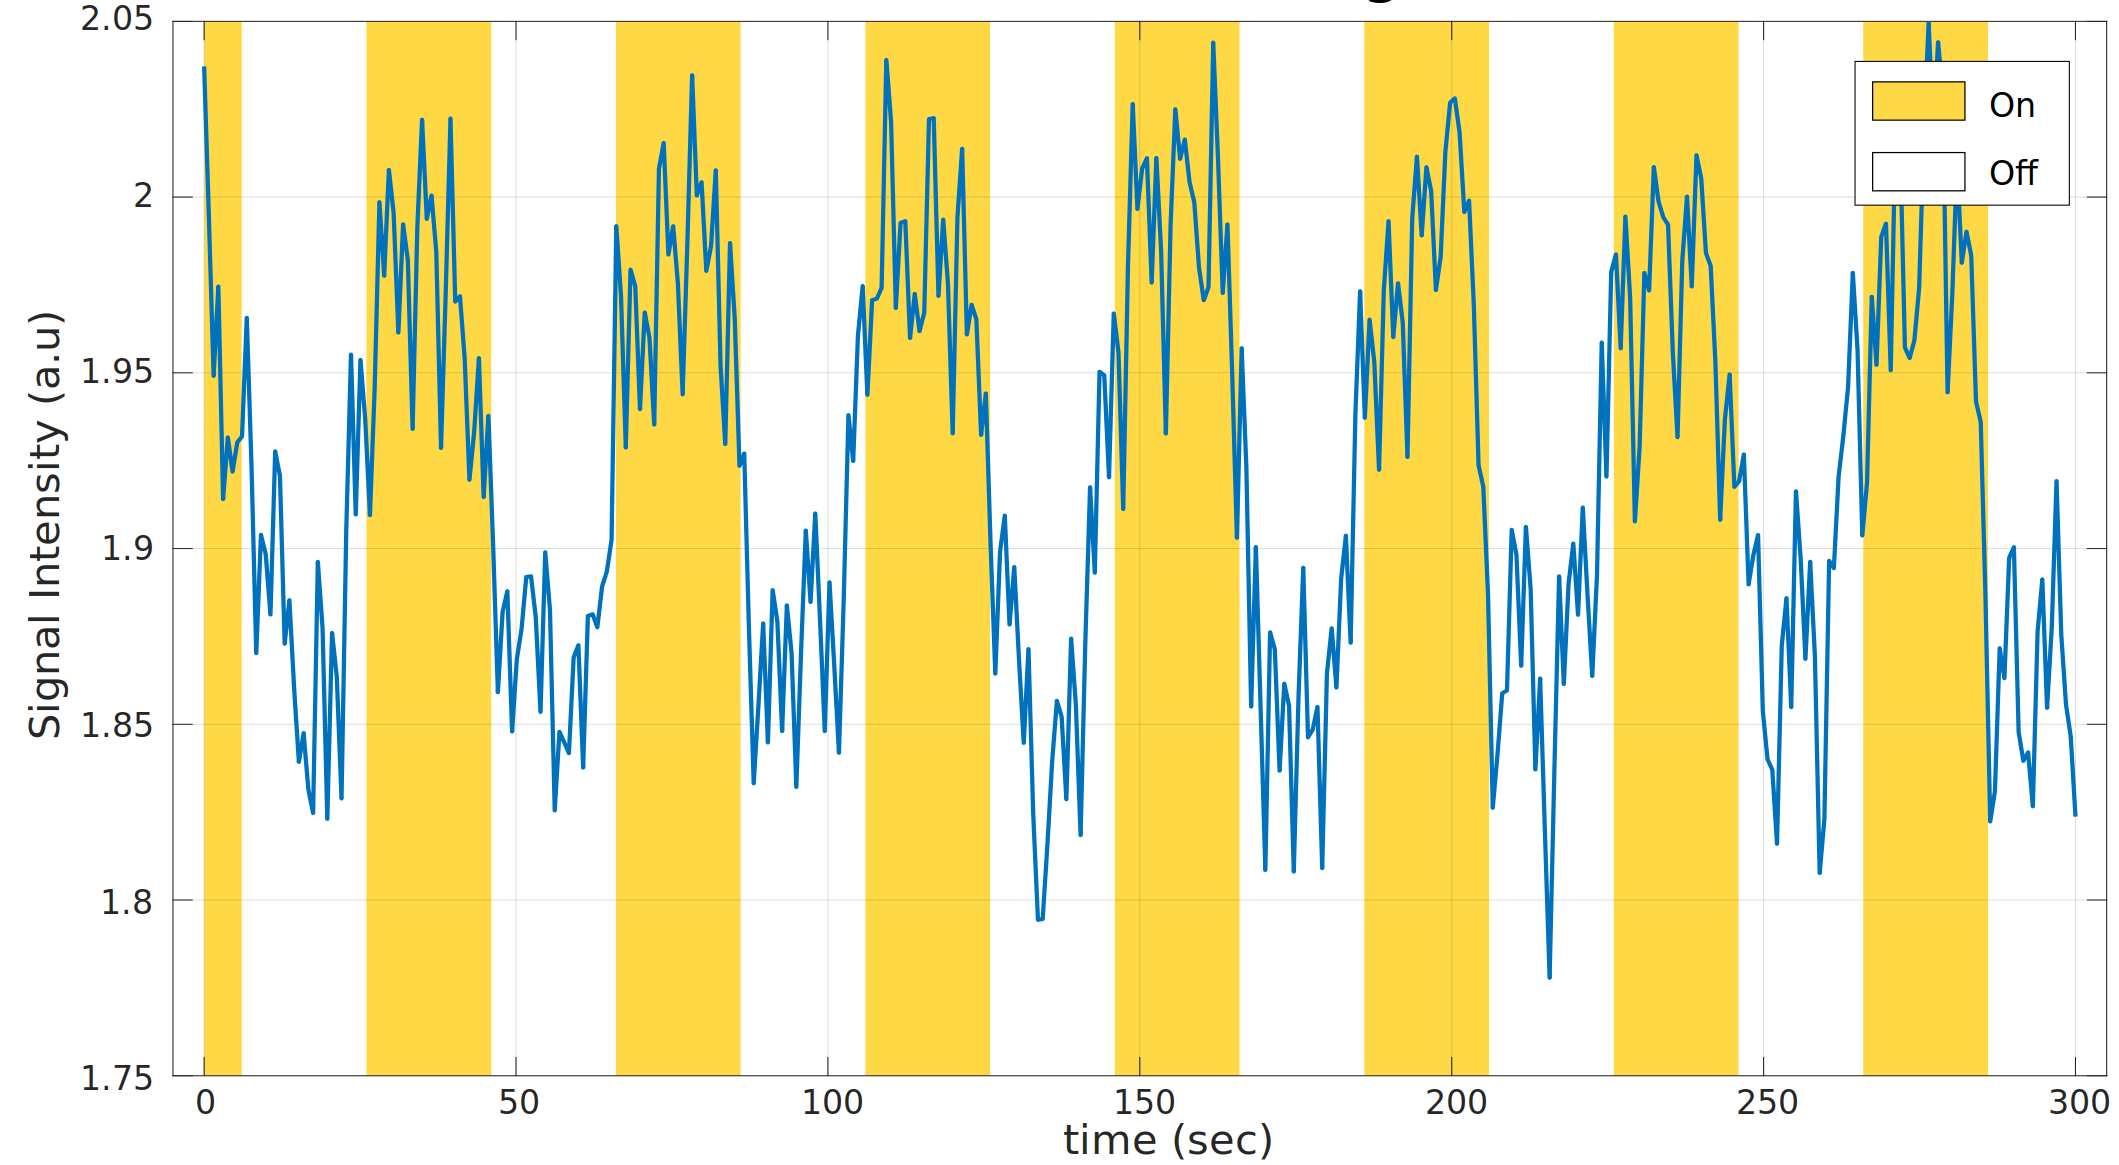
Time course averaged across voxels with functional activation (correlation) above 0.25. Yellow region indicates visual stimuli are on. We observe ~6% signal changes between stimulus on and off, which is lower than [2] (9~10%) but higher than typical BOLD (3%). This might be caused by a mixture of transition band and pass band contrast.