3886
The SNR, tSNR, physiological noise and spatial correlation characteristics of 2D-MB-EPI and 3D-EPI.1Wellcome Centre for Human Neuroimaging, UCL Institute of Neurology, London, United Kingdom, London, United Kingdom
Synopsis
Here we use an extended model describing the impact of smoothing on tSNR to characterize 2D-Multiband-EPI and 3D-EPI time-series, in vivo, in terms of their SNR, tSNR, intrinsic smoothness, as well as the level of physiological noise (λ) and its degree of spatial correlation. The model fitting suggested that higher intrinsic smoothness and physiological noise levels in 3D-EPI can explain why spatial smoothing is less beneficial than for 2D-MB-EPI, as previously observed. Furthermore, the model captured the facts that the level of physiological noise is higher for 3D-EPI than 2D-MB-EPI and that λ increases with the number of acquired segments.
Introduction
Accelerating fMRI acquisitions is necessary to achieve high spatial resolution in reasonable volume acquisition times. Two prominent strategies are: 2D-Multiband(MB)-EPI and 3D-EPI. Although 3D-EPI can theoretically provide higher SNR than 2D-MB-EPI it also suffers from high sensitivity to physiological noise1,2. The subsequent effect of spatial smoothing depends on the signal-to-noise (SNR) of the original image (SNRo), the intrinsic smoothness of the data σI, the amount of physiological noise λ and its degree of spatial correlation3. We recently observed that the tSNR of 3D-EPI benefited less from spatial smoothing than 2D-MB-EPI4. To better understand this behaviour we extend the model proposed in3 to additionally describe the tSNR of the smoothed time-series (tSNRsmooth) in terms of the intrinsic smoothness of the data and the degree to which the physiological noise is spatially correlated (α). Protocols with different acceleration factors and spatial coverage are investigated.Methods: Model extension
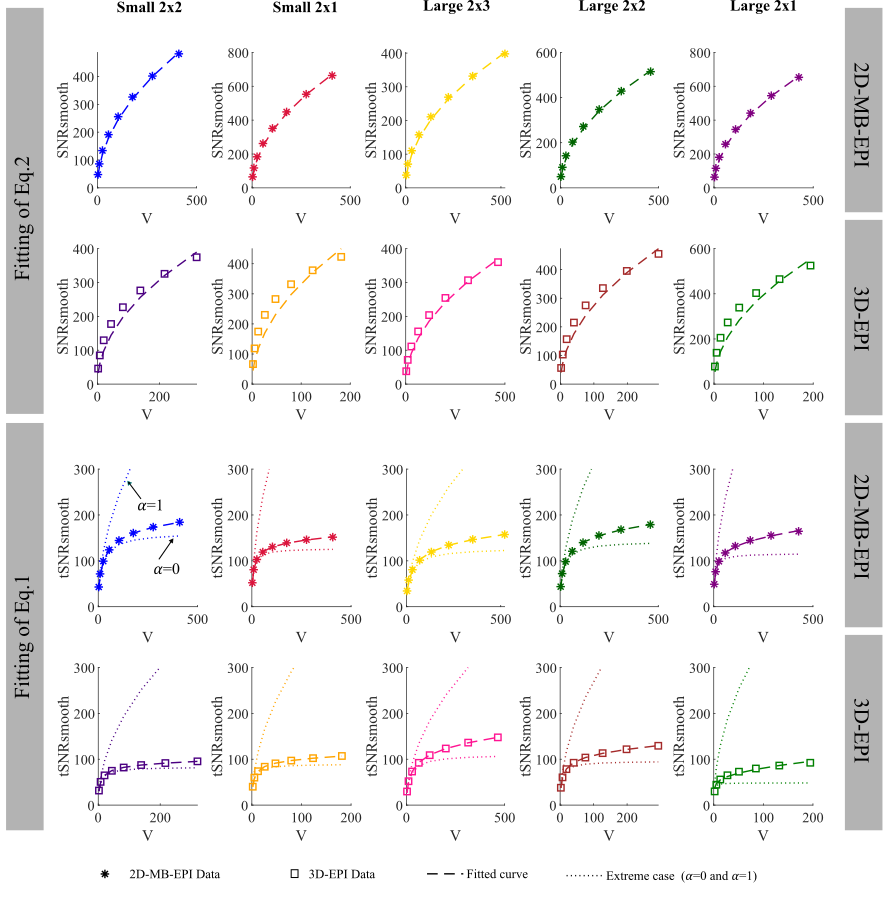
We extended the model in3 introducing a new parameter α reflecting the degree of spatial correlation in the physiological noise, with standard deviation (SD) $$$\sigma_p=\lambda S$$$ (S being signal amplitude):$$tSNR_{smooth}=\frac{V.SNR_0}{\sqrt{V+V^2 λ^2 SNR_0^2 \left(1+\alpha\left(\sqrt{V8π^{3/2} σ_I^3}-1 \right)\right)^{-2} } } \space \space (Eq.1) $$
where $$$V=\left(\frac{SNR_{smooth}}{SNR_o } \right)^2=\frac{\sqrt{\sigma_I^2+\sigma_F^2}^3}{σ_I^3}\space \space (Eq.2) $$$, σF is the SD of the 3D isotropic Gaussian smoothing filter, σI is intrinsic smoothness approximated by a 3D Gaussian filter. SNRo is the SNR of the original data.
If α=0, the physiological noise is completely correlated and smoothing does not reduce the variance of this noise component. If α=1, the physiological noise is spatially uncorrelated and the smoothing reduces this variance in a manner equivalent to smoothing the thermal noise. In these cases, the proposed model collapses to the cases presented in3.
Methods: Acquisitions
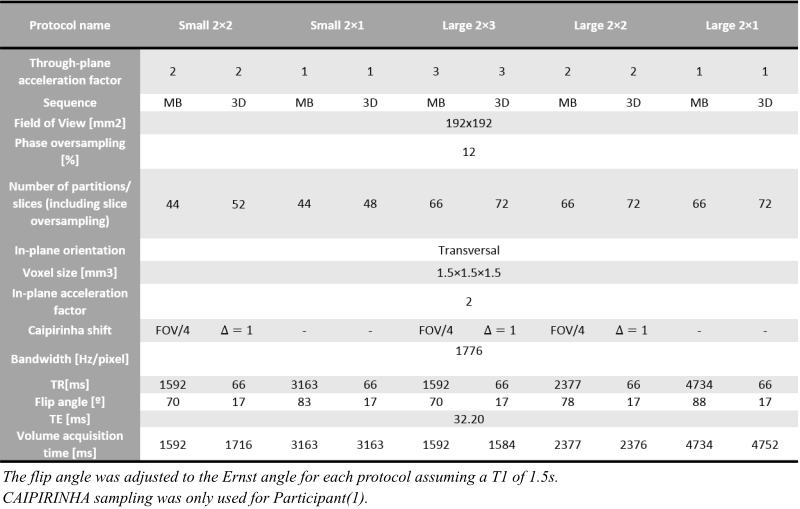
Data were acquired on two participants at 3T with a multiband-enabled EPI sequence (R016,VE11C,https://www.cmrr.umn.edu/multiband/) and an in-house 3D-EPI sequence5. 2D-MB-EPI images were reconstructed with the GRAPPA-based algorithm provided with the sequence, while 3D-EPI images were reconstructed with an in-house SENSE-based algorithm implemented within Gadgetron6. Data from Participant(2) was additionally reconstructed with the vendor’s GRAPPA-based algorithm. Fig.1 shows key parameters of the 5 protocols tested for each sequence.Participant(1): The SNR of each time-series was computed with the Monte-Carlo method7 by generating a time-series replicating one mean volume with added noise having the same statistics as the thermal noise estimated from noise-only measurements. The replicas and the acquired data were reconstructed identically and smoothed with Gaussian filters with FWHM ranging from 1 to 8 mm. SNRo and SNRsmooth were computed as the ratio of the mean and standard deviation across replicas before and after smoothing respectively. tSNRsmooth was computed in the same way from the acquired time-series after realignment, detrending and smoothing. tSNRsmooth, SNRsmooth and SNRo were averaged across grey matter (p(GM)>0.99) after correcting for the non-Gaussian nature8. The ratio $$$\left(\frac{SNR_{smooth}}{SNR_o } \right)^2$$$ was fitted to Eq.2 to estimate σI, which was subsequently used to fit tSNRsmooth to Eq.1 and estimate λ and α.
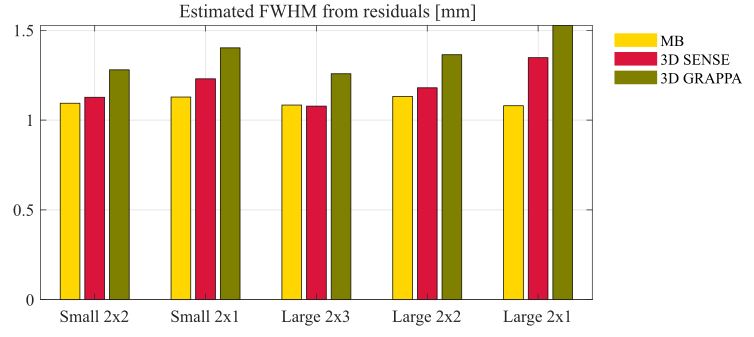
Participant(2): Each time-series was realigned to the first volume and parameters of a GLM, including motion traces and high-pass filter, were estimated with SPM12.3 (www.fil.ion.ucl.ac.uk/spm). The intrinsic smoothness was subsequently estimated from the residuals9. This is often done in fMRI analyses9,10 and provides an independent measure of the intrinsic smoothness of each times series.
Results
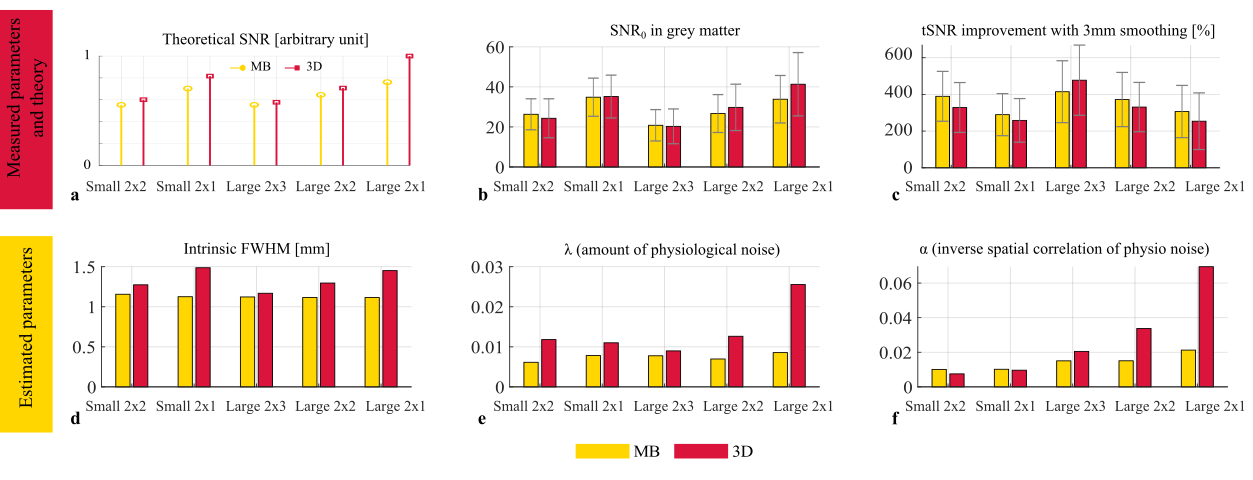
Participant(1): The relative SNRo of 2D-MB-EPI and 3D-EPI was in line with theory (Fig.2a-b). Consistent with our previous results, the tSNR of 3D-EPI benefited less from smoothing than 2D-MB-EPI (Fig.2c).In agreement with the literature1,2 suggesting that 3D-EPI is more sensitive to physiological noise than 2D-MB-EPI especially for low acceleration factor, the estimated λ from the model fitting (Fig.3) was higher for 3D-EPI than 2D-MB-EPI and generally increased with the number of acquired partitions for 3D-EPI (Fig.2e). Importantly a difference in the intrinsic smoothness was observed between the two sequences, with 2D-MB-EPI having lower σI than 3D-EPI (Fig.2d). σI also increased with the number of acquired partitions for 3D-EPI.
Participant(2): The intrinsic smoothness estimated from the GLM residuals (Fig.4) showed the same pattern with (i)higher smoothness for 3D-EPI than 2D-MB-EPI; (ii)higher smoothness for lower acceleration factor in 3D-EPI (Fig.4). GRAPPA and SENSE reconstructions showed equivalent behaviour, though GRAPPA had higher intrinsic smoothness.
Discussion
We confirmed the benefit of smoothing is lower for 3D-EPI than 2D-MB-EPI, especially for low acceleration factor. The extended model of smoothing’s impact enabled a more thorough investigation of the underlying causes. First λ was higher for 3D-EPI, in line with previous literature2 showing that 3D-EPI is more sensitive to physiological noise. This likely contributes to the reduced smoothing benefit given that the physiological noise was also found to be partially spatially correlated ( α<1 in all cases). Furthermore, according to two independent measures, the intrinsic smoothness of the data was higher for 3D-EPI, further limiting the tSNR benefit of smoothing. However, the degree of spatial correlation in the physiological noise was not found to be a limiting factor since lower spatial correlation was observed for 3D-EPI (higher α).Conclusion
An extended model of the impact of smoothing on tSNR has shown that the lower gains in tSNR seen for 3D-EPI stem from higher intrinsic smoothness and greater contributions from physiological noise, despite this noise source having lower spatial correlation.Acknowledgements
The WCHN is supported by core funding from the Wellcome [203147/Z/16/Z].References
1. Zwaag W van der, Marques JP, Kober T, Glover G, Gruetter R, Krueger G. Temporal SNR characteristics in segmented 3D-EPI at 7T. Magnetic Resonance in Medicine 2012;67:344–352 doi: 10.1002/mrm.23007.
2. Reynaud O, Jorge J, Gruetter R, Marques JP, Zwaag W van der. Influence of physiological noise on accelerated 2D and 3D resting state functional MRI data at 7 T. Magnetic Resonance in Medicine 2017;78:888–896 doi: 10.1002/mrm.26823.
3. Triantafyllou C, Hoge RD, Wald LL. Effect of spatial smoothing on physiological noise in high-resolution fMRI. NeuroImage 2006;32:551–557 doi: 10.1016/j.neuroimage.2006.04.182.
4. Corbin N. Effect of spatial smoothing of the data acquired with Multiband and 3D EPI in functional MRI. ISMRM, Montreal, 2019.
5. Narsude M, Gallichan D, van der Zwaag W, Gruetter R, Marques JP. Three-dimensional echo planar imaging with controlled aliasing: A sequence for high temporal resolution functional MRI. Magn Reson Med 2016;75:2350–2361 doi: 10.1002/mrm.25835.
6. Hansen MS, Sørensen TS. Gadgetron: an open source framework for medical image reconstruction. Magn Reson Med 2013;69:1768–1776 doi: 10.1002/mrm.24389.
7. Robson PM, Grant AK, Madhuranthakam AJ, Lattanzi R, Sodickson DK, McKenzie CA. Comprehensive Quantification of Signal-to-Noise Ratio and g-Factor for Image-Based and k-Space-Based Parallel Imaging Reconstructions. Magn Reson Med 2008;60:895–907 doi: 10.1002/mrm.21728.
8. Constantinides CD, Atalar E, McVeigh ER. Signal-to-noise measurements in magnitude images from NMR phased arrays. Magnetic Resonance in Medicine 1997;38:852–857 doi: 10.1002/mrm.1910380524.
9. Forman SD, Cohen JD, Fitzgerald M, Eddy WF, Mintun MA, Noll DC. Improved assessment of significant activation in functional magnetic resonance imaging (fMRI): use of a cluster-size threshold. Magn Reson Med 1995;33:636–647.
10. Kiebel SJ, Poline J-B, Friston KJ, Holmes AP, Worsley KJ. Robust Smoothness Estimation in Statistical Parametric Maps Using Standardized Residuals from the General Linear Model. NeuroImage 1999;10:756–766 doi: 10.1006/nimg.1999.0508.
Figures