3885
Functional MRI of the Auditory Cortex: Comparison of Different Sequences to investigate Speech and Amplitude Modulated Sounds1Brain Imaging Center (BIC), Goethe University Frankfurt, Frankfurt am Main, Germany, 2Max Planck Institute for Empirical Aesthetics, Frankfurt am Main, Germany
Synopsis
This study compares three fMRI sequences with silent breaks for acoustic stimulation: conventional sparse EPI (CS-EPI), interleaved silent steady-state (ISSS) sampling and the proposed SEPIMS scheme. CS-EPI and SEPIMS yield stronger activations than ISSS for simple artificial amplitude modulated sound stimuli and complex speech-based stimuli. Constant TR in CS-EPI and ISSS creates a regular auditory environment which participants may recognize, thus anticipating the timing of stimuli and scanner noise. In contrast, SEPIMS allows for interleaved TR values of different lengths, creating irregular temporal patterns and avoiding correlations between data acquisition and a regular heart beat or breathing rhythm.
Introduction
In order to investigate the perception of language and music via fMRI, conventional sparse temporal sampling [1-3] is frequently employed to avoid acoustic interference, interleaving EPI acquisitions with constant silent periods to present acoustic stimuli. However, this conventional sparse EPI (CS-EPI) technique requires assumptions about the time-to-peak of the hemodynamic BOLD response. Interleaved silent steady-state (ISSS) sampling [4] avoids this problem, but the interleaved slice-selective excitation pulses induce minimal scanner noise during the acoustic stimuli. Both CS-EPI and ISSS require a constant inter-volume delay to maintain the steady-state magnetization. In contrast, the “pre-Saturated EPI using Multiple delays in Steady-state” (SEPIMS) scheme [5] allows variable TR values by inserting spin saturation at a fixed time point before the acquisitions, thus enhancing options in audio stimulus design. In this study, SEPIMS is compared to CS-EPI and ISSS in terms of BOLD response in the primary auditory cortex in response to acoustic stimulation.Methods
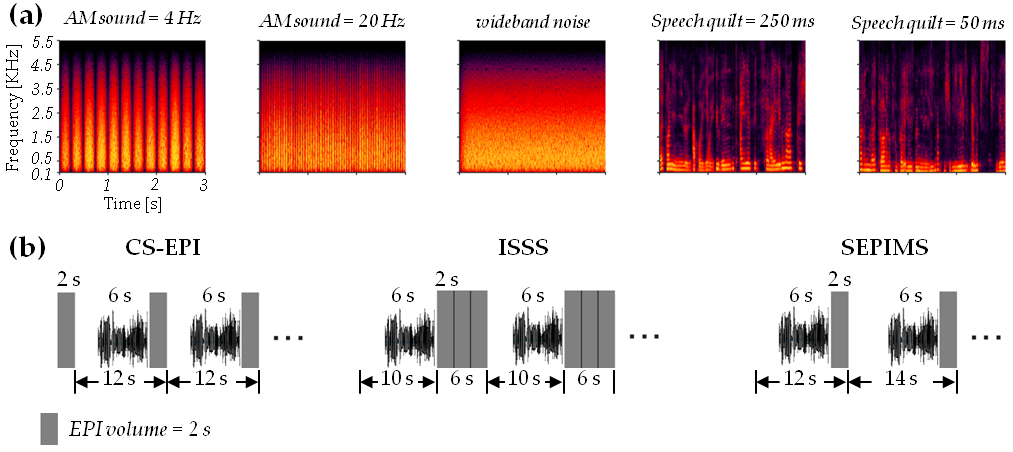
Stimulus design: Two sets of auditory stimuli from our previous studies [6, 7] were generated in MATLAB (The MathWorks, MA, USA). All the stimuli were 6s in duration and the sampling rate was 20000Hz. (1) Amplitude modulated (AM) sounds. The carrier of the AM sounds was comprised of narrowband noise of 128 bands logarithmically spaced from 50Hz to 5000Hz. Each band was modulated by sinewave envelopes of 4Hz and 20Hz, respectively. A cosine ramp-up and ramp-down functions (250ms) were applied on the onset and offset of AM sounds. (2) Speech quilts. We replicated the procedures in [7] and created speech quilts using two temporal windows, 250ms and 50ms, which matched the modulation frequencies of the AM sounds. The spectral range of speech quilts matched the carrier of the AM sounds. (3) Flat wideband noise. A control condition was created by just keeping the narrowband noise carrier of the AM sounds.The fMRI sequences SEPIMS, CS-EPI and ISSS were compared by applying in each case five sets of stimuli: (1) 16 AM sounds (modulation frequency, 4Hz), (2) 16 AM sounds (20Hz), (3) 16 speech quilts (temporal window-size 250ms), (4) 16 speech quilts (50ms), (5) 16 wideband noise. Furthermore, 16 “silent” stimuli were generated without sounds to obtain fMRI signal baselines. In total, 96 stimuli were presented per sequence. Figure 1a shows example stimulus spectrograms.Experiments: Five German speakers (three females, 26-31 years, normal hearing, no neurological disorders) were scanned on a 3T whole-body MRI scanner (body TX-coil, 20-channel phased-array head/neck RX-coil). Each subject gave written consent before participation. Parameters identical for all sequences: TR=2000ms(without delay), TE=30ms, FoV=192×192mm2, spatial resolution=2×2mm2, 26 axial slices (thickness=3mm, gap=1mm), partial-Fourier=6/8, echo-spacing=0.62ms, receiver-bandwidth=1860Hz/pixel. Sequence-specific parameters: SEPIMS: delay1/delay2=12s/10s (first run), delay1/delay2=10s/12s (second run), 46 volumes, total duration (Tmeas)=9:58min. ISSS: 45 blocks with 5 silent and 3 acoustic volumes per block, Tmeas=12 min, two runs. CS-EPI: inter-volume delay=10s, 46 volumes, Tmeas=9:02min. Ramp time of slice-selection gradient: 0.3ms (CS-EPI, SEPIMS), 1ms (ISSS), two repetitions per experiment for SNR improvement. Presentation of stimuli: for CS-EPI and ISSS, from 4s to 10s in constant silent period; for SEPIMS, from 4s to 10s in the short silent period and from 6s to 12s in the long silent period (see Fig.1b). Furthermore, T1-weighted MPRAGE data (1mm isotropic resolution) were acquired for anatomical reference [8].
fMRI preprocessing and analysis: Data were analyzed with BrainVoyager 20.4. Image volumes were aligned to the first volume in the series via a 3D rigid body, six parameter model. Using the anatomical data, the functional volumes were warped into standard MNI space (Colin27) via 3D 5th-order polynomial model. No spatial filtering was applied.
Results
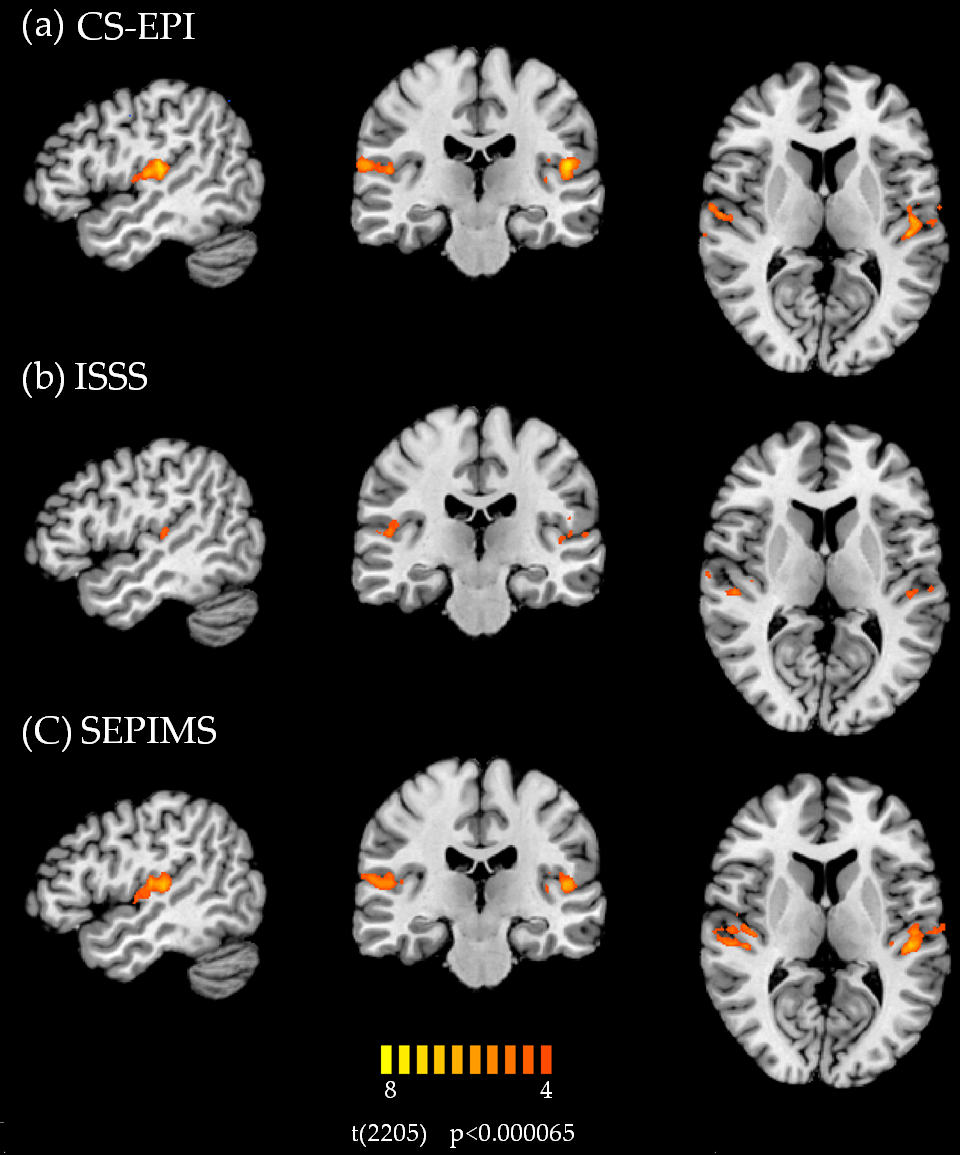
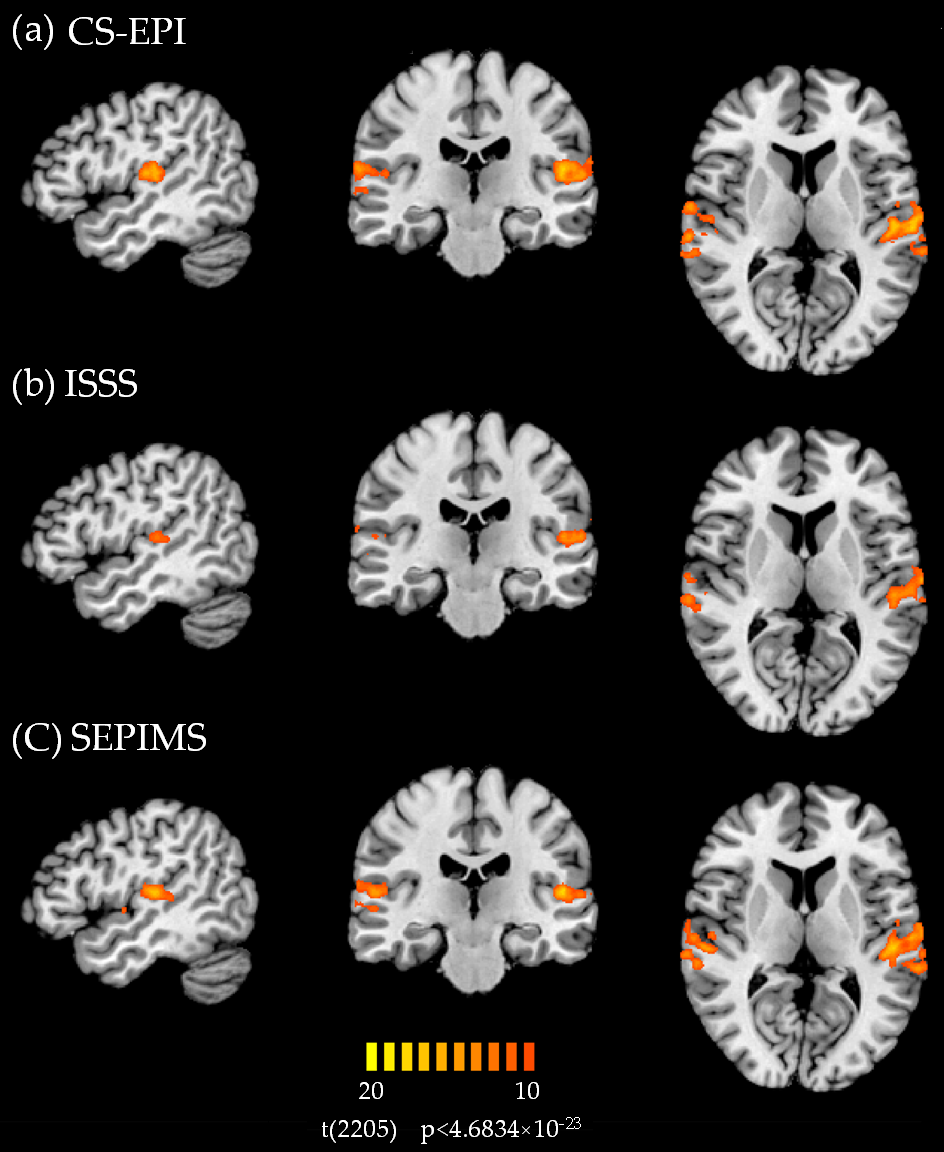
Figure 2 shows for each sequence the resulting activation contrasts between AM sounds and wideband noise. The scaling bar shows t-values, positive values indicate increased activation following the AM sounds. Both CS-EPI and SEPIMS yielded robust activations in the primary auditory areas. In contrast, ISSS yielded less activation, suggesting that ISSS may not be optimal for studying artificial sounds in fMRI studies. Figure 3 shows the resulting activation contrasts between speech quilts and wideband noise. All three sequences yielded robust activation in the primary auditory areas and the superior temporal gyrus, but stronger activation was observed for CS-EPI and SEPIMS, suggesting that all sequences tested can be employed to study speech stimuli in auditory fMRI studies, but CS-EPI and SEPIMS are advantageous.Discussion and Conclusion
We replicated our previous findings [6, 7] and showed that CS-EPI and SEPIMS yielded stronger activations around the auditory areas than ISSS. This is the case especially for the AM sounds – artificial sounds susceptible to disturbance of scanner noise, where ISSS yielded inadequate results. For complex speech stimuli, ISSS yielded reduced activations. This may be due to residual acoustic noise during stimulus presentation in ISSS, induced by slice-selective gradients, which mask artificial sounds of simple structures. Furthermore, the constant TR in CS-EPI and ISSS creates a regular auditory environment, so participants may learn the temporal regularity and anticipate the timing of stimuli and scanner noise, which induces adaptation and decreases auditory activations. In contrast, using interleaved TR values of different lengths in SEPIMS overcome such confounding factors, creating irregular temporal patterns and avoiding correlations between data acquisition and a regular heart beat or breathing rhythm.Acknowledgements
No acknowledgement found.References
[1] Hall DA, Haggard MP, Akeroyd MA, Palmer AR, Summerfield AQ, Elliott MR, Gurney EM, Bowtell RW (1999). “Sparse” temporal sampling in auditory fMRI. Human brain mapping, 7(3), 213-223.
[2] Talavage TM, Edmister WB, Ledden PJ, Weisskoff RM (1999). Quantitative assessment of auditory cortex responses induced by imager acoustic noise. Human brain mapping, 7(2), 79-88.
[3] Edmister WB, Talavage TM, Ledden PJ, Weisskoff RM (1999). Improved auditory cortex imaging using clustered volume acquisitions. Human brain mapping, 7(2), 89-97.
[4] Schwarzbauer C, Davis MH, Rodd JM, Johnsrude I (2006). Interleaved silent steady state (ISSS) imaging: a new sparse imaging method applied to auditory fMRI. Neuroimage, 29(3), 774-782.
[5] Shrestha M, Lee SH, Nöth U, Deichmann R (2017). Functional MRI of the auditory cortex: maintaining the steady-state in EPI for silent inter-volume delays with different durations. In: Proceedings of the 25th annual meeting of ISMRM, Honolulu, USA.
[6] Overath T, Zhang Y, Sanes DH, Poeppel D (2012). Sensitivity to temporal modulation rate and spectral bandwidth in the human auditory system: fMRI evidence. Journal of Neurophysiology. 107: 2042-56.
[7] Overath T, McDermott JH, Zarate JM, Poeppel D (2015). The cortical analysis of speech-specific temporal structure revealed by responses to sound quilts. Nature neuroscience, 18(6):903.
[8] Deichmann R, Good CD, Josephs O, Ashburner J, Turner R (2000). Optimization of 3-D MP-RAGE sequences for structural brain imaging. NeuroImage 12(1), 112-127.
Figures