3882
Comparison of 2D and 3D EPI for high-resolution functional imaging at 7T MRI1Center for Neuroscience Imaging Research, Institute for Basic Science, Suwon, Republic of Korea, 2German Centre for Neurodegenerative Diseases (DZNE), Bonn, Germany, 3Department of Physics and Astronomy, University of Bonn, Bonn, Germany, 4Department of Biomedical Engineering, Sungkyunkwan University, Suwon, Korea, Republic of, 5Techna Institute & Koerner Scientist in MR Imaging, University Health Network, Toronto, ON, Canada
Synopsis
This study presents the performance of 2D and 3D EPI sequences at 7T for functional imaging. Eleven subjects were scanned with individually optimized 2D and 3D EPI sequences with TR and total parallel imaging acceleration that were matched. Three spatial resolutions: 0.8 mm, 1.1 mm, and 1.7 mm isotropic, were used. Resulting temporal signal-to-noise ratios (tSNR) were compared between 2D and 3D EPI sequences, and their potential functional sensitivities are discussed. The results show images acquired with 3D EPI have higher tSNR at 0.8 mm and 1.1 mm resolutions, while 2D EPI images have higher tSNR at 1.7 mm resolution.
Introduction
Ultra-high-field (UHF) MRI scanners enable functional imaging at very high spatial resolutions (<1 mm3), allowing to probe the mesoscopic organization of human brain function. Previous studies have suggested that 3D EPI sequences are capable of outperforming 2D EPI in functional imaging, when operated under thermal rather than physiological noise-dominated regime.1-3 In such cases, temporal signal-to-noise ratio (tSNR) and capturing event-related effects in brain can be enhanced. This study examines spatial and temporal properties of 2D and 3D EPI sequences at 7T scanner with different spatial resolutions (0.8 mm, 1.1 mm, and 1.7 mm isotropic).Methods
Data AcquisitionAll experiments were conducted using a 7T whole-body scanner (Magnetom Terra, Siemens Healthineers, Erlangen, Germany) and a 32-Rx/1-Tx head coil (Nova Medical, Wilmington, MA, USA). Eleven healthy subjects were scanned pursuant to the procedures approved by the institutional review board. Their written consents were collected prior to scanning.
Two sessions of task-based fMRI experiments with visual stimulation were performed for nine subjects. Vendor-provided 2D EPI sequence and a custom 3D EPI sequence developed by Stirnberg, et al. (2017) were used with three spatial resolutions (0.8/1.1/1.7 mm isotropic).4 Whole-brain coverage was obtained at 1.1 mm and 1.7 mm resolutions (number of slices = 112) while partial-brain volumes were acquired with 0.8 mm resolution (number of slices = 64). Scanning parameters were optimized for each sequence and resolution. Flip angles for 2D and 3D sequences were 75-degrees and 14-degrees, respectively. For both 2D and 3D EPI, 3×2 (in-plane x slice) acceleration was used (FOV/3 shift and CAIPI shift 1, respectively). All TRvol were matched to 3.2 seconds. TE for 1.1 mm and 1.7 mm resolutions were set to 19 ms for both 2D and 3D EPI. However, at 0.8 mm resolution, TEs were set to minimum achievable values, which were 29 ms and 21 ms for 2D and 3D EPI, respectively.
A flickering checkerboard pattern with 6.25 Hz frequency in blocks of 19.2/41.6 s on/off was used for visual stimulation. Additional resting state images with same protocols were acquired from two other subjects. Total 89 volumes were acquired for each run.
Data Analysis
FSL tools, including MCFLIRT, BET and FLIRT (version 6.0, FMRIB Software Library, Oxford, UK), were used to apply motion correction and to linearly register images that were acquired with 2D and 3D EPI.5-7 After applying motion correction and brain extraction, six volumes prior to each stimulation period and the last six volumes of each run were extracted for calculating tSNR. Additionally, percent difference in tSNR comparing 3D to 2D EPI images was calculated for each resolution per subject:
$$\textrm{percent difference}=\frac{tSNR_{3D}-tSNR_{2D}}{tSNR_{2D}}*100\%$$
FMRI data with visual task were processed using FEAT. No Gaussian smoothing was applied and Z-statistic images were thresholded with Z>3.0 and P<0.05.
Results and Discussion
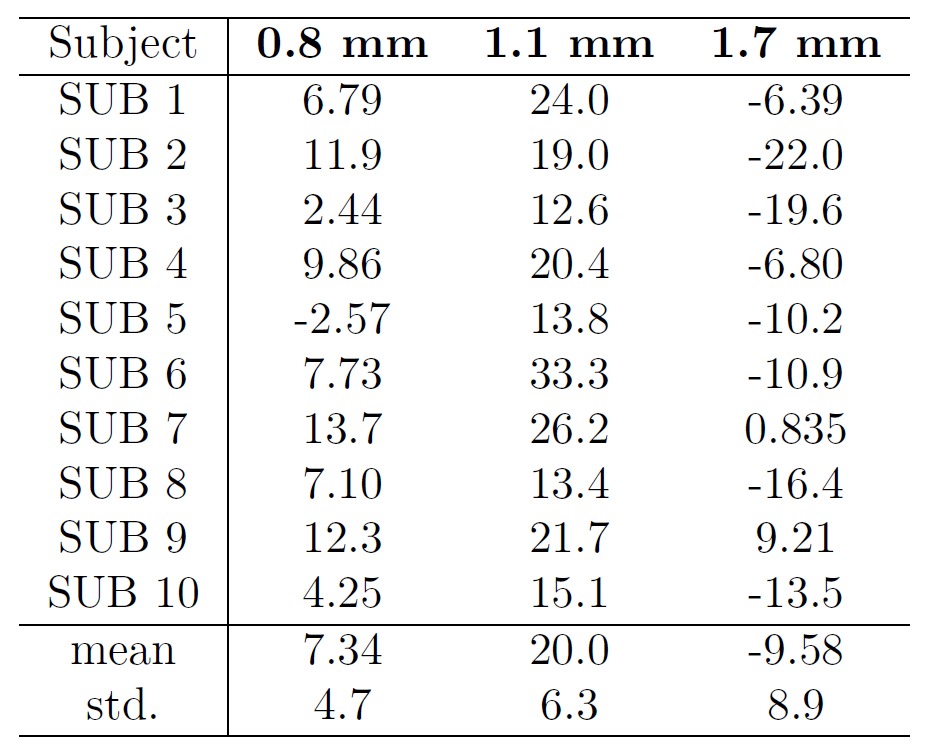
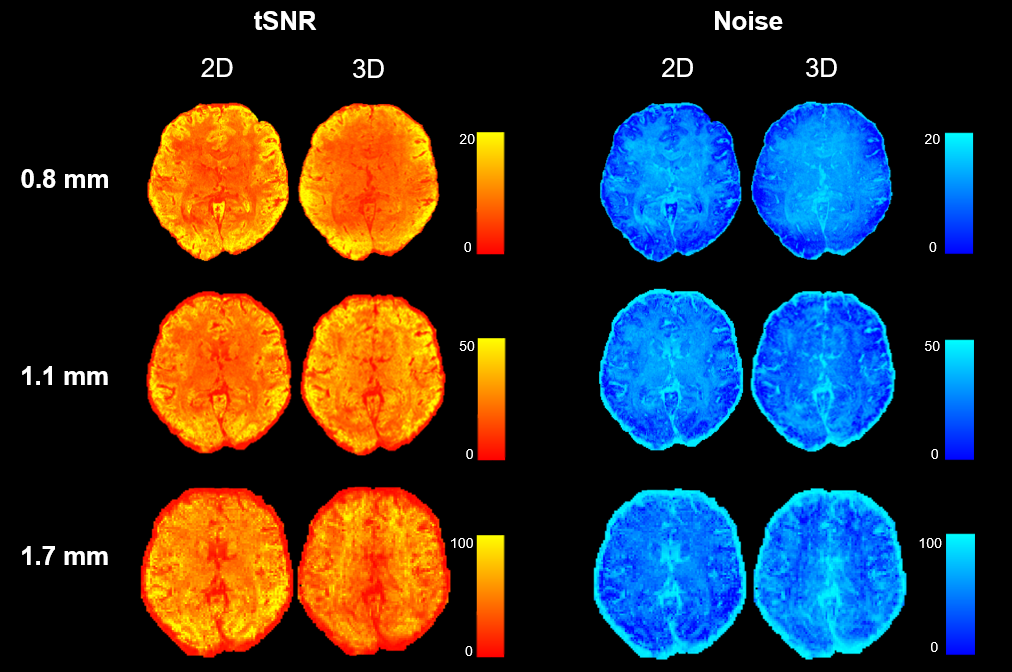
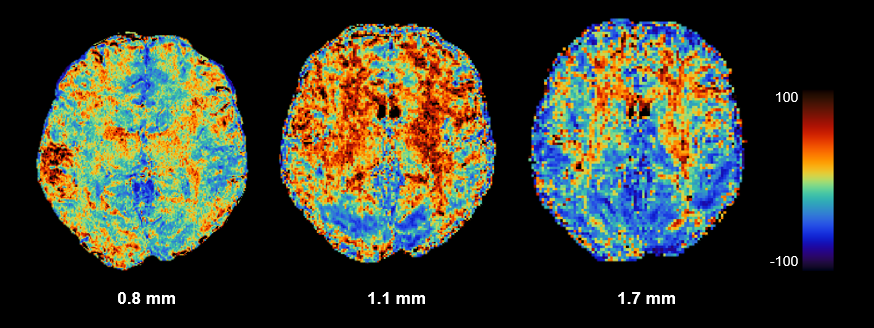
Figure 1 displays tSNR and noise maps of a subject’s brain during a single session. Images acquired with 3D EPI at 0.8 mm and 1.1 mm resolutions had greater tSNR than 2D EPI images. However, 3D EPI at 1.7 mm resolution had more noise than 2D EPI images, heavily affected by its known characteristic of capturing greater amount physiological noise than 2D sequences.1 Table 1 illustrates tSNR comparison between spatial resolutions averaged per subject. One subject’s data were excluded due to severe artifacts along the slice direction in 2D EPI images.In addition, Figure 2 illustrates percent differences in tSNR between 2D and 3D EPI images from one subject. Overall tSNR was higher for 3D EPI at 0.8 mm resolution. At 1.1 mm, evidently higher tSNR for 3D EPI was observed for most of the displayed slice. However, 3D EPI had lower tSNR in the occipital lobe. This may be due to 3D EPI’s more disadvantageous g-factor penalty or particularly strong physiological artifacts in this area, given that low flip angles were used in 3D EPI compared to 2D EPI. At 1.7 mm, 2D EPI had overall dominance in tSNR. For the presented comparison, 2D and 3D EPI protocols were individually optimized (e.g. FLEET8 vs. FLASH autocalibration9, fat saturation vs. binomial water excitation10). On the other hand, TR was adjusted according to the more time-limited 2D EPI (longer multiband pulses and fat saturation per TR). In particular with elliptical sampling, 3D EPI could be considerably faster without changing parallel imaging.4 Future analysis including physiological noise correction is expected to produce higher tSNR and z-scores for both sequences. This will give stronger boost to 3D EPI, particularly at lower spatial and temporal resolutions.4,11
Conclusion
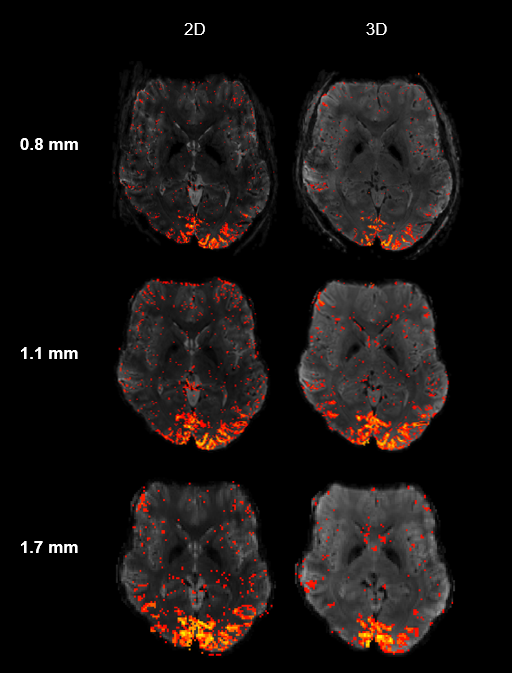
This study provides evidence that 3D EPI sequence has the capacity to outperform 2D EPI in high-resolution fMRI. Images acquired with three isotropic spatial resolutions (0.8 mm, 1.1 mm, and 1.7 mm) across eleven subjects showed different levels of tSNR. While 3D EPI at 0.8 mm and 1.1 mm resolutions yielded greater tSNR compared to 2D EPI, the same was not true at 1.7 mm resolution. This is likely due to 3D EPI’s greater susceptibility to physiological noise, which, however, can be corrected using various methods.1,12 Functional sensitivity evaluation of EPI sequences is ongoing. For illustrative purposes, Figure 3 shows different levels of activation in the occipital lobe of one subject, arranged by pulse sequences and spatial resolutions.Acknowledgements
This work was supported by the Institute for Basic Science under grant IBS-R015-D1.References
[1] Antoine Lutti, David L. Thomas, Chloe Hutton, and Nikolaus Weiskopf. High-resolution functional MRI at 3T: 3D/2D echo-planar imaging with optimized physiological noise correction. Magnetic Resonance in Medicine, 69(6):1657–1664, July 2012.
[2] W. van der Zwaag, J. P. Marques, T. Kober, G. Glover, R. Gruetter, and G. Krueger. Temporal SNR characteristics in segmented 3D-EPI at 7T. Magnetic Resonance in Medicine, 67(2):344–352, June 2011.
[3] B.A. Poser, P.J. Koopmans, T. Witzel, L.L. Wald, and M. Barth. Three dimensional echo-planar imaging at 7 Tesla. NeuroImage, 51(1):261–266, May 2010.
[4] Rüdiger Stirnberg, Willem Huijbers, Daniel Brenner, Benedikt A. Poser, Monique Breteler, and Tony Stöcker. Rapid whole-brain resting-state fMRI at 3T: Efficiency-optimized three-dimensional EPI versus repetition time-matched simultaneous-multi-slice EPI. NeuroImage, 163:81–92, December 2017.
[5] Mark Jenkinson, Christian F. Beckmann, Timothy E.J. Behrens, Mark W. Woolrich, and Stephen M. Smith. FSL. NeuroImage, 62(2):782–790, August 2012.
[6] Stephen M. Smith, Mark Jenkinson, Mark W. Woolrich, Christian F. Beckmann, Timothy E.J. Behrens, Heidi Johansen-Berg, Peter R. Bannister, Marilena De Luca, Ivana Drobnjak, David E. Flitney, Rami K. Niazy, James Saunders, John Vickers, Yongyue Zhang, Nicola De Stefano, J. Michael Brady, and Paul M. Matthews. Advances in functional and structural MR image analysis and implementation as FSL. NeuroImage, 23:S208– S219, January 2004.
[7] Mark W. Woolrich, Saad Jbabdi, Brian Patenaude, Michael Chappell, Salima Makni, Timothy Behrens, Christian Beckmann, Mark Jenkinson, and Stephen M. Smith. Bayesian analysis of neuroimaging data in FSL. NeuroImage, 45(1):S173–S186, March 2009.
[8] Jonathan R. Polimeni, Himanshu Bhat, Thomas Witzel, Thomas Benner, Thorsten Feiweier, Souheil J. Inati, Ville Renvall, Keith Heberlein, and Lawrence L.Wald. Reducing sensitivity losses due to respiration and motion in accelerated echo planar imaging by reordering the autocalibration data acquisition. Magnetic Resonance in Medicine, 75:665–679, 2016.
[9] D Ivanov, M Barth, K Uludag, and BA Poser. Robust acs acquisition for 3D echo planar imaging. In Proc Intl Soc Mag Reson Med., volume 23, 2015.
[10] Rüdiger Stirnberg, Daniel Brenner, Tony Stöcker, and N. Jon Shah. Rapid fat suppression for three-dimensional echo planar imaging with minimized specific absorption rate. Magnetic Resonance in Medicine, 76:1517–1523, 2016.
[11] Olivier Reynaud, João Jorge, Rolf Gruetter, José P. Marques, and Wietske van der Zwaag. Influence of physiological noise on accelerated 2D and 3D resting state functional MRI data at 7T. Magnetic Resonance in Medicine, 78(3):888–896, July 2017.
[12] C. Hutton, O. Josephs, J. Stadler, E. Featherstone, A. Reid, O. Speck, J. Bernarding, and N. Weiskopf. The impact of physiological noise correction on fMRI at 7T. NeuroImage, 57(1):101–112, July 2011.
Figures