3877
Locally low-rank denoising of complex-valued EPI reconstructions preceding task fMRI analysis1Biomedical Engineering and Physiology, Mayo Clinic Graduate School of Biomedical Sciences, Rochester, MN, United States, 2Radiology, Mayo Clinic, Rochester, MN, United States
Synopsis
This work examines the removal of physiologic and measurement noise (i.e. "denoising") of complex-valued EPI timecourse data preceding task-based fMRI analysis. The locally low-rank properties of the EPI data are leveraged with a blockwise singular value thresholding (BSVT) algorithm applied as a preprocessing step. Two EPI datasets (single-band and SMS multi-band) concomitant with task-based finger tapping fMRI exams were preprocessed with BSVT; activation maps were then compared by board-certified neuroradiologists. BSVT denoising of complex-valued fMRI time-course data prior to task analysis improves statistical confidence in activation areas identified by conventional processing or reveals new activation regions under fixed confidence levels.
Introduction
Clinically, task-based blood oxygen level dependent (BOLD)$$$^{1}$$$ functional MRI (fMRI) may precede surgery or radiotherapy to localize eloquent sensori-motor nervous tissue. Like other quantitative MRI forms, the confidence and precision of task-based fMRI are dependent on the correctness and completeness of the data model (in terms of physiology, physics, and statistics), image reconstruction, and post-processing. Minimizing false positive and negative activity is important, since the presence and absence of neural activity are both considered during intervention.Although fMRI processing is typically performed on magnitude (i.e., modulus) images, recent studies have demonstrated that BOLD-based functional activation is also detectable using MRI complex-valued or phase data,$$$^{2-9}$$$ noting that BOLD is fundamentally a susceptibility effect. Variants of standard fMRI statistical model-based$$$^{10-13}$$$ and independent component analysis (ICA)$$$^{14-16}$$$ methods have been proposed. Recent works have separately shown that spatiotemporal correlations in fMRI timecourse data cause its Casorati matrix $$$-$$$ which separates orthogonal spatial and temporal dimensions$$$^{17}$$$ $$$-$$$ to be low-rank,$$$^{18-24}$$$ and this property can be exploited to accelerate fMRI acquisitions. Beside fMRI, promoting spatiotemporal low-rankedness on overlapping spatially-local regions $$$-$$$ i.e., locally low-rank (LLR) $$$-$$$ can further improve the effectiveness of this prior characterization.$$$^{25-28}$$$
In this work, we study the removal of measurement and physiological noise from time-course EPI data (i.e., "denoising"), which can improve confidence and precision of identified activated regions. Noting the presence of task-relevant information in both magnitude and phase data, and statistical advantages with respect to managing noise statistics, we propose an LLR denoising strategy for complex-valued fMRI data preceding task statistical analysis. As demonstrated with in vivo examples, use of this preprocessing tool enables increased confidence in spatially localized activation following task-based fMRI and/or the ability to reveal additional activation areas, which might otherwise be suppressed during standard analysis.
Methods
Although magnitude MR images are typically modeled as having Rician noise, complex-valued MR images have zero-mean proper complex Gaussian noise $$$-$$$ which is easier to manage mathematically. Let $$$G = X + Z$$$ denote a set of $$$T$$$ $$$N\times N$$$ complex-valued MR images, rearranged as an $$$N^2\times T$$$ Casorati matrix, where $$$X$$$ is the target signal and $$$Z\sim \mathcal{CN}(0,\sigma^2)$$$. LLR estimation of $$$X$$$ from $$$G$$$ comprises solving$$
\hat{X} = \underset{X}{\text{argmin}} \ \left\{ \lambda \sum_{b \in \Omega} \Vert{R_{b}X}\Vert_* + \Vert X-G \Vert_F^2 \right\}
$$
where $$$ \Vert \cdot \Vert_*$$$ denotes the matrix nuclear norm, $$$\lambda \in \mathbb{R}^+$$$ is a regularization parameter, binary operator $$$R_b$$$ extracts a subset of rows of $$$X$$$ corresponding to a $$$\beta \times \beta \times T$$$ spatiotemporal patch of image data, and $$$b\in\Omega$$$ is the block index defining the patch location. Although the complete solution of this problem must be determined iteratively, the first iteration result from a variable splitting method typically provides sufficient performance. This process, called blockwise singular value thresholding (SVT)$$$^{25-26,29}$$$ or BSVT, estimates $$$X$$$ as
$$
\hat{X} = c^{-1} \sum_{b \in \Omega} R_b^* \big\{ SVT_{\lambda/2} \{ R_b G \} \big\},
$$
where the normalizing diagonal matrix $$$c = \sum_{b \in \Omega} R_b^* R_b$$$.
Two healthy volunteer subjects were scanned on a Compact 3T MRI scanner$$$^{30}$$$ under an IRB-approved task-based fMRI protocol. Imaging parameters were: (1) $$$N_x=N_y=64$$$, $$$N_z=37$$$, $$$N_t=115$$$, $$$FOV/\Delta z=24$$$cm/$$$4$$$mm, $$$TR/TE=2000/35$$$ms, single-band, alternating bilateral finger tapping, with BSVT $$$\lambda=1$$$; (2) $$$N_x=N_y=90$$$, $$$N_z=60$$$, $$$N_t=329$$$, $$$FOV/\Delta z=21.6$$$cm/$$$2.4$$$mm, $$$TR/TE=700/30$$$ms, SMS multi-band$$$^{31-34}$$$ $$$R=6$$$, simultaneous finger tapping, with BSVT $$$\lambda=10$$$. For each data set, both scanner-generated magnitude images (baseline) and magnitude of the results of complex-valued BSVT denoising ($$$\beta=8$$$) were obtained. For all, activation maps were thresholded by board-certified neuroradiologists after generation using Analysis of Functional Neuroimages (AFNI)$$$^{35}$$$ with blocks tshift, align, volreg, mask, scale, regress, and subsequent clustering. Three neuroradiologists (referred to here as Readers 1, 2, and 3) thresholded both single- and multi-band EPI data; a fourth neuroradiologist (Reader 4) thresholded only multi-band EPI data. The first $$$\sim 10$$$s of TRs were discarded to yield steady-state magnetization, which is reflected in the stated matrix dimensions of EPI data.
Results
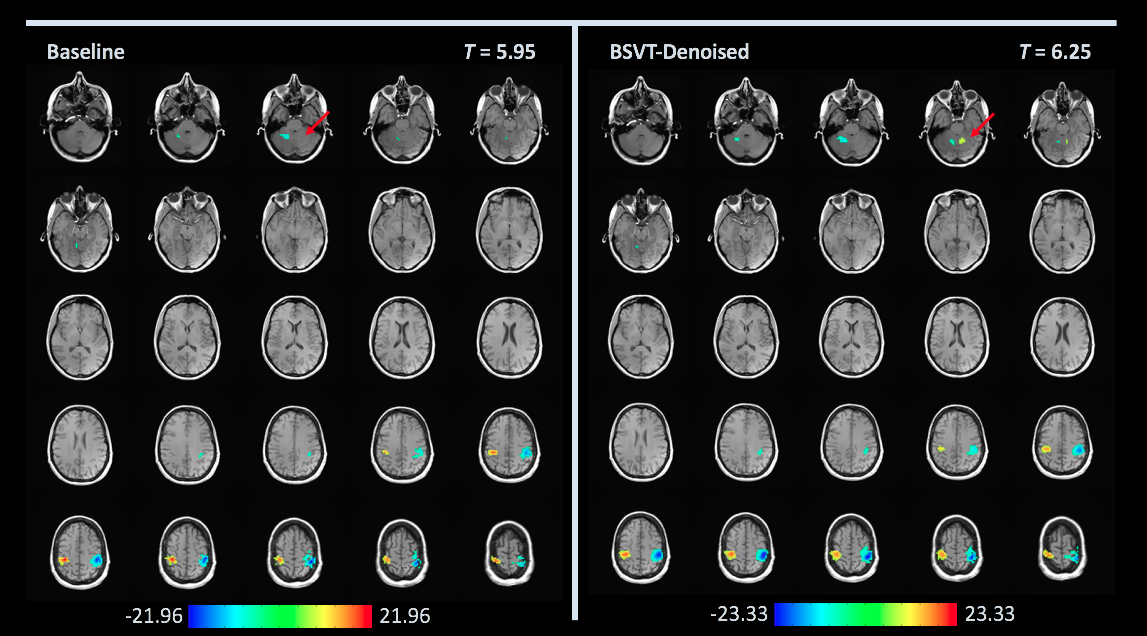
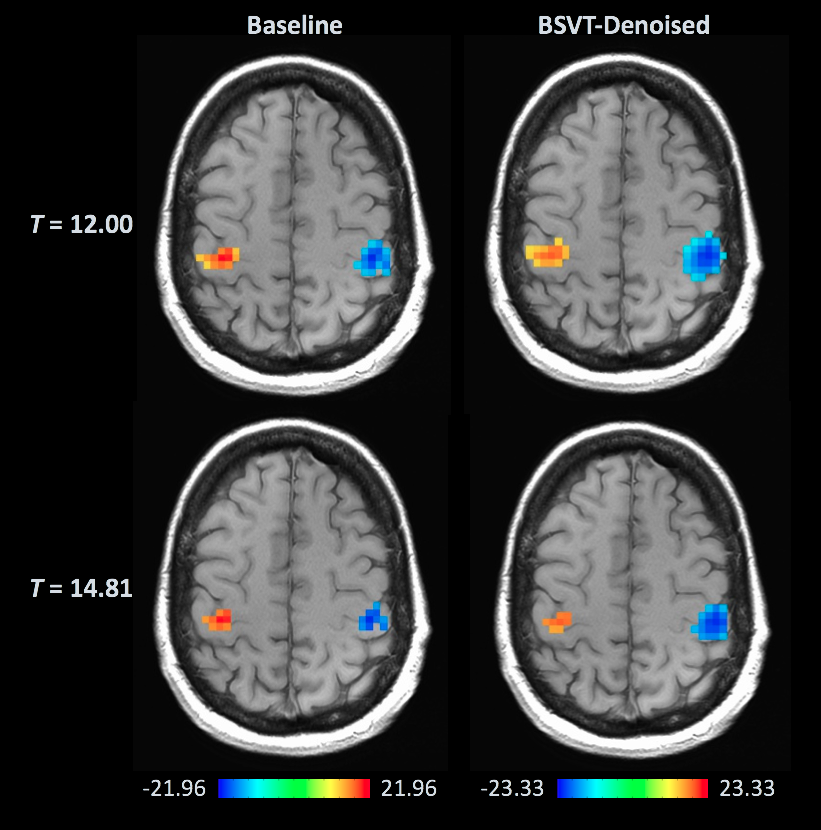
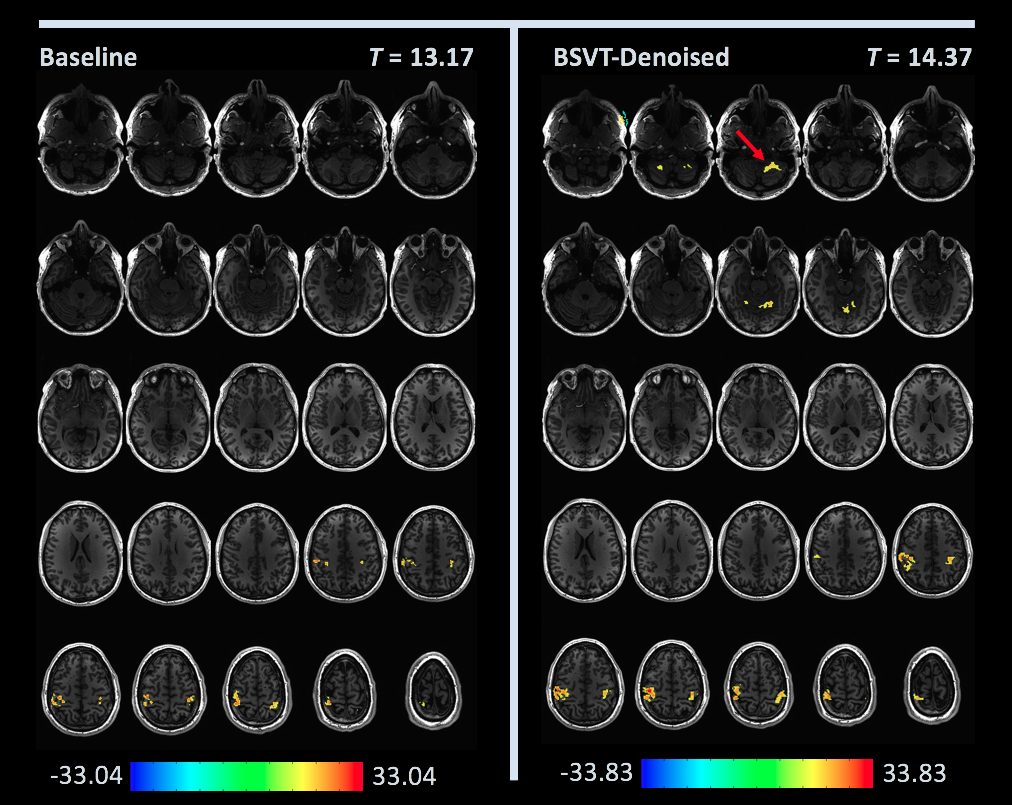
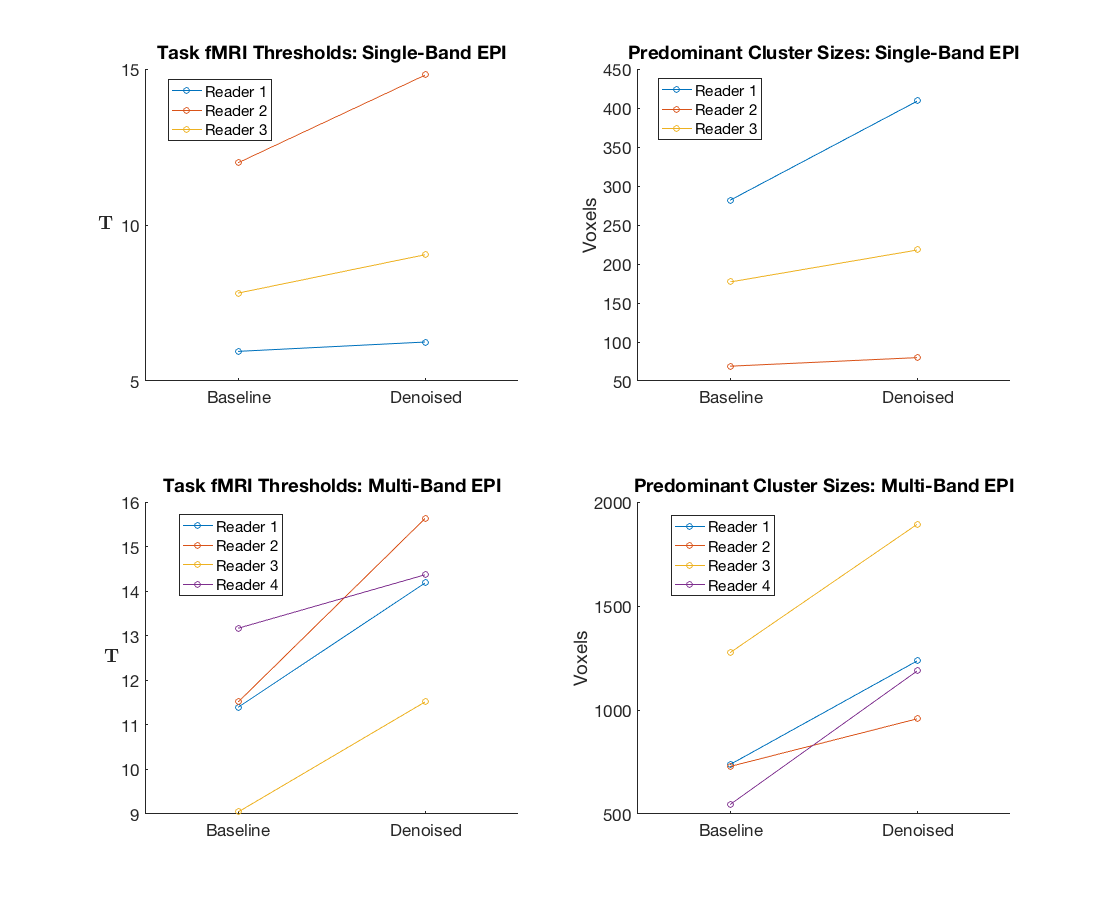
Figures 1-3 show selected activation maps encompassing the two experiments and processing variants, including radiologist $$$T$$$-statistic selection and observations, corresponding to individual readers' results. Figure 4 summarizes increasing T-statistic threshold trends between baseline and BSVT processing, across all experiments and readers. In thresholding maps, two readers preferred both cerebellar and motor cortex activation present as in Figures 1 (single-band, Reader 1) and 3 (multi-band, Reader 4); while another reader elected to threshold single-band data at higher $$$T$$$, precisely localizing motor cortex activation as in Figure 2 (single-band, Reader 2).Discussion
As demonstrated in Figures 1-4, BSVT of complex-valued fMRI data allowed readers to select higher T-statistic thresholds for improved confidence within regions identified in baseline images, or alternatively reveal additional areas of activation (adjacent to primary, or in other anticipated regions like the cerebellum) under baseline thresholds. This suggests BSVT can yield practical benefits under a wide range of diagnostic approaches. Complex-valued BSVT could also be applied in conjunction with advanced analysis techniques like ICA to further increase performance, and may also benefit resting-state fMRI analysis.Conclusion
BSVT denoising of complex-valued fMRI time-course data prior to task analysis improves statistical confidence in activation areas identified by conventional processing or reveals new activation regions under fixed confidence levels.Acknowledgements
This work was supported by NIH Grant U01EB024450, and by the NSF Graduate Research Fellowship Program (GRFP).References
1. S Ogawa, DW Tank et al. Brain magnetic resonance imaging with contrast dependent on blood oxygenation. Proc Natl Acad Sci USA 1990; 87(24):9868-9872.
2. S Lai, GH Glover. Detection of BOLD fMRI signals using complex data. Proc Intl Soc Mag Reson Med 1997; 1671.
3. F Hoogenraad, M Sprenger et al. In Vivo Measurement of Changes in Venous Blood-Oxygenation with High Resolution Functional MRI at 0.95 Tesla by Measuring Changes in Susceptibility and Velocity. Magn Reson Med 1998; 39:97-107.
4. DB Rowe. Modeling both the magnitude and phase of complex-valued fMRI data. NeuroImage 2005; 25:1310-1324.
5. SK Arja, VD Calhoun et al. Changes in fMRI magnitude data and phase data observed in block-design and event-related tasks. Neuroimage 2010; 49(4):3149-3160.
6. Z Chen, J Liu, VD Calhoun. Susceptibility-based functional brain mapping by 3D deconvolution of an MR-phase activation map. J Neurosci Methods 2013; 216(1):33-42.
7. Z Chen, VD Calhoun. T2* phase imaging and processing for brain functional magnetic susceptibility (X) mapping. Biomed Phys Eng Express 2016; 2(2).
8. Z Chen, VD Calhoun et al. Functional brain connectivity in resting-state fMRI using phase and magnitude data. J Neurosci Methods 2018; 293(1):299-309.
9. Z Chen, Z Fu, V Calhoun. Phase fMRI Reveals More Sparseness and Balance of Rest Brain Functional Connectivity than Magnitude fMRI. Front Neurosci 2019; doi.org/10.3389/fnins.2019.00204.
10. FY Nan, RD Nowak. Generalized Likelihood Ratio Detection for fMRI Using Complex Data. IEEE Trans Med Imaging 1999; 18(4):320-329.
11. MC Kociuba, DB Rowe. Complex-valued time-series correlation increases sensitivity in FMRI analysis. Magn Reson Imaging 2016; 34(6):765-770.
12. CH Yu, D Rowe et al. A Bayesian Variable Selection Approach Yields Improved Detection of Brain Activation From Complex-Valued fMRI. J Am Stat Assoc 2018; 113(524):1395-1410.
13. DW Adrian, R Maitra, DB Rowe. Complex-valued time series modeling for improved activation detection in fMRI studies. Ann Appl Stat 2018; 12(3):1451-1478.
14. VD Calhoun, JJ Pekar et al. Independent Component Analysis of fMRI Data in the Complex Domain. Magn Reson Med 2002; 48, 180-192.
15. P Rodriguez, VD Calhoun et al. Phase correction and denoising for ICA of complex fMRI data. Proc IEEE International Conference on Acoustics, Speech and Signal Processing 2010.
16. MC Yu, VD Calhoun et al. ICA of full complex-valued fMRI data using phase information of spatial maps. J Neurosci Methods 2015; 249:75-91.
17. ZP Liang. Spatiotemporal imaging with partially separable functions. Proc IEEE International Symposium on Biomedical Imaging 2007: 988-991.
18. F. Lam, Z.-P. Liang, N. Schuff et al. Accelerated fMRI using low-rank model and sparsity constraints. Proc Intl Soc Mag Reson Med 2013; 2620.
19. M Chiew, KL Miller et al. k-t FASTER: Acceleration of Functional MRI Data Acquisition Using Low Rank Constraints. Magn Reson Med 2014; 74:353-364.
20. L Weizman, KL Miller, YC Eldar, M Chiew. PEAR: PEriodic And fixed Rank separation for fast fMRI. Medical Physics 2017; 44(12):6166-6182.
21. P Aggarwal, A Gupta et al. Optshrink LR + S: accelerated fMRI reconstruction using non-convex optimal singular value shrinkage. Brain Informatics 2017; 4(1):65-83.
22. V Abolghasemi, S Ferdowsi. Singular Value Thresholding for Multidimensional Data: Application to fMRI and Terahertz Imaging. Proc 3rd Iranian Conference on Signal Processing and Intelligent Systems (ICSPIS) 2017.
23. M Chiew, NN Graedel, KL Miller. Recovering task fMRI signals from highly under-sampled data with low-rank and temporal subspace constraints. Neuroimage 2018; 174:97-110.
24. S Guo, DC Noll. Patch-Tensor Low-n-Rank Reconstruction for Oscillating Steady State fMRI Acceleration. Proc Intl Soc Mag Reson Med 2018; 3531.
25. J Trzasko, A Manduca. Local versus Global Low-Rank Promotion in Dynamic MRI Series Reconstruction. Proc Intl Soc Mag Reson Med 2011; 4371.
26. EJ Candes; CA Sing-Long; JD Trzasko. Unbiased Risk Estimates for Singular Value Thresholding and Spectral Estimators. IEEE Trans Signal Process 2013; 61(19):4643-4657.
27. T Zhang, JM Pauly, IR Levesque. Accelerating Parameter Mapping with a Locally Low Rank Constraint. Magn Reson Med 2015; 73(2):655-661.
28. Y Hu, BL Hargreaves et al. Motion‐robust reconstruction of multishot diffusion‐weighted images without phase estimation through locally low‐rank regularization. Magn Reson Med 2019; 81(2):1181-1190.
29. JF Cai, EJ Candes, Z Shen. A Singular Value Thresholding Algorithm for Matrix Completion. SIAM J Optim 2010; 20(4):1956-1982.
30. TK Foo, MA Bernstein et al. Lightweight, compact, and high-performance 3T MR system for imaging the brain and extremities. Magn Reson Med 2018, 80:2232-2245.
31. DJ Larkman, G Ehnholm et al. Use of multicoil arrays for separation of signal from multiple slices simultaneously excited. J Magn Reson Imaging 2001; 13(2):313-317.
32. S Moeller, K Uğurbil et al. Multiband multislice GE‐EPI at 7 tesla, with 16‐fold acceleration using partial parallel imaging with application to high spatial and temporal whole‐brain fMRI. Magn Reson Med 2010; 63(5):1144-1153.
33. K Setsompop, LL Wald et al. Blipped-controlled aliasing in parallel imaging for simultaneous multislice echo planar imaging with reduced g-factor penalty. Magn Reson Med 2012; 67(5):1210-1224.
34. M Barth, BA Poser et al. Simultaneous multislice (SMS) imaging techniques. Magn Reson Med 2016; 75(1):63-81.
35. RW Cox. AFNI: Software for analysis and visualization of functional magnetic resonance neuroimages. Computers and Biomedical Research 1996; 29:162-173.
Figures