3871
tSNR increase with field monitoring for correction of scanner instabilities and physiological noise at 7T in single-shot 2D-EPI sequences1Université Paris-Saclay, Neurospin, CEA, Gif-sur-Yvette, France
Synopsis
Signal-dependent noise contributions in a voxel limit the temporal SNR (tSNR) gain brought by increasing the image SNR. The effect of retrospectively correcting for field fluctuations on the tSNR for different SNR regimes at 7T in single-shot 2D-EPI sequences was assessed using field sensor measurements. For the slice located at isocenter, results of the study show an increase of up to 20% in vivo on the grey matter region and for high SNR regimes.
Introduction
Temporal SNR (tSNR) gain engendered from an increase of image SNR is limited by the presence of signal-dependent physiological noise in the voxels that originates from various sources (cerebral metabolism, breathing and cardiac cycles, scanner imperfections etc…) and leads to temporal signal fluctuations1. The use of field monitoring to retrospectively correct for these fluctuations has been shown to improve the tSNR measure at 3T on phantoms2 and in vivo3. In these studies, the tSNR gain was mostly due to the correction of hardware-related fluctuations. A recent study performed at 7T has demonstrated a tSNR gain for the 3D-EPI sequence when correcting for the global phase drift in B0 disturbed conditions such as heavy breathing and limb motion4. The aim of the current study was to assess the effect of retrospective correction of field fluctuations with up to 2nd order spherical harmonic decomposition on the tSNR for different SNR regimes at 7T and in single-shot 2D-EPI sequences.Methods
Acquisitions were performed on 1 volunteer on a Magnetom 7T scanner (Siemens Healthcare, Erlangen, Germany) equipped with the Nova 1Tx-32Rx head coil (Nova Medical, Wilmington, MA, USA). A field sensors setup (Skope MRT, Zurich, Swiss), consisting in 16 19F NMR field probes, was positioned on the receive part of the coil.An axial 2D-EPI sequence was acquired at isocenter with TR/TE 500/21 ms, 64x64 matrix, FOV 192 mm, no acceleration, no partial Fourier, BW of 2170 Hz/pixel, 2 mm slice thickness, 50 repetitions, no fat suppression. In order to span various SNR regimes, the sequence was acquired with the following flip angles: 0°, 1°, 5°, 10°, 15°, 20°, 25° and 30°. As a first trial, the methodology was tested for one axial slice located at the isocenter.
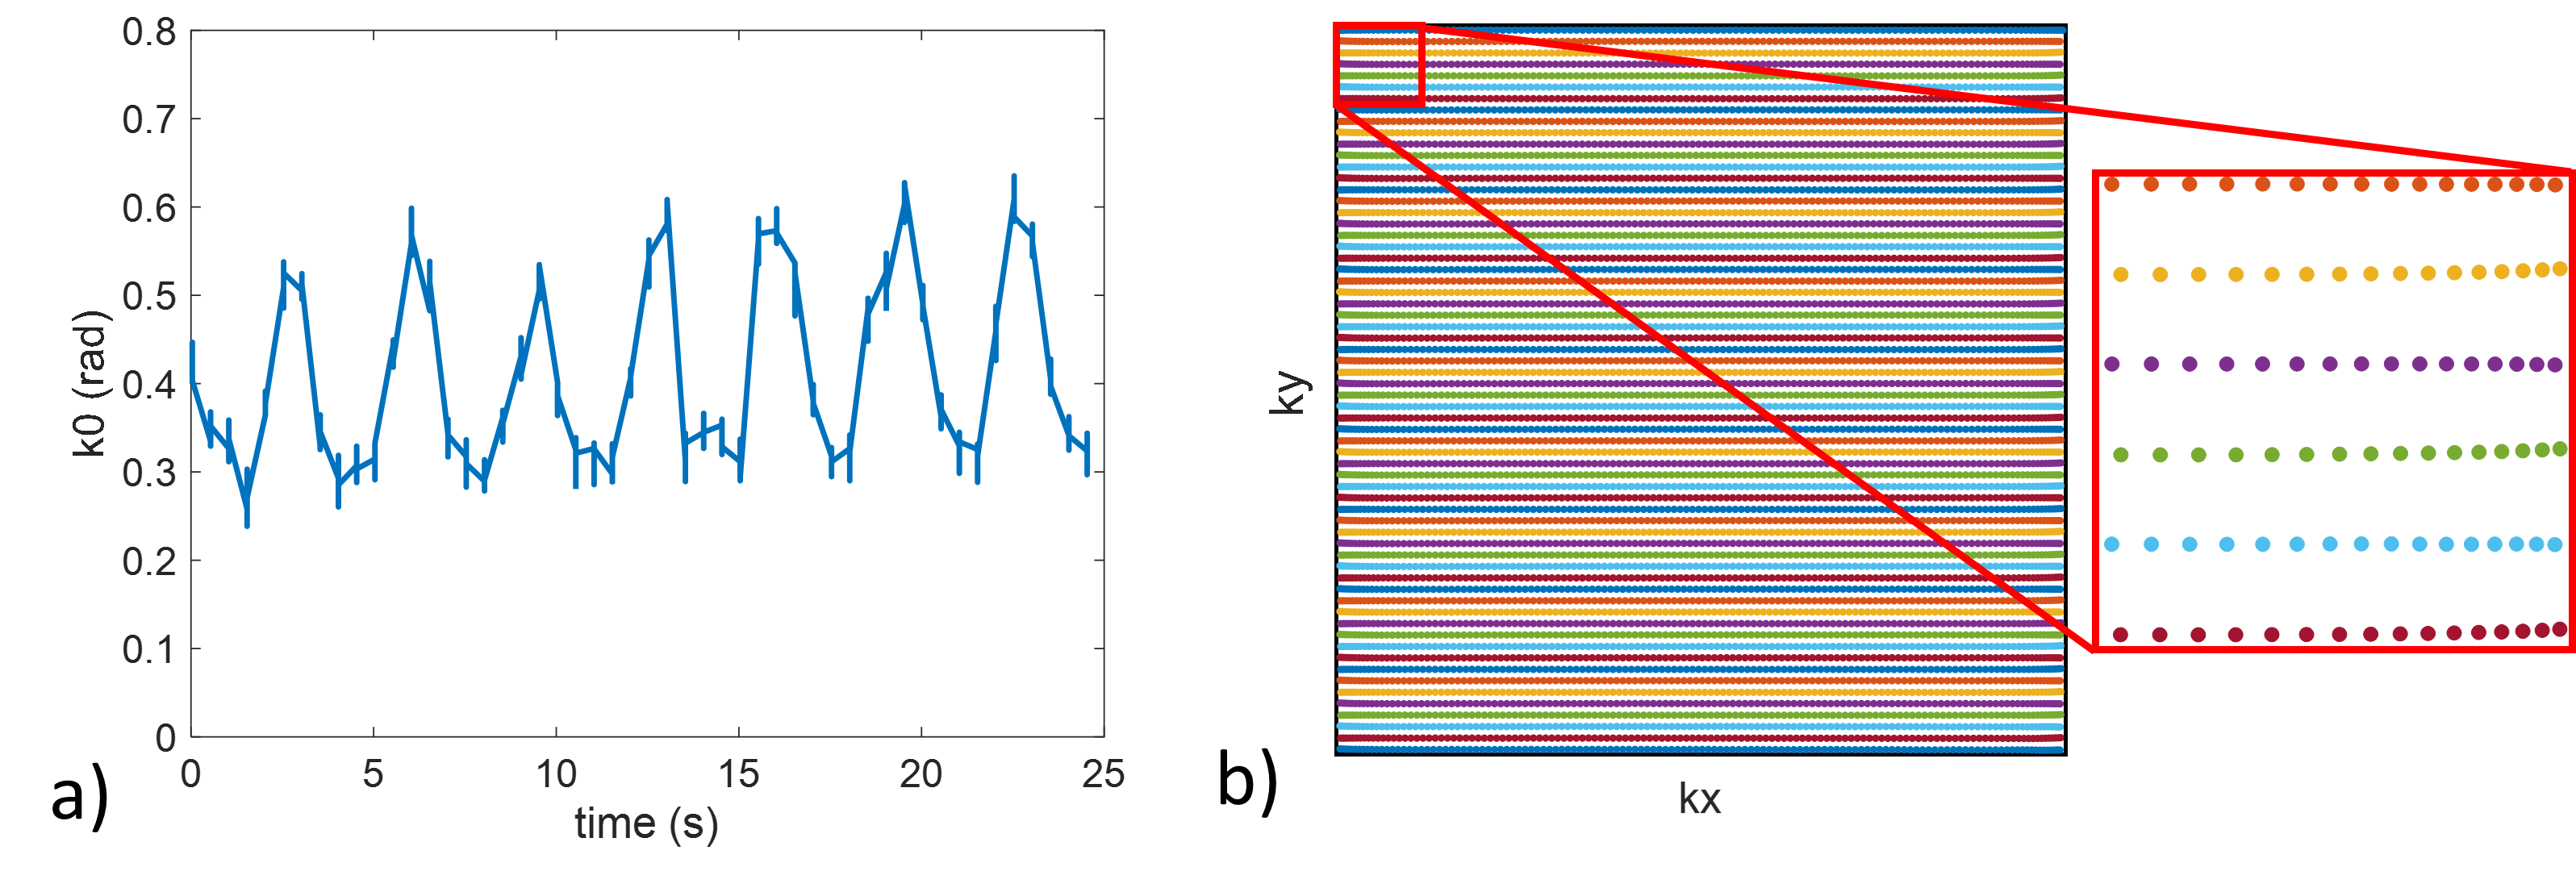
Concurrently to the scanner acquisition, the 19F NMR field probes were excited just after proton excitation and their signals were recorded during the EPI readout train. Spherical harmonic spatial basis functions of the 0th to the 2nd order were fitted to the probe phase signals. Image reconstruction of the individual channels was carried out with the Skope-i software (Skope, Zurich, Swiss) that implements an iterative conjugate gradient algorithm. Three levels of correction were tested: 1) reconstruction with the nominal trajectories, 2) reconstruction with 0th and 1st order field coefficients (i.e. B0, Gx, Gy and Gz) and 3) reconstruction with up to the 2nd order field coefficients (5 additional terms).
For each flip angle and each correction level, images of the individual channels were combined using the noise covariance weighted root sum-of-squares combination method5 enabled with a 0° scan, yielding SNR0 maps. The time series of the combined images were realigned and corrected for linear trends. tSNR maps were then computed as the mean temporal signal divided by its temporal standard deviation. A correction factor was applied to low SNRs to account for noise bias in magnitude images7,8. Regions of interest (ROIs) were manually drawn in the occipital grey matter and in the frontal white matter on magnitude images. The ROI-averaged SNR0 and tSNR were computed for each flip angle.
Results
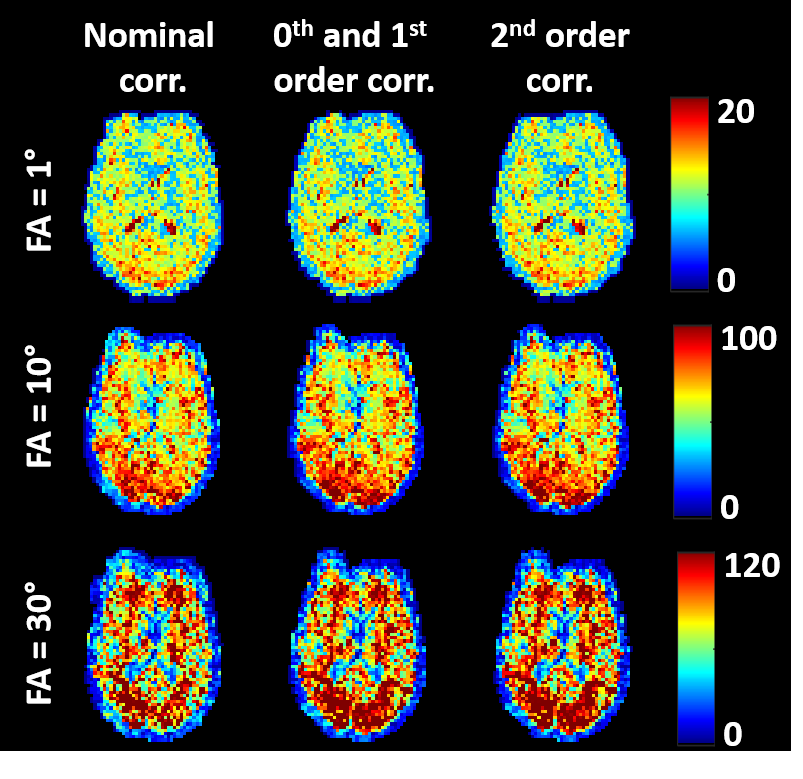
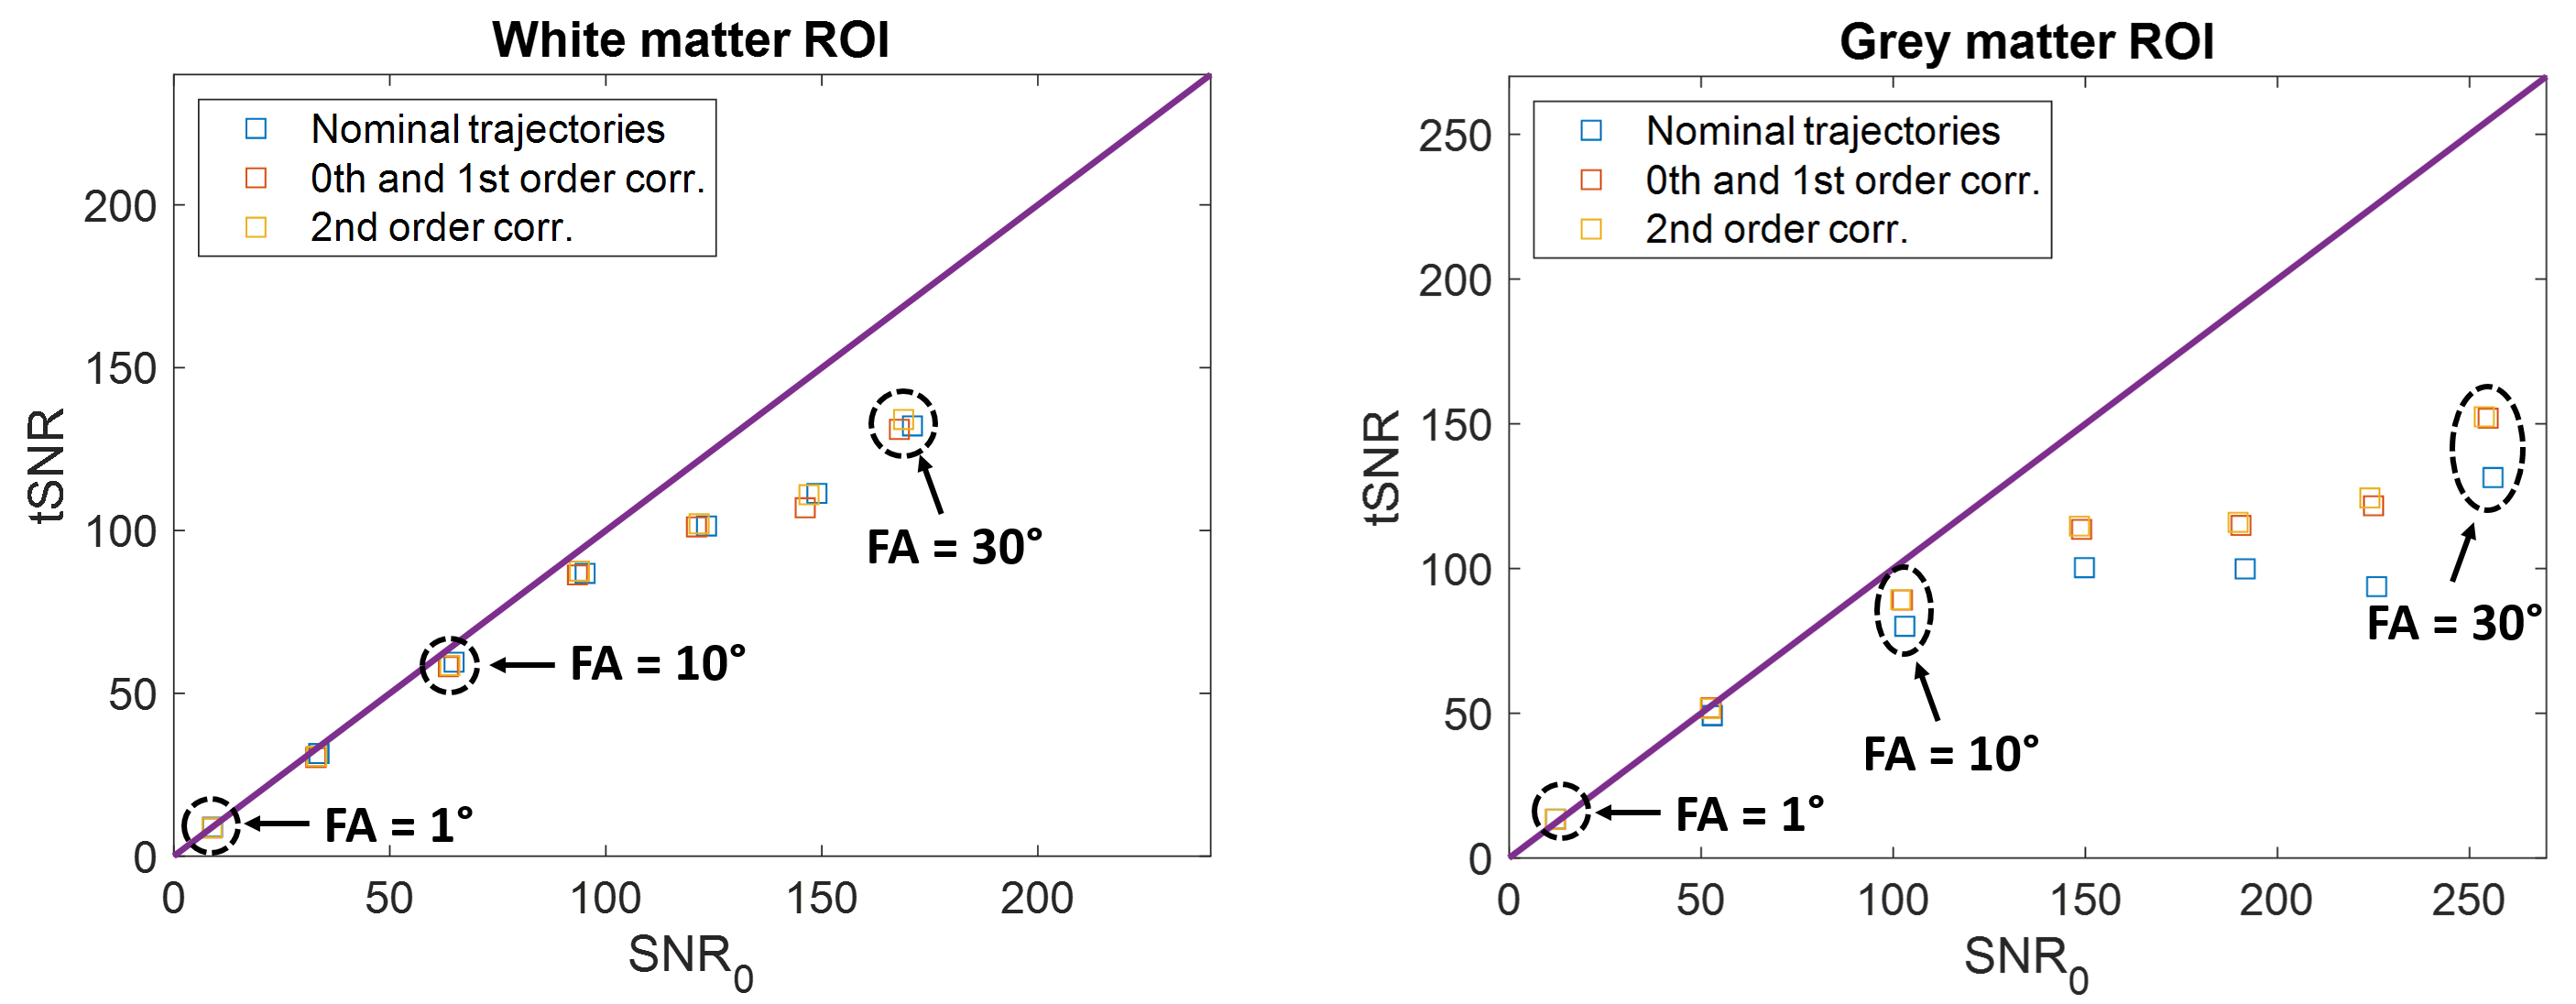
The evolution of B0 shows a periodical fluctuation of about 0.3 rad related to the breathing cycle (Figure 1.a). A slight deviation from the Cartesian sampling was observed in the retrospectively corrected k-space sampling pattern obtained from the 1st order field coefficients Gx and Gy due to both ramp sampling and shifts between odd and even echoes (Figure 1.b). Inclusion of field coefficients in the image reconstruction did not improve the measure of tSNR for low SNR0 regimes as expected (Figure 2), while it showed an improvement for higher SNR0 due to the stronger presence of physiological noise. Inclusion of the 2nd order field coefficients did not really improve the tSNR measurement at the locations investigated. This is also illustrated in the tSNR vs. SNR0 curves (Figure 3) where the correction of field fluctuations is shown to be beneficial for SNR0 values higher than the thermal-noise dominated regime. The tSNR gain was more prominent in the grey matter ROI where the asymptotic limit was increased by 19% with 0th and 1st order field coefficients and 20% with up to 2nd order field coefficients, compared to the white matter ROI where no improvement was observed.Discussion and conclusion
This study shows that temporal signal fluctuations caused by the signal-dependent physiological noise can partly be corrected in the grey matter when 0th and 1st order field expansion is taken into account in the image reconstruction, which in turn increases the maximal tSNR attainable in the grey matter. The white matter tSNR showed no improvement with this correction, which could be explained by the stronger physiological noise in the grey matter than in the white matter and by the explored SNR0 regimes1. Most likely, similar gains could be obtained in white matter for higher SNR0 regimes. The inclusion of the second order field coefficients showed little improvement, although lower slices could benefit more from this extended field correction.Acknowledgements
This work has received fundings from the European Union Horizon 2020 Research and Innovation program under Grant Agreement No. 736937. It is also supported by the Leducq Foundation (large equipment ERPT program, NEUROVASC7T project). The authors thank Christian Mirkes for technical support.
References
1. Krüger, G., & Glover, G. H. (2001). Physiological noise in oxygenation‐sensitive magnetic resonance imaging. Magnetic Resonance in Medicine, 46(4), 631-637.
2. Kasper, L., Bollmann, S., Vannesjo, S. J., Gross, S., Haeberlin, M., Dietrich, B. E., & Pruessmann, K. P. (2015). Monitoring, analysis, and correction of magnetic field fluctuations in echo planar imaging time series. Magnetic resonance in medicine, 74(2), 396-409.
3. Bollmann, S., Kasper, L., Vannesjo, S. J., Diaconescu, A. O., Dietrich, B. E., Gross, S., ... & Pruessmann, K. P. (2017). Analysis and correction of field fluctuations in fMRI data using field monitoring. Neuroimage, 154, 92-105.
4. Schwarz, J., Stirnberg, R., Ehses, P., Stöcker, T. Correction of physiological field fluctuations in high- and low-resolution 3D-EPI acquisitions at 7 Tesla. ISMRM 2019, abstract 0446.
5. Triantafyllou, C., Polimeni, J. R., & Wald, L. L. (2011). Physiological noise and signal-to-noise ratio in fMRI with multi-channel array coils. Neuroimage, 55(2), 597-606.
6. Jenkinson, M., Bannister, P., Brady, M., & Smith, S. (2002). Improved optimization for the robust and accurate linear registration and motion correction of brain images. Neuroimage, 17(2), 825-841.
7. Constantinides, C. D., Atalar, E., & McVeigh, E. R. (1997). Signal‐to‐noise measurements in magnitude images from NMR phased arrays. Magnetic Resonance in Medicine, 38(5), 852-857.
8. Kellman, P., & McVeigh, E. R. (2005). Image reconstruction in SNR units: a general method for SNR measurement. Magnetic resonance in medicine, 54(6), 1439-1447.
Figures