3866
Transition-Band SSFP and EPI Functional MRI on a High-Performance 0.55 T Scanner1AMRI, LFMI, NINDS, National Institutes of Health, Bethesda, MD, United States, 2Cardiovascular Branch, Division of Intramural Research, NHLBI, National Institutes of Health, Bethesda, MD, United States
Synopsis
Low magnetic susceptibility contrast and inadequate gradient performance have limited the use of low-field systems for BOLD fMRI. With the recent introduction of low-field scanners equipped with high-performance gradients, we re-evaluated the feasibility of low-field fMRI by comparing transition-band SSFP and GRE-EPI at 0.55 T. With optimized acquisition parameters both techniques proved practical for detection of brain activation in response to visual stimulation. EPI was found to be more robust to system imperfections and physiological noise. In the current study, SSFP does not appear to outperform conventional EPI in the level and spatial extent of activation.
Introduction
Small-flip-angle transition-band balanced steady-state free procession (SSFP) has been proposed for fMRI of human brain activity for its high sensitivity to intravoxel signal dephasing and frequency shifts associated with the BOLD contrast mechanism [1]. Despite its theoretically high image SNR and superb fMRI sensitivity, its practical application has been limited by its high demands on main (B0) field homogeneity (typically a few Hz), which is difficult to achieve at typical clinical field strengths of 1.5T and above. Therefore, practical applications of SSFP have required repeated scans at different frequency shifts.One way to overcome this is to scan at lower field, at which B0 spread is substantially reduced, albeit at some expected loss in fMRI sensitivity. With the recent introduction of high-performance gradient to an experimental low-field (0.55 T) MRI system [2], an opportunity has presented itself to test the practicality of performing SSFP fMRI without the need for scanning over a range of frequencies. In addition, successful implementation of fMRI at low fields using either SSFP or conventional EPI will significantly boost the utility of this cost-effective imaging modality and increase access to fMRI in developing countries. Here, we compared single-slice SSFP and multi-slice EPI for their capability to detect BOLD fMRI signal changes in response to block-design visual stimuli.
Methods
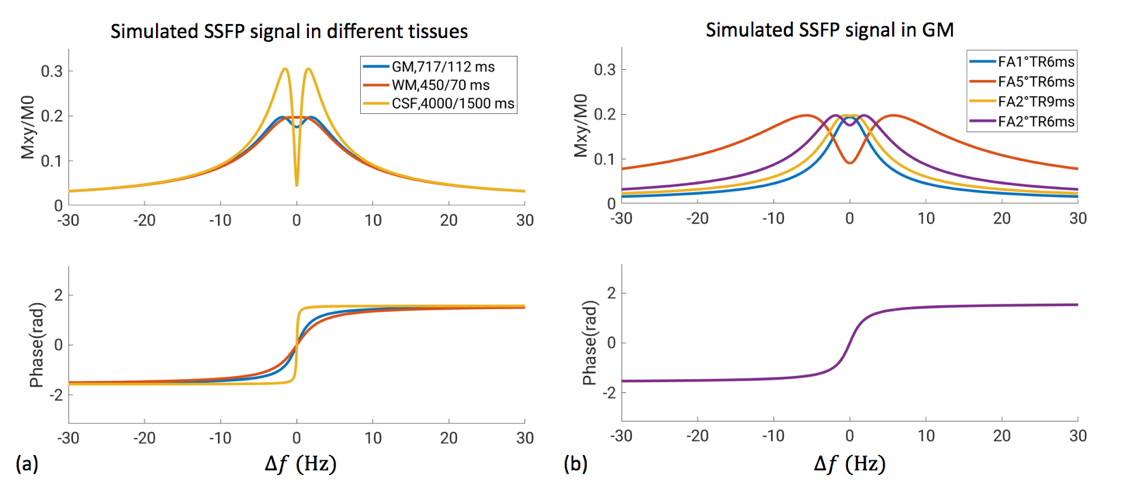
Experiments were performed on six normal volunteers using a high-performance 0.55 T MRI system (a ramped-down prototype 1.5 T Aera; Siemens Healthineers, Erlangen, Germany) using a 16-channel receive array. For SSFP, a single 4-mm-thick slice was acquired parallel to the calcarine fissure, using 240x180 mm2 FOV, 72x54 matrix size, 2° flip-angle (FA), 6ms TR (324ms slice TR), 3ms TE. Magnetic field homogeneity was optimized over the visual cortex by adjusting the field shims. TR was chosen to be as short as possible to maximize imaging efficiency. FA was chosen to give high-level signal profile over the entire transition band (Figure 1). For EPI, 10 slices were acquired in the interleaved mode, using the same FOV and in-plane resolution as in the SSFP, 3mm slice thickness, 80° flip angle, 1.296s TR, 80ms TE. Visual Stimuli were presented in block design with alternating 20.7s (64 repetitions for SSFP and 16 for EPI) stimuli and rest periods, using an in-house developed flashing checkerboard pattern. Each run lasted for 248s. Data analysis was performed in FSL (FMRIB Software Library) using FEAT [3], consisting of motion correction, high-pass temporal filtering with 41.5s cutoff length, spatial smoothing with 5mm FWHM (full width at half maximum), noise pre-whitening, and statistical analysis based on general linear model. Temporal down sampling of SSFP was performed using averaging bins (size 4) before FEAT analysis to match the temporal resolution of EPI. For EPI, slice timing was corrected.Results
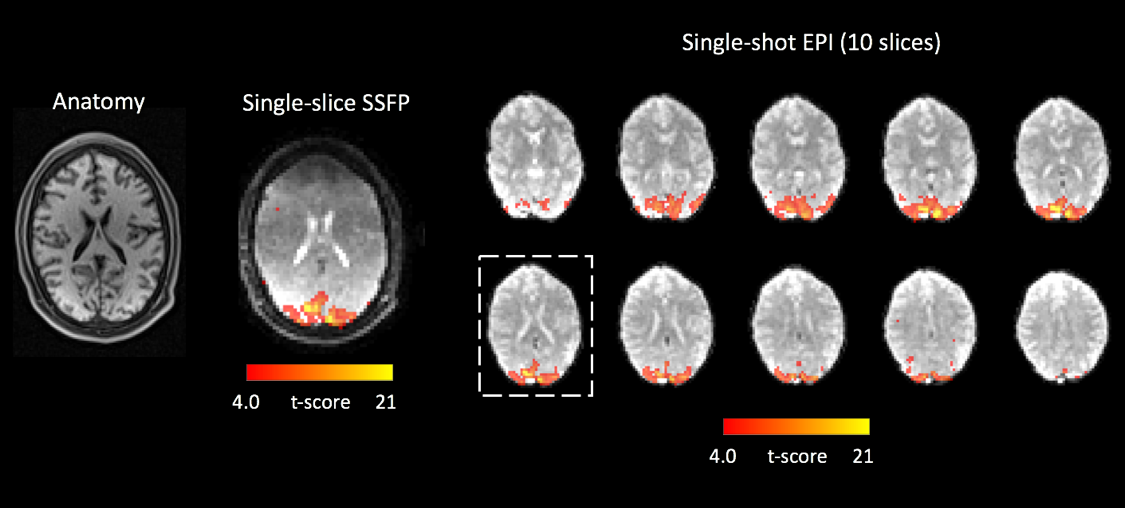
Over the visual cortex, tSNR was ~30% higher in EPI than in raw SSFP even though the latter had 33% larger slice thickness (Figure 2). SSFP tSNR was spatially inhomogeneous over the image slice due to remaining field inhomogeneities.All six subjects showed strong activation on EPI, defined as having more than 50 activated voxels with a t-score larger than 4.0 (p<0.05 with Bonferroni correction) on the same slice of SSFP. Five out of six SSFP experiments reached this significance. Among these five subjects, the number of activated voxels in SSFP was 90±21; in EPI it was 106±17; The number of their overlap was 61±22. Mean signal percentage changes in voxels activated in either modality were 1.7±0.3% for SSFP and 2.1±0.2% for EPI.
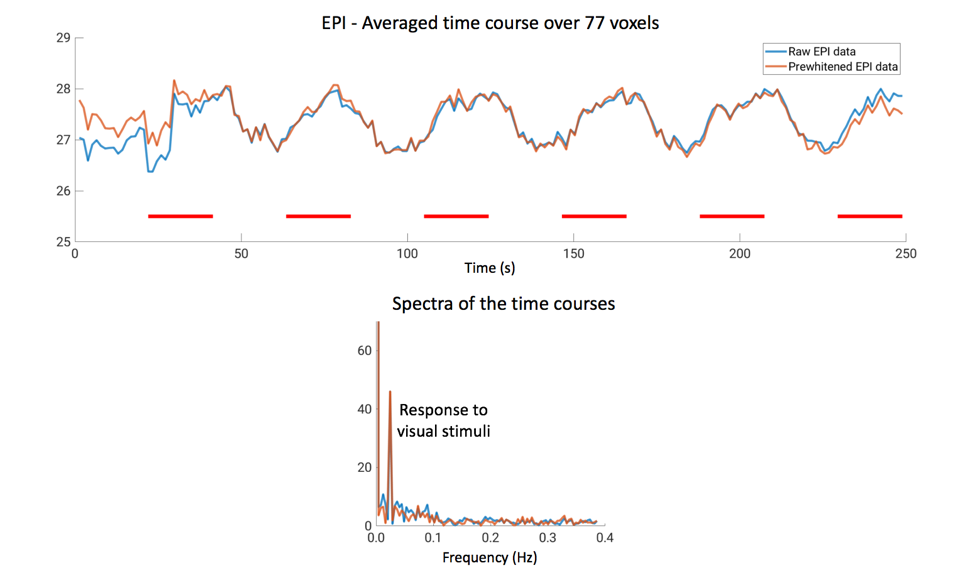
Example anatomical EPI and SSFP images are shown in Figure 3, with superimposed thresholded t-maps. In this case, strong activation in the visual cortex is observed in both experiments, and the activation is visually consistent in terms of spatial pattern and t-scores on the same acquisition slice. Averaged time courses and their corresponding spectra of the same 77 voxels activated in either image are plotted in Figures 4 and 5 for SSFP and EPI, respectively. For SSFP, a high-frequency oscillation is observed in raw data (blue) on top of the activation signal. On the spectrum, the oscillation is centered at ~0.37Hz and has a bandwidth of ~0.1Hz, corresponding to the respiration cycles. Bin-averaging and noise prewhitening alleviate this nuisance signal (orange). Physiological noise is less prominent with EPI, and a single peak at 0.024Hz is observed in the spectrum corresponding to the visual stimuli.
Discussion
The robust activation detected with both SSFP and EPI suggests that the reduced activation-induced susceptibility shifts at low field are not prohibitive for successful fMRI experiments. For SSFP, this is partly explained by the increased T2, which increases its sensitivity to subtle resonance frequency shifts, yet also gives rise to increased susceptibility to system imperfections (e.g. field drift, eddy current and concomitant fields) and physiological effects. For EPI, one advantage at low field is the reduced level of susceptibility-induced geometric distortions and signal loss. Image quality may be further improved after compensating for the concomitant field effects [4].Conclusion
Single-slice transition-band SSFP and EPI are both practical for BOLD fMRI at 0.55 T. EPI was found to be more robust than SSFP in terms of sensitivity to system imperfections and instabilities related to the respiratory cycles.Acknowledgements
This work has been supported by the intramural programs of NINDS and NHLBI. We would like to acknowledge the assistance of Siemens Healthcare in the modification of the MRI system for operation at 0.55T under an existing cooperative research agreement (CRADA) between NHLBI and Siemens Healthcare.References
1. Miller KL, Smith SM, Jezzard P, Wiggins GC, Wiggins CJ. Signal and noise characteristics of SSFP FMRI: A comparison with GRE at multiple field strengths. NeuroImage 2007;37:1227–1236 doi: 10.1016/j.neuroimage.2007.06.024.
2. Campbell-Washburn AE, Herzka DA, Kellman P, Koretsky AP, Balaban RS. Image contrast at 0.55T. In: Proc. Intl. Soc. Mag. Reson. Med. 27, Montreal, Canada, 2019. p.1214.
3. Woolrich MW, Ripley BD, Brady M, Smith SM. Temporal Autocorrelation in Univariate Linear Modeling of FMRI Data. NeuroImage 2001;14:1370–1386 doi: 10.1006/nimg.2001.0931.
4. Du YP, Zhou XJ, Bernstein MA. Correction of concomitant magnetic field-induced image artifacts in nonaxial echo-planar imaging. Magn. Reson. Med. 2002;48:509–515 doi: 10.1002/mrm.10249.
Figures