3865
Fingerprinting individual subjects from resting-state functional magnetic resonance imaging head motion1Institute of Bioengineering, Ecole Polytechnique Fédérale de Lausanne, Lausanne, Switzerland, 2Department of Radiology and Medical Informatics, University of Geneva, Geneva, Switzerland, 3Basque Center on Cognition, Brain and Language, San Sebastian, Spain
Synopsis
Head motion during resting-state functional magnetic resonance imaging acquisitions is an infamous confound requiring dedicated preprocessing steps. Here, we probed the level of complexity at which motion should be characterised. To do so, we designed a clustering-based approach that determines the spatio-temporal motion patterns that can fingerprint an individual. We found that each subject's motion could be fingerprinted at a different space/time granularity, some more easily than others. Our results call for refined motion descriptions in which space and time should not be over-simplified, and point towards the relevance of motion-related fingerprints as an individual's functional trait.
Introduction
In-scanner head motion is a major confound in resting-state (RS) functional magnetic resonance imaging (fMRI) analyses1. It is accounted for in several ways: scrubbing through a composite framewise displacement (FD) time course2, regression of individual motion time courses, and use of mean FD as a covariate in the analyses. These steps quantify motion with varying spatio-temporal granularity, reflecting how the true complexity of head motion remains an open question.Here, we tackled this problematic by developing a methodology that characterises individual subjects in terms of their spatio-temporal motion properties based on a rich dataset with dense functional sampling of individual brains, and assessed which spatial and temporal granularities would enable optimal fingerprinting.
Methods
FMRI data was gathered for 10 subjects, each scanned 40 times at rest over 10 separate sessions, in a 3T Siemens PrismaFit scanner with a 64 channel head coil. Each run of the RS fMRI data was collected with a multi-echo simultaneous multi slice echo-planar imaging sequence (TR=1.5 s, TEs=10.6/28.69/46.78/64.87/82.96 ms, flip angle=70°, SMS=4, GRAPPA=2, reference scan mode=gradient echo, partial Fourier=6/8, 52 slices, matrix=88 x 88, voxel size = 2.4 x 2.4 x 3 mm3) for 10 min (400 volumes), along with reversed phase-encode blips. After correcting for geometric distortions3, first echo volumes were realigned using MCFLIRT4, and after excluding the first 10 data points, the resulting motion time courses of translational and rotational parameters (dimensionality: 390 x 6) were taken as input to our method.Our strategy was to convert each run's realignment parameters into an M-dimensional representation, where M encompasses the space/time motion information. We compared all possible combinations of the 6 realignment parameters (i.e., spatial degrees of freedom), amounting to 63 cases. Each considered motion time course was differentiated, absolute valued, and eventually averaged over T successive time bins. We compared T ranging from 4 to 52 bins by steps of 6 (i.e., 9 cases). In total, 567 space/time configurations were thus contrasted in terms of their motion fingerprinting potential across subjects.
The same procedure was applied for each spatio-temporal motion feature case. First, the N x M matrix (with N=400 the number of RS runs) was normalised across subjects, so that positive/negative values for a given parameter denote larger/smaller motion compared to the average. Second, k-means clustering was performed (1000 replicates, cosine distance) to partition the data into K clusters.
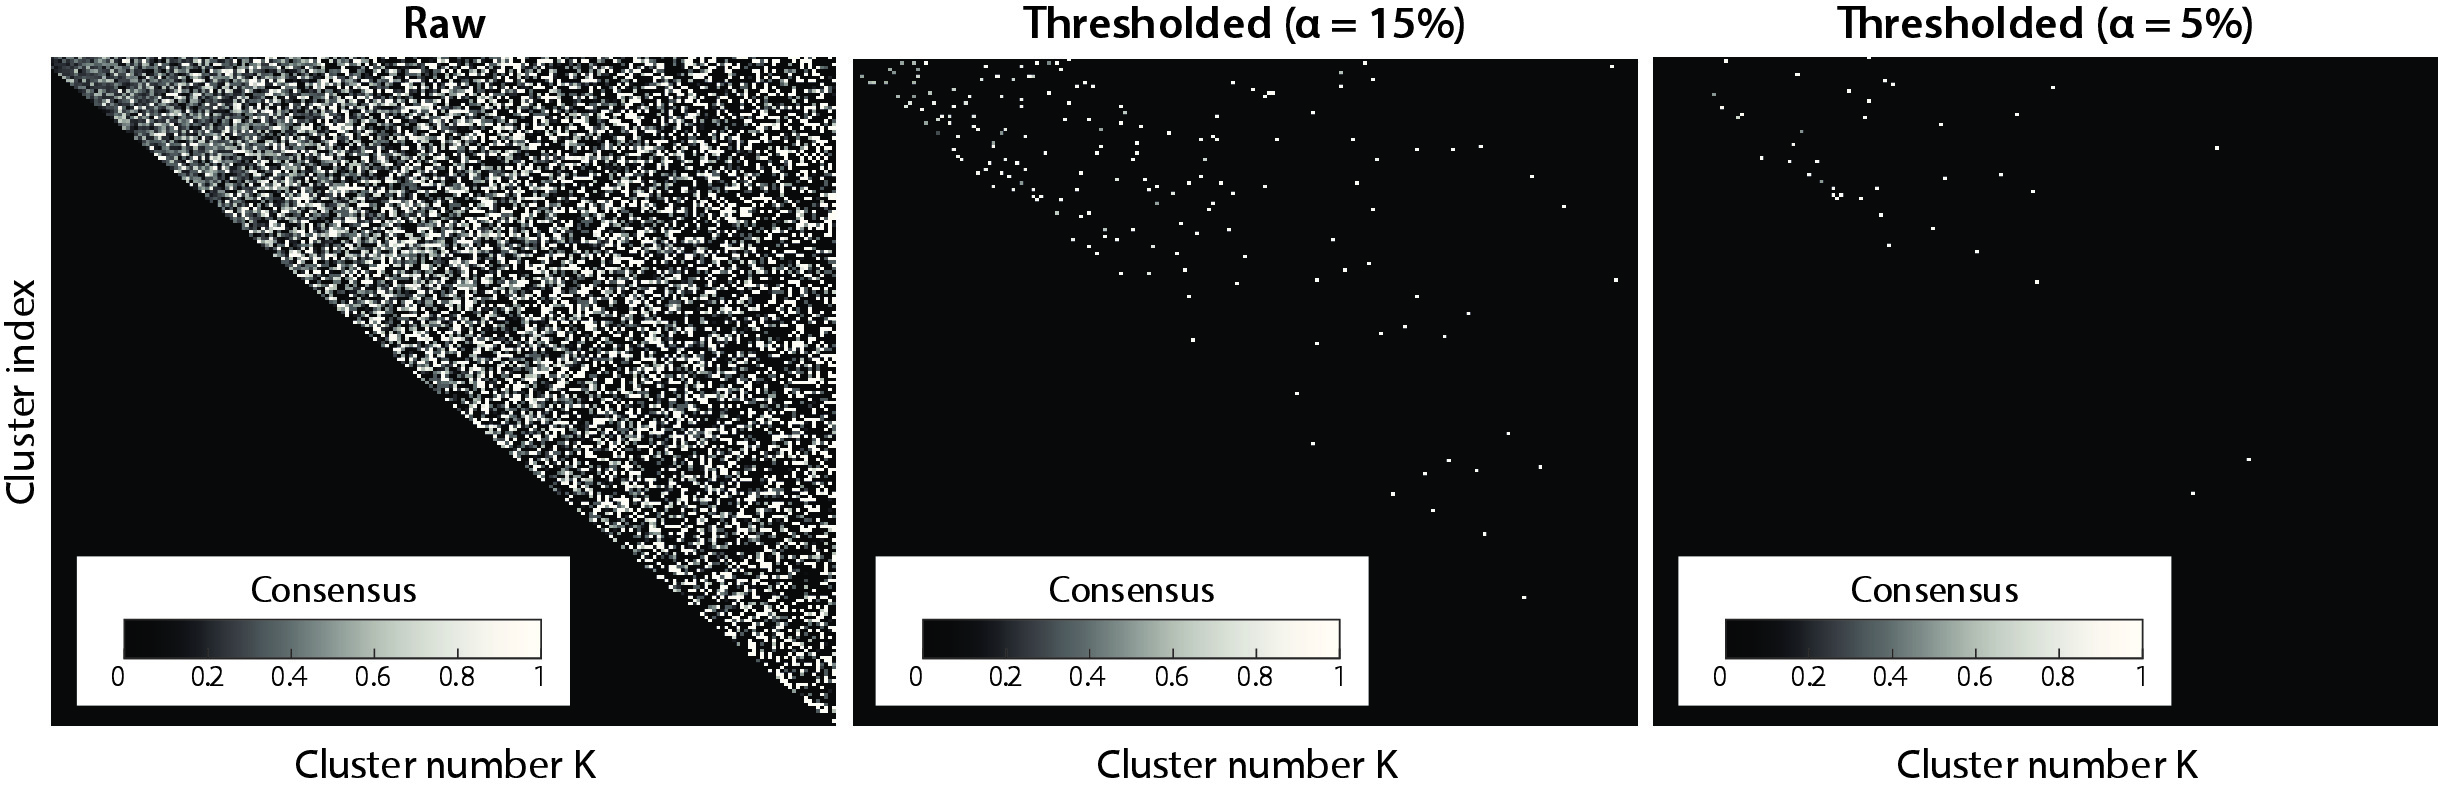
Third, for each cluster, we computed a consensus measure denoting how homogeneously its data points describe one subject (1: only data from one subject is in the cluster; 0: each data point is from a different subject). Because this measure is insensitive to the number of frames in a cluster, we appended a fourth step in which all consensus values across clusters containing a given number of frames were pooled into a distribution, thresholded at a dedicated α-level to select the most homogeneous clusters (see Figure 1).
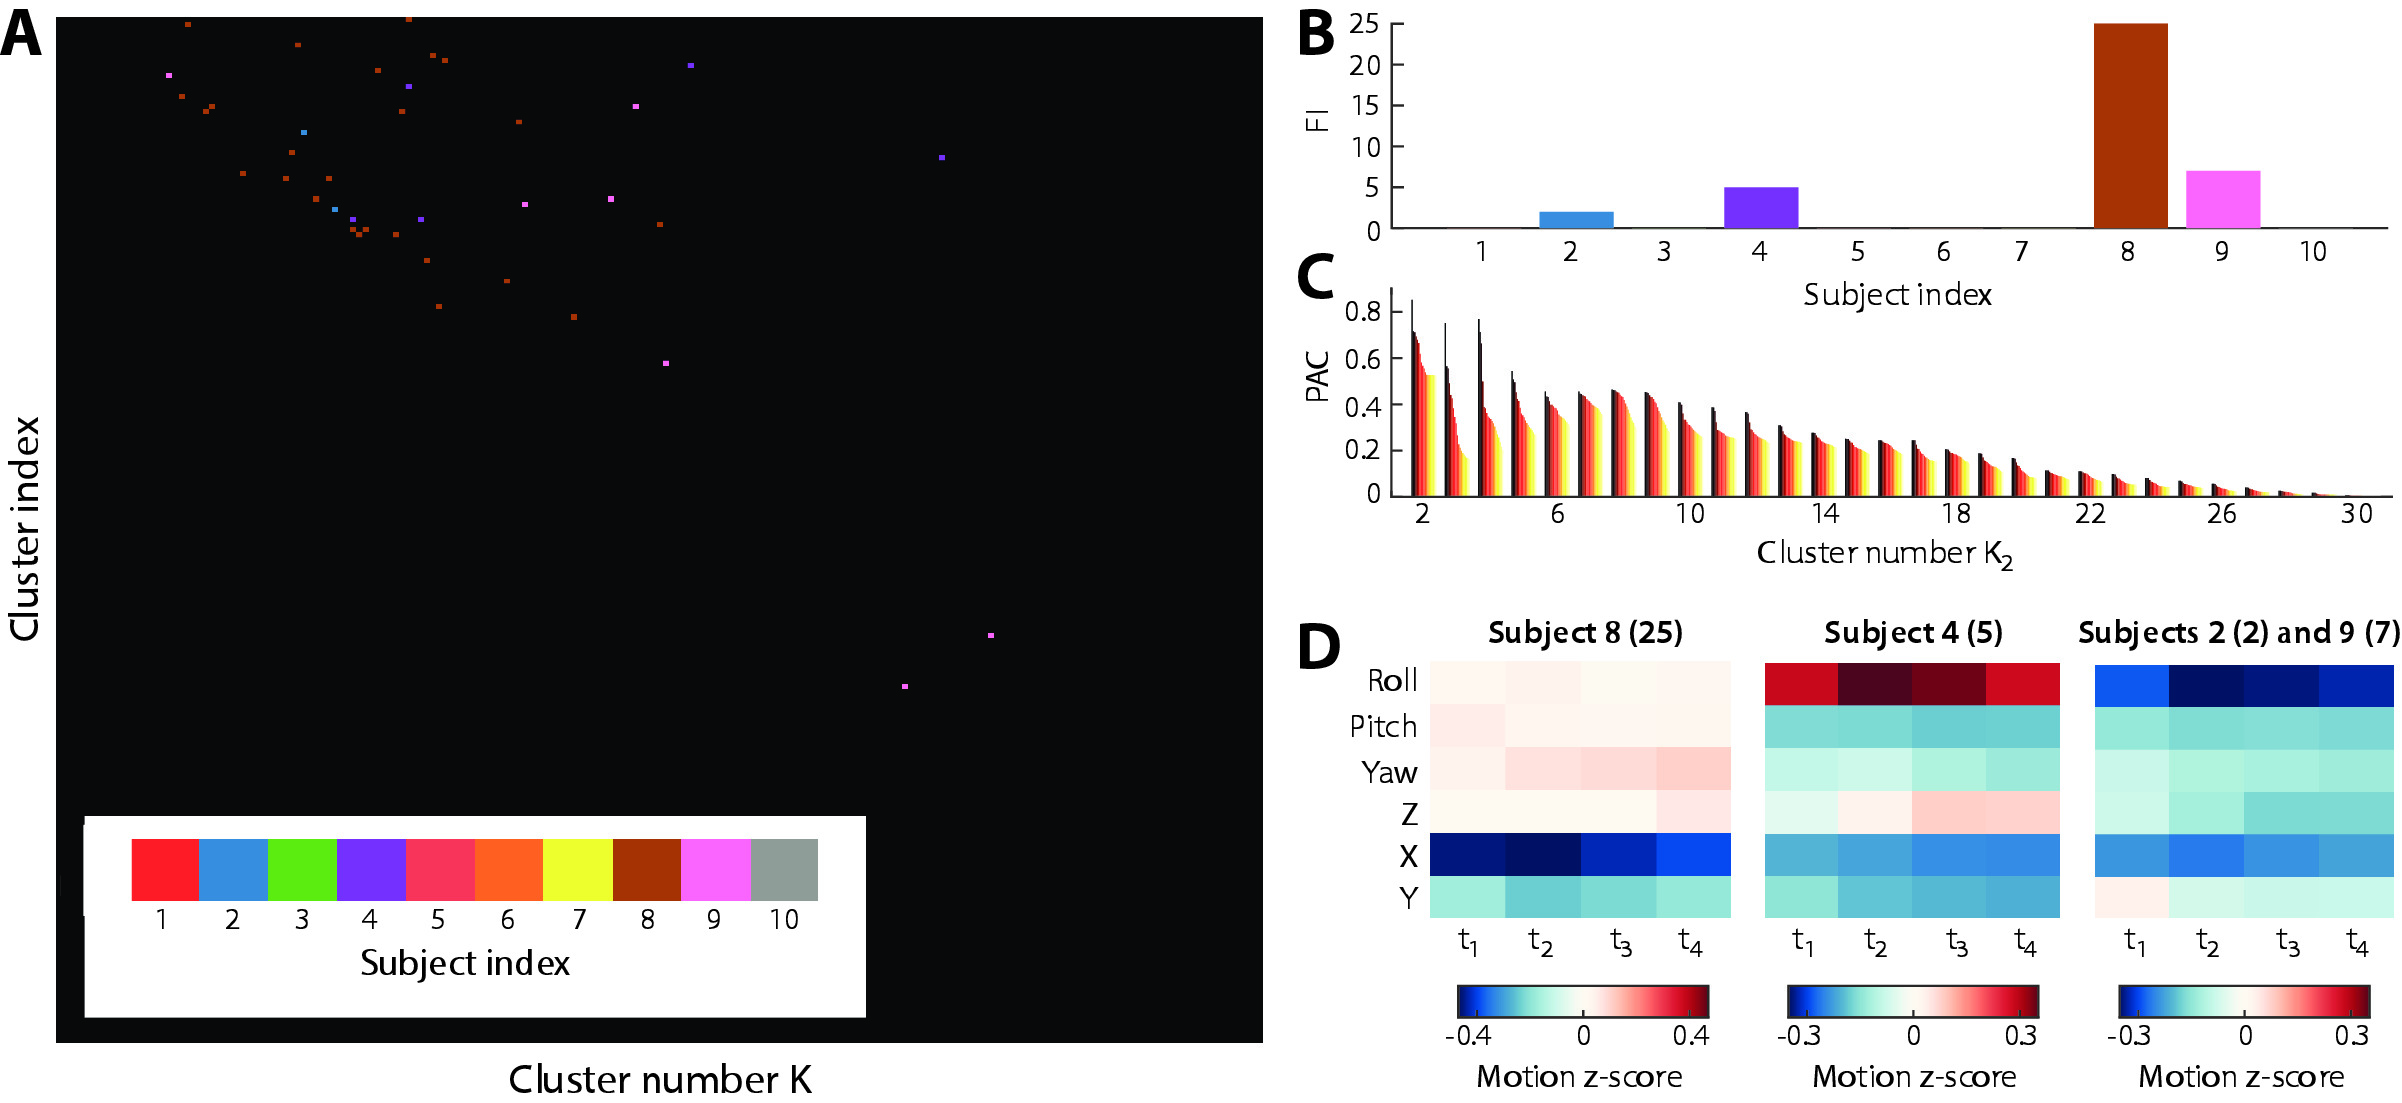
By counting, across significant clusters for all probed K values, how many times a given subject was homogeneously represented, a subject-specific fingerprinting index (FI) was obtained. A high FI indicates that the subject moves in a way that largely differs from the others, while a low FI indicates typical motion that does not distinguish itself from the average (see Figure 2).
Results
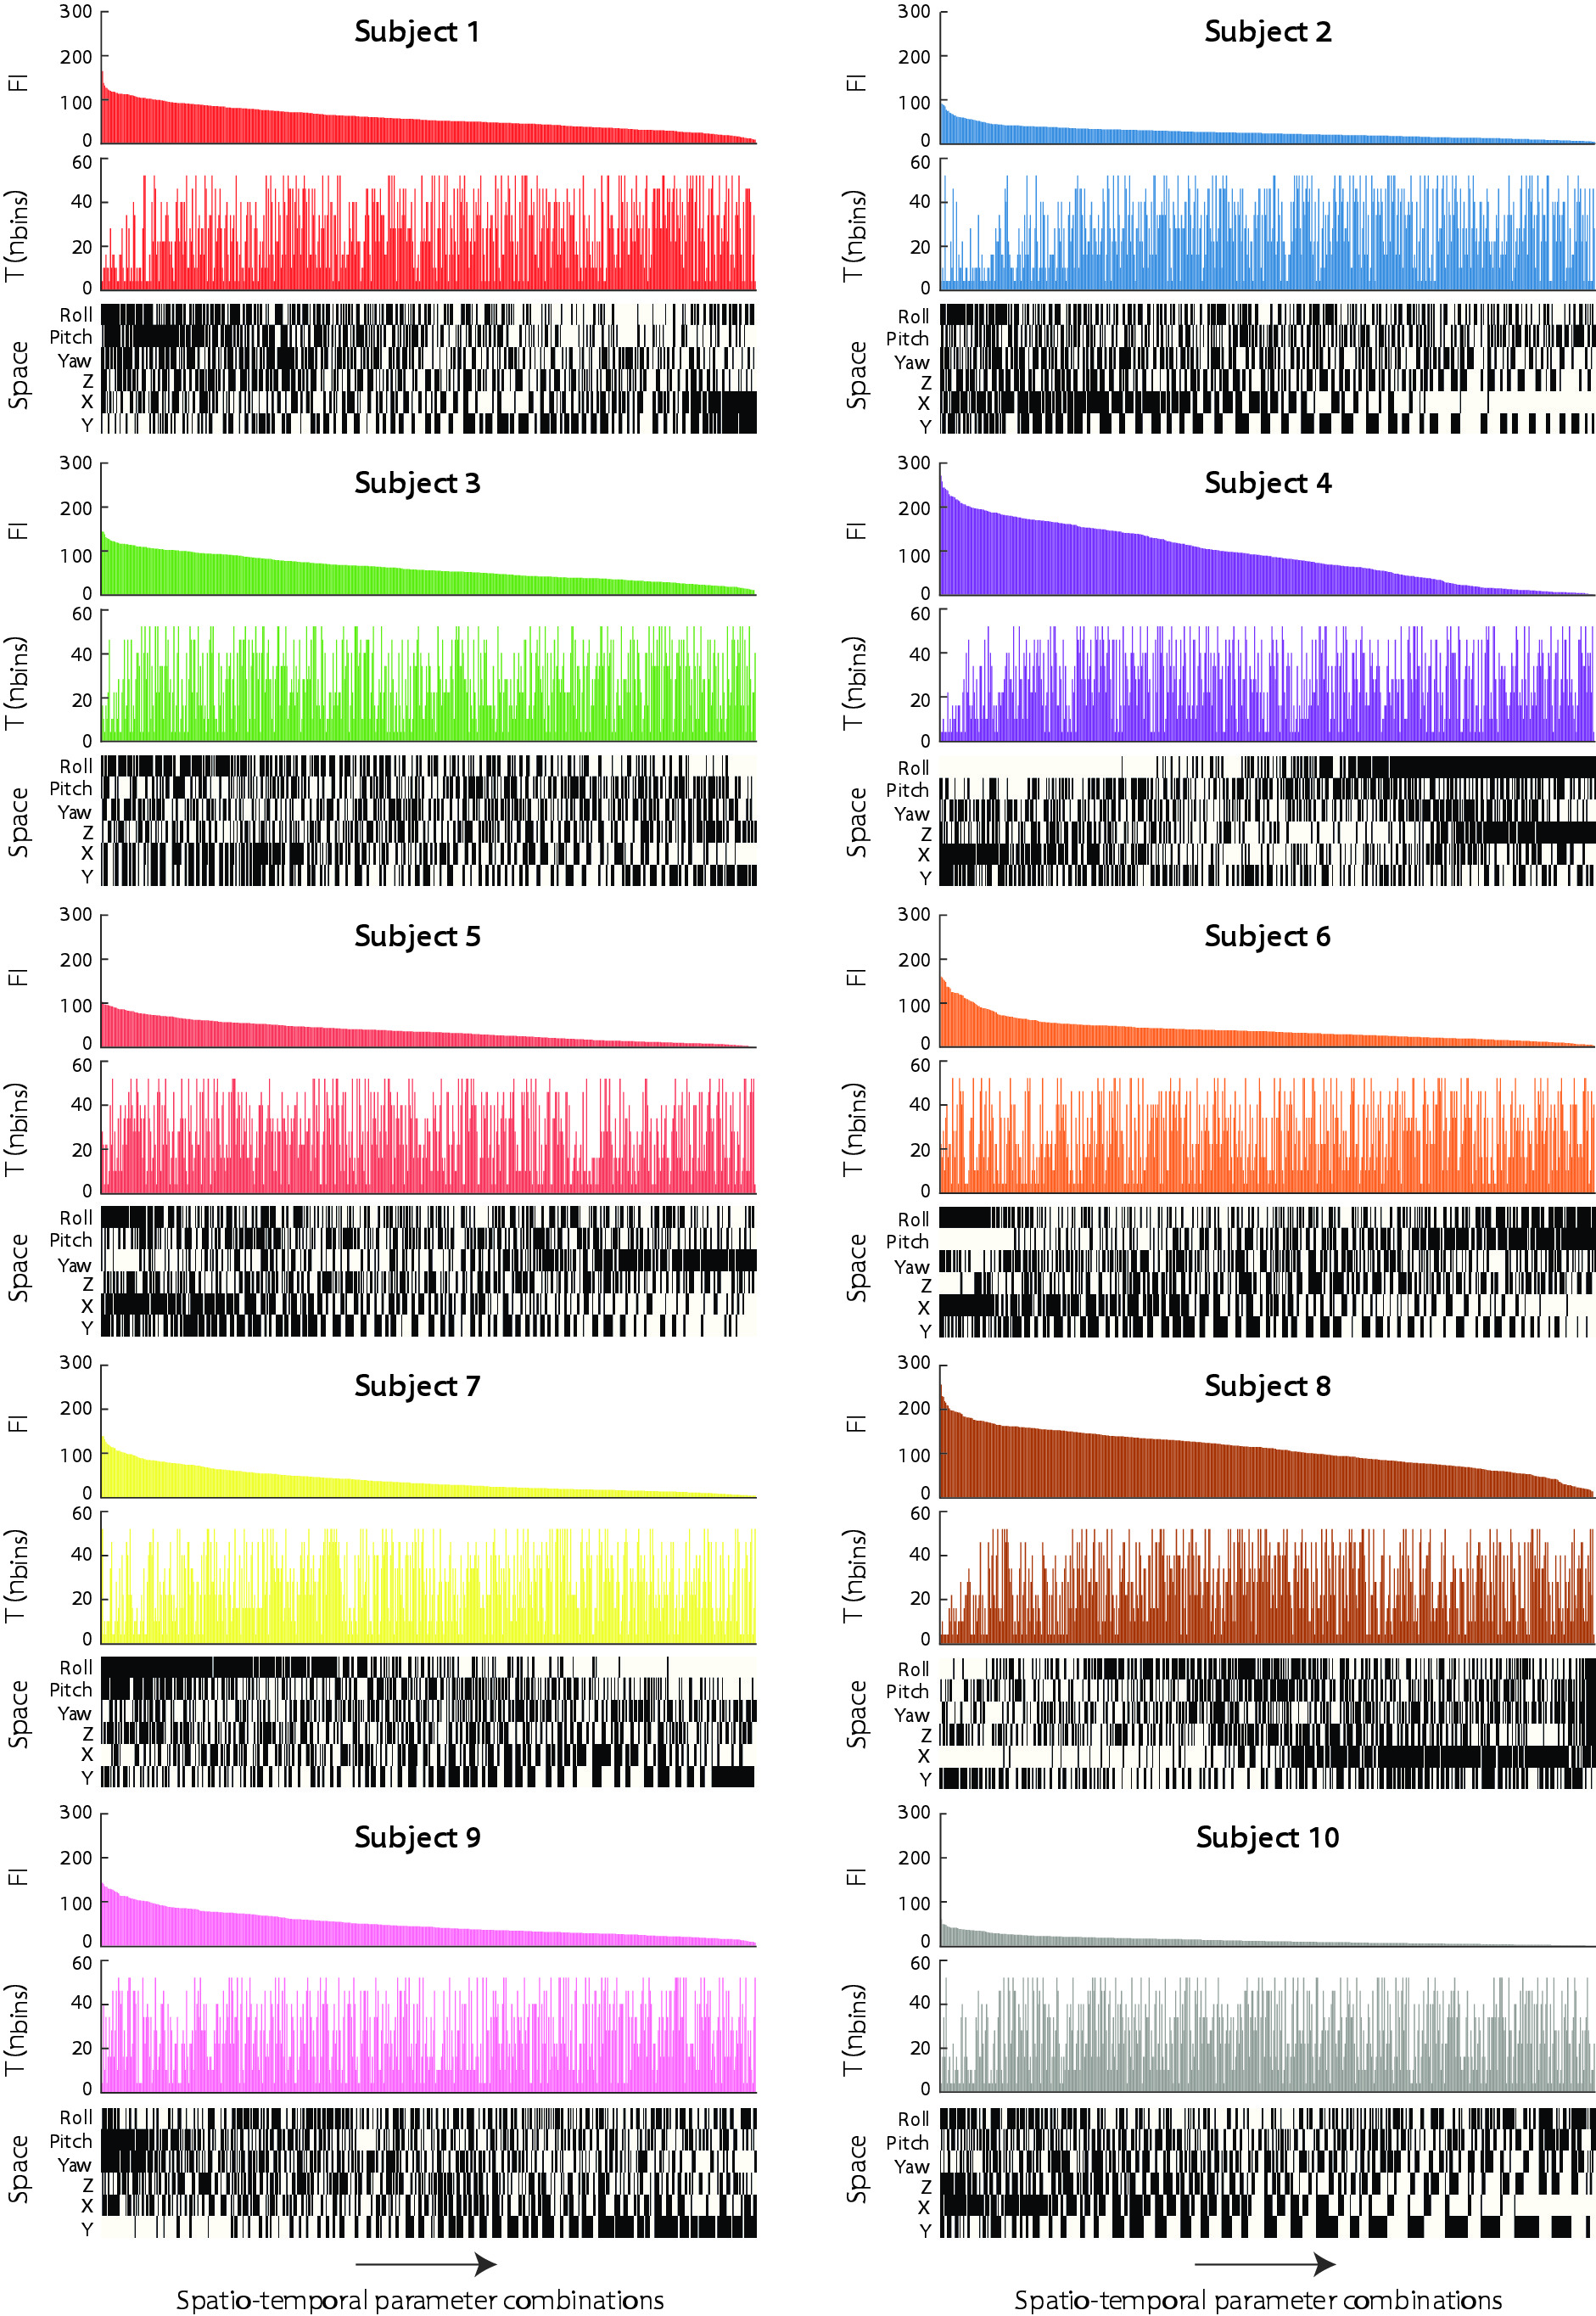
Figure 3 displays sorted FI across all 567 probed space/time feature cases, for the 10 examined subjects. Subjects 4 and 8, who were amongst the fingerprinted ones in the specific case depicted in Figure 2, are the most peculiar movers overall, with high FI across many cases. In particular, lower T values enable optimal fingerprinting. Roll motion is particularly important in fingerprinting subject 4. For subject 8, it is instead motion along the X translational direction. These observations are fully in line with the motion patterns illustrated in Figure 2D.Other subjects are less easily fingerprinted, but still show individualised motion characteristics at some spatio-temporal granularities. For example, yaw motion appears important to fingerprint subject 5, while motions along Z and the pitch rotational axis matter for subject 6. For subject 7, roll motion should not be included in the feature set for efficient fingerprinting, which indicates that this translational motion component is not specific to that subject alone. Finally, subject 10 is the least easily fingerprinted one (i.e., he consistently moves like the population average across runs).
Discussion
We have shown how, by a clustering-based methodology, subjects can be fingerprinted based on their spatio-temporal motion characteristics in RS fMRI acquisitions. The pace of changes in head motion over an acquisition, as well as the involved spatial degrees of freedom, largely differ across subjects. These results extend recent observations of ours, where we showed that these individual motion specificities arise from anthropometric and cognitive differences across subjects5.Based on these findings, composite measures of head motion, like FD, appear insufficient to capture subject-specific motion properties.
Conclusion
Across different RS runs, a given subject will tend to recurrently move in a highly specific manner over space and along time, so that he stands out from the others. This highlights the complexity of in-scanner head motion, and calls for the development of more elaborate data preprocessing strategies.Acknowledgements
No acknowledgement found.References
1. Friston K, Williams S, Howard R, et al. Movement‐related effects in fMRI time‐series. Magnetic resonance in medicine, 1996;35(3):346-355.
2. Power J, Barnes K, Snyder A, et al. Spurious but systematic correlations in functional connectivity MRI networks arise from subject motion. Neuroimage. 2012;59(3):2142-2154.
3. Andersson J, Skare S, Ashburner J. How to correct susceptibility distortions in spin-echo echo-planar images: application to diffusion tensor imaging. Neuroimage. 2003;20(2):870-888.
4. Jenkinson M, Bannister P, Brady J, Smith S. Improved Optimisation for the Robust and Accurate Linear Registration and Motion Correction of Brain Images. Neuroimage. 2002;17(2):825-841.
5. Bolton T, Zöller D, Caballero-Gaudes C, et al. Agito ergo sum: correlates of spatiotemporal motion characteristics during fMRI. ArXiv preprint. 2019;1906.06445.
Figures