3860
R2’-mapping of baseline and visual stimulus states in the human brain using streamlined-qBOLD1Radiology and Nuclear medicine, Erasmus MC, Rotterdam, Netherlands
Synopsis
Cerebral hypoxia occurs in a plethora of brain diseases, including stroke and brain tumor. This work provides a step towards a rapid, non-invasive imaging protocol for clinically feasible cerebral oxygenation mapping. In this study we use an asymmetric spin echo (ASE)-based streamlined-qBOLD (sq-BOLD) technique to non-invasively monitor hemodynamic properties of the brain in two states (baseline and activation). Our results show that, despite the low signal-to-noise ratios likely due to macroscopic magnetic field gradients (MFGs), sq-BOLD has the potential to measure changes in oxygen extraction fraction in the activated area.
Introduction
Blood oxygenation level dependent (BOLD) contrast in fMRI opened up wide opportunities to study the hemodynamic properties of the brain and has received much consideration [1]. However, BOLD-signal changes in fMRI during functional activation are relative with respect to an unknown metabolic baseline; and quantifying metabolic properties during the resting as well as activation state in the brain needs more investigation [2].In this study, we tested the sensitivity of sq-BOLD for task-related changes in tissue oxygenation in healthy, cortical gray matter tissue during different states of visual stimulation using streamlined-qBOLD (sq-BOLD )[3]. This technique is based on measuring the reversible transverse relaxation rate (R2′), from which deoxygenated blood volume (DBV) and oxygen extraction fraction (OEF) maps can be derived.
methods
Eight healthy volunteers (3 females and 5 males ; age 28±3 years old) were scanned at 3 Tesla (Discovery MR750, GE, Waukesha, USA). sq-BOLD data were acquired with: FOV=240mm2, 128x128 matrix, slice thickness 2mm and 1mm inter-slice gap, TR/TE=8s/74ms, BW=3906Hz/px, TIFLAIR=2000, ASE-sampling scheme = 0 and ᴛstart:ᴛ:ᴛfininsh = 16:4:60ms , total scan duration of 8.6 min. we collected two sets of data with and without visual stimulus (flashing checkerboard with a frequency of 8 Hz). T1-weighted images were acquired for each subject to segment the gray and white matter and CSFImage processing and analysis
We applied motion correction using MCFLIRT [4] and EPI distortion correction using TOPUP [5] for ASE dataset after registration to T1W space. Grey matter (GM) binary masks were produced using FAST [6] segmentation of the T1W image, using a GM partial volume threshold of 0.7. A visual cortex ROI was selected from the “Juelich Histological Atlas” [7], and registered to the T1W space for each subject. We used in-house Python programs to derive parameter maps of R2′, DBV and OEF from the sq-BOLD acquisition as previously detailed3. Median values of R2′, DBV and OEF were extracted for the visual cortex for each participant during baseline and stimulus.Results
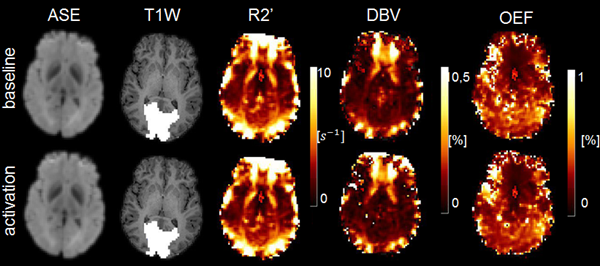
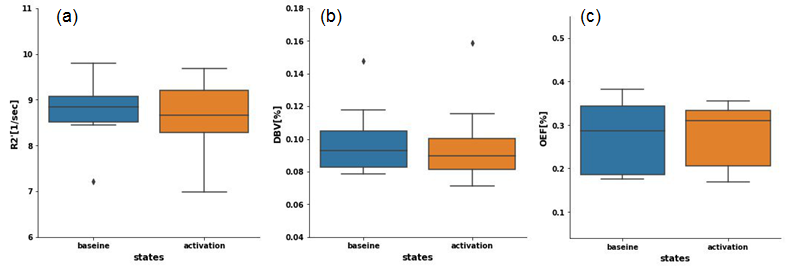
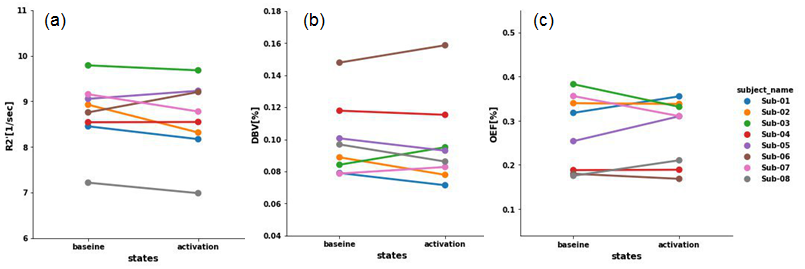
Figure 1 and 2 show sq-BOLD parameters in two different states, where limited differences between baseline and stimulus are found. The median values of R2′ and DBV across these groups were greater in baseline state compare to visual stimulus state while OEF is higher during the stimulus. Note the inconsistent changes in R2′, DBV and OEF after visual stimulation for each individual subject (Figure 3).Discussion
This study shows the feasibility of using sq-BOLD to measure R2’, DBV and OEF changes in vivo. The decrease in R2’ and DBV in the GM of visual cortex upon stimulation can be explained by the increase in oxyhemoglobin due to the overshoot in cerebral blood flow when neurons are activated [5]. Also, an increase in OEF during stimulation can be due to fact that in the activation state there is more demand for oxygen exchange compare to resting state in the activated region of the brain. However the small difference seen between activation and baseline in sq-BOLD derived maps, suggests that this stimulation is not strong enough to produce a considerable change between two states. Moreover, these measurements are more prone to motion artefacts and MFGs which cannot always sufficiently be corrected.Conclusion
Streamlined-qBOLD has demonstrated promising results for imaging brain oxygenation in healthy volunteers. Future work includes reducing scan time in order to mitigate the subject motion issue, reducing signal loss due to MFGs, and application of this measurement in patients with brain tumors.Acknowledgements
No acknowledgement found.References
[1] Ogawa S, Lee TM, Kay AR, Tank DW. (1990). Brain magnetic resonance imaging with contrast dependent on blood oxygenation. Proc Natl Acad Sci USA. 87:9868–9872
[2] Raichle ME, MacLeod AM, Snyder AZ, Powers WJ, Gusnard DA, Shulman GL. (2001). A default mode of brain function. Proc Natl Acad Sci USA. 87:9868–9872
[3] Stone, A. J., & Blockley, N. P. (2017). A streamlined acquisition for mapping baseline brain oxygenation using quantitative BOLD. NeuroImage, 147, 79– 88.
[4] Jenkinson, M., Bannister, P., Brady, J. M. and Smith, S. M. (2002). Improved Optimisation for the Robust and Accurate Linear Registration and Motion Correction of Brain Images. NeuroImage, 17(2), 825-841.
[5] J.L.R. Andersson, S. Skare, J. Ashburner. (2003). How to correct susceptibility distortions in spin-echo echo-planar images: application to diffusion tensor imaging. NeuroImage, 20(2):870-888.
[6] Zhang, Y. and Brady, M. and Smith, S. (2001). Segmentation of brain MR images through a hidden Markov random field model and the expectation-maximization algorithm. IEEE Trans Med Imag, 20(1):45-57.
[7] K. Amunts, A. Malikovic, H. Mohlberg, T. Schormann, K. Zilles. (2000). Brodmann's areas 17 and 18 brought into stereotaxic space-where and how variable. Neuroimage. 11(1): 66–84. doi: 10.1006/nimg.1999.0516.
Figures