3858
Cerebrovascular Reactivity Assessment with O2-CO2 Exchange Ratio Under Brief Breath Hold Challenge1Athinoula A. Martinos Center for Biomedical Imaging, Massachusetts General Hospital, Boston, MA, United States, 2Biogen Inc., Cambridge, MA, United States, 3Biomedical Engineering, Hong Kong Polytechnic University, Kowloon, Hong Kong
Synopsis
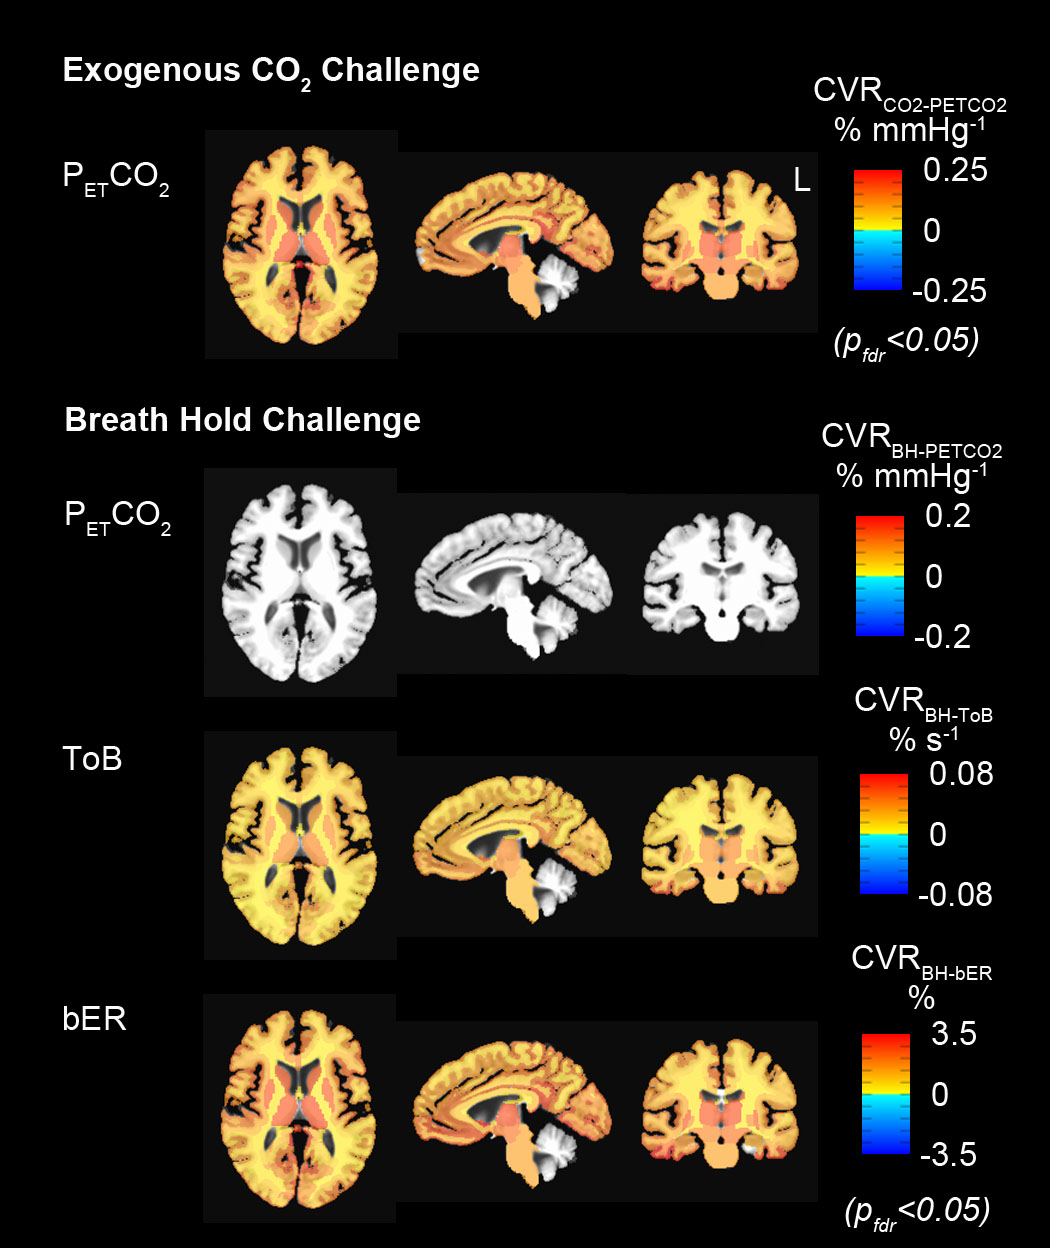
Here we tested the hypothesis that the cerebrovascular responses to brief breath hold epochs were coupled not only with increased partial pressure of carbon dioxide (PCO2), but also with decreased partial pressure of oxygen (PO2). fMRI map of cerebrovascular reactivity (CVR) to breath-by-breath O2-CO2 exchange ratio covers similar regions as map of CVR to exogenous CO2 challenge. Substantially fewer regions in fMRI map of CVR to endogenous end-tidal CO2 satisfied statistical significance. Our results support the hypothesis that hypoxia and hypercapnia work synergistically to enhance cerebrovascular responses to breath hold.
Introduction
Hypercapnia during breath holding is believed to be the dominant driver behind the modulation of cerebral blood flow (CBF). Instead of being considered only as a hypercapnic challenge, breath hold can also be recognized as a form of brief hypoxia with concurrent mild hypercapnia.1-3 We hypothesized that hypoxia and hypercapnia work synergistically to enhance CBF response to breath hold. Here we showed that the cerebrovascular responses to brief breath hold epochs were coupled not only with increased partial pressure of carbon dioxide (PCO2), but also with a decrease in partial pressure of oxygen (PO2). In spontaneous breathing, blood gas levels of O2 and CO2 are optimized by the feedback control of ventilation via chemoreflexes4 to regulate blood flow and O2 delivery to the brain as part of a vital homeostatic process.5 The same process from chemosensing to CBF change is assumed to take place during breath hold as well. Increasing evidence showed that mild hypercapnia could increase the sensitivity of the CBF response to a very mild level of hypoxia and the ranges of mild PO2 and PCO2 changes reported are achievable by breath hold. We therefore examined breath hold in the framework of hemodynamic responses to mild hypoxia together with hypercapnia in humans.Subjects and Methods
Participants: Ten healthy volunteers aged 22-48 years participated in both breath hold and exogenous CO2 MRI. Methods: MRI was performed at 3-Tesla (Siemens Medical Germany) in Athinoula A. Martinos Center at Massachusetts General Hospital. Experimental procedures were explained to the subjects, and signed informed consent was obtained prior to participation in the study. Whole brain MRI datasets were acquired for each subject: 1) T1-weighted 3D-MEMPRAGE; 2) BOLD-fMRI images (TR=1450ms, TE=30ms) acquired when the subjects were under breath hold challenge or under exogenous CO2 challenge. The breath hold paradigm consisted of 2 consecutive phases (resting and breath holding) repeated 6 times. The resting phase lasted no less than 60 seconds, while the breath holding phase lasted 30 seconds. The challenge lasted 10 minutes. During the exogenous CO2 challenge, subject wore nose-clip and breathed through a mouth-piece on a MRI-compatible circuit designed to maintain the PETCO2 within ± 1-2 mmHg of target PETCO2.6,7 The CO2 challenge paradigm consisted of 2 consecutive phases (normocapnia and mild hypercapnia) repeating 6 times with 3 epochs of 4 mmHg increase and 3 epochs of 8 mmHg increase of PETCO2 above the subject’s resting PETCO2. The normocapnia phase lasted 60-90 seconds, while the mild hypercapnia phase lasted 30 seconds. The total duration of the exogenous CO2 hypercapnic challenge lasted 10 minutes. Physiological changes including PCO2, PO2 and respiration were measured by calibrated gas analyzers and respiratory bellow simultaneously with MRI acquisition. Data analysis: BOLD-fMRI data were imported into the software AFNI8 for correction and normalization. Time series of bER during breath hold challenge was derived as the ratio of the change in PO2 (ΔPO2 = inspired PO2 – expired PO2) to the change in PCO2 (ΔPCO2 = expired PCO2 – inspired PCO2) measured between end inspiration and end expiration. CVR values were derived from regressing ∆BOLD on bER (CVRBH-bER), PETCO2 (CVRBH-PETCO2) and ToB (CVRBH-ToB) when the subjects were under breath hold challenge. CVR values during exogenous CO2 challenge were obtained by regressing ∆BOLD on PETCO2 (CVRCO2-PETCO2). Region-of-interest (ROI) analyses were applied to the CVR values in 160 brain regions parcellated by the software FreeSurfer.9 To study the CVR changes in group, one-sample t-tests were used onto the brain volumes with regional CVRBH-bER, CVRBH-PETCO2, CVRBH-ToB and CVRCO2-PETCO2. Differences were considered significant at false discovery rate adjusted pfdr<0.05.Results
Under exogenous CO2 challenge, most of the brain regions showed increased CVRCO2-PETCO2 in the subject group especially at the thalamus, insula and putamen (Fig1). For the same group of subjects under breath hold challenge, increased CVRBH-bER and CVRBH-ToB were found in most of the brain regions, while no significant changes of CVRBH-PETCO2 were shown in most brain regions.Discussion
The interaction between ΔPO2 and ΔPCO2 during breath holding is mainly resulting from the systemic metabolic process and different from the effect of exogenous gas administration which is primarily indicated by an increase in ΔPCO2. During breath holding, changes in systemic PO2 and PCO2 may trigger mechanisms which involve the interaction of central and peripheral respiratory chemoreceptors as well as the autonomic system to regulate CBF. bER being better for characterizing dynamic BOLD signal changes under breath hold challenge is closely related to the fact that bER is a ratio which factors out effects of ventilatory volume fluctuations10 common to both ΔPO2 and ΔPCO2. ToB yielded superior correlation result than ΔPCO2 because ToB indirectly takes into account the duration for both hypoxemia and hypercapnia without being affected by the depth of breathing.Conclusion
We showed the combined effect of both hypoxia and hypercapnia on cerebral hemodynamic responses measured using BOLD-fMRI. Our findings provide a novel insight on using bER to better quantify CVR changes under breath hold challenge, although the physiological mechanisms of cerebrovascular changes underlying breath hold and exogenous CO2 challenges are potentially different.Acknowledgements
This research was carried out in whole at the Athinoula A. Martinos Center for Biomedical Imaging at the Massachusetts General Hospital, using resources provided by the Center for Functional Neuroimaging Technologies, P41EB015896, a P41 Biotechnology Resource Grant supported by the National Institute of Biomedical Imaging and Bioengineering (NIBIB), National Institutes of Health, as well as the Shared Instrumentation Grant S10RR023043. This work was also supported, in part, by NIH-K23MH086619.References
1. Bain AR, Ainslie PN, Barak OF, et al. Hypercapnia is essential to reduce the cerebral oxidative metabolism during extreme apnea in humans. J Cereb Blood Flow Metab 2017;37:3231-3242.
2. Parkes MJ. Breath-holding and its breakpoint. Exp Physiol 2006;91:1-15.
3. Gooden BA. Mechanism of the human diving response. Integr Physiol Behav Sci 1994;29:6-16.
4. Van den Aardweg JG, Karemaker JM. Influence of chemoreflexes on respiratory variability in healthy subjects. American journal of respiratory and critical care medicine 2002;165:1041-1047.
5. Kumar P, Prabhakar NR. Peripheral chemoreceptors: function and plasticity of the carotid body. Compr Physiol 2012;2:141-219.
6. Banzett RB, Garcia RT, Moosavi SH. Simple contrivance "clamps" end-tidal PCO(2) and PO(2) despite rapid changes in ventilation. J Appl Physiol 2000;88:1597-1600.
7. McKay LC, Evans KC, Frackowiak RS, Corfield DR. Neural correlates of voluntary breathing in humans. J Appl Physiol 2003;95:1170-1178.
8. Cox RW. AFNI: software for analysis and visualization of functional magnetic resonance neuroimages. Computers and Biomedical Research 1996;29:162-173.
9. Fischl B, Sereno MI, Dale AM. Cortical surface-based analysis. II: Inflation, flattening, and a surface-based coordinate system. Neuroimage 1999;9:195-207.
10. Ferretti G. Energetics of Muscular Exercise. Switzerland: Springer International Publishing, 2015.
Figures