3857
Dynamic Brain-Body Coupling of Breath-by-Breath O2-CO2 Exchange Ratio with Resting State Cerebral Hemodynamic Fluctuations1Athinoula A. Martinos Center for Biomedical Imaging, Massachusetts General Hospital, Boston, MA, United States, 2Biogen Inc., Cambridge, MA, United States, 3Biomedical Engineering, Hong Kong Polytechnic University, Kowloon, Hong Kong
Synopsis
We showed that the oscillations of breath-by-breath O2-CO2 exchange ratio (bER) were superior to those of end-tidal CO2 in correlating with the low frequencies (0.008-0.03Hz) of resting state cerebral hemodynamic fluctuations (CHF). Brain regions showing significant association of ΔBOLD with bER overlapped with many regions of default mode network. Transcranial Doppler sonography and fMRI were used to measure CHF and time series of partial pressure of O2 and CO2 were collected. bER-CHF coupling is a novel metric to measure brain-body interaction that may provide some answers to the physiological contributions to low frequencies of CHF.
Introduction
The origin of low frequency cerebral hemodynamic fluctuations (CHF) in resting state remains unknown. Here we studied the contribution of respiratory gas exchange (RGE) metrics during spontaneous breathing at rest to the low frequencies of CHF. RGE metrics include the breath-by-breath changes of partial pressure of oxygen (ΔPO2) and carbon dioxide (ΔPCO2) between end inspiration and end expiration, and their ratio breath-by-breath O2-CO2 exchange ratio (bER). We used transcranial Doppler sonography (TCD) to evaluate CHF changes during spontaneous breathing by measuring the cerebral blood flow velocity (CBFv) in the middle cerebral arteries (MCA). TCD has an advantage of acquiring data at high temporal resolution (~100 Hz) without much concern on high frequency cerebrovascular signal being aliased into the low frequency range. The regional CHF changes during spontaneous breathing were mapped with blood oxygenation level dependent (BOLD) signal changes using functional magnetic resonance imaging (fMRI) technique.Subjects and Methods
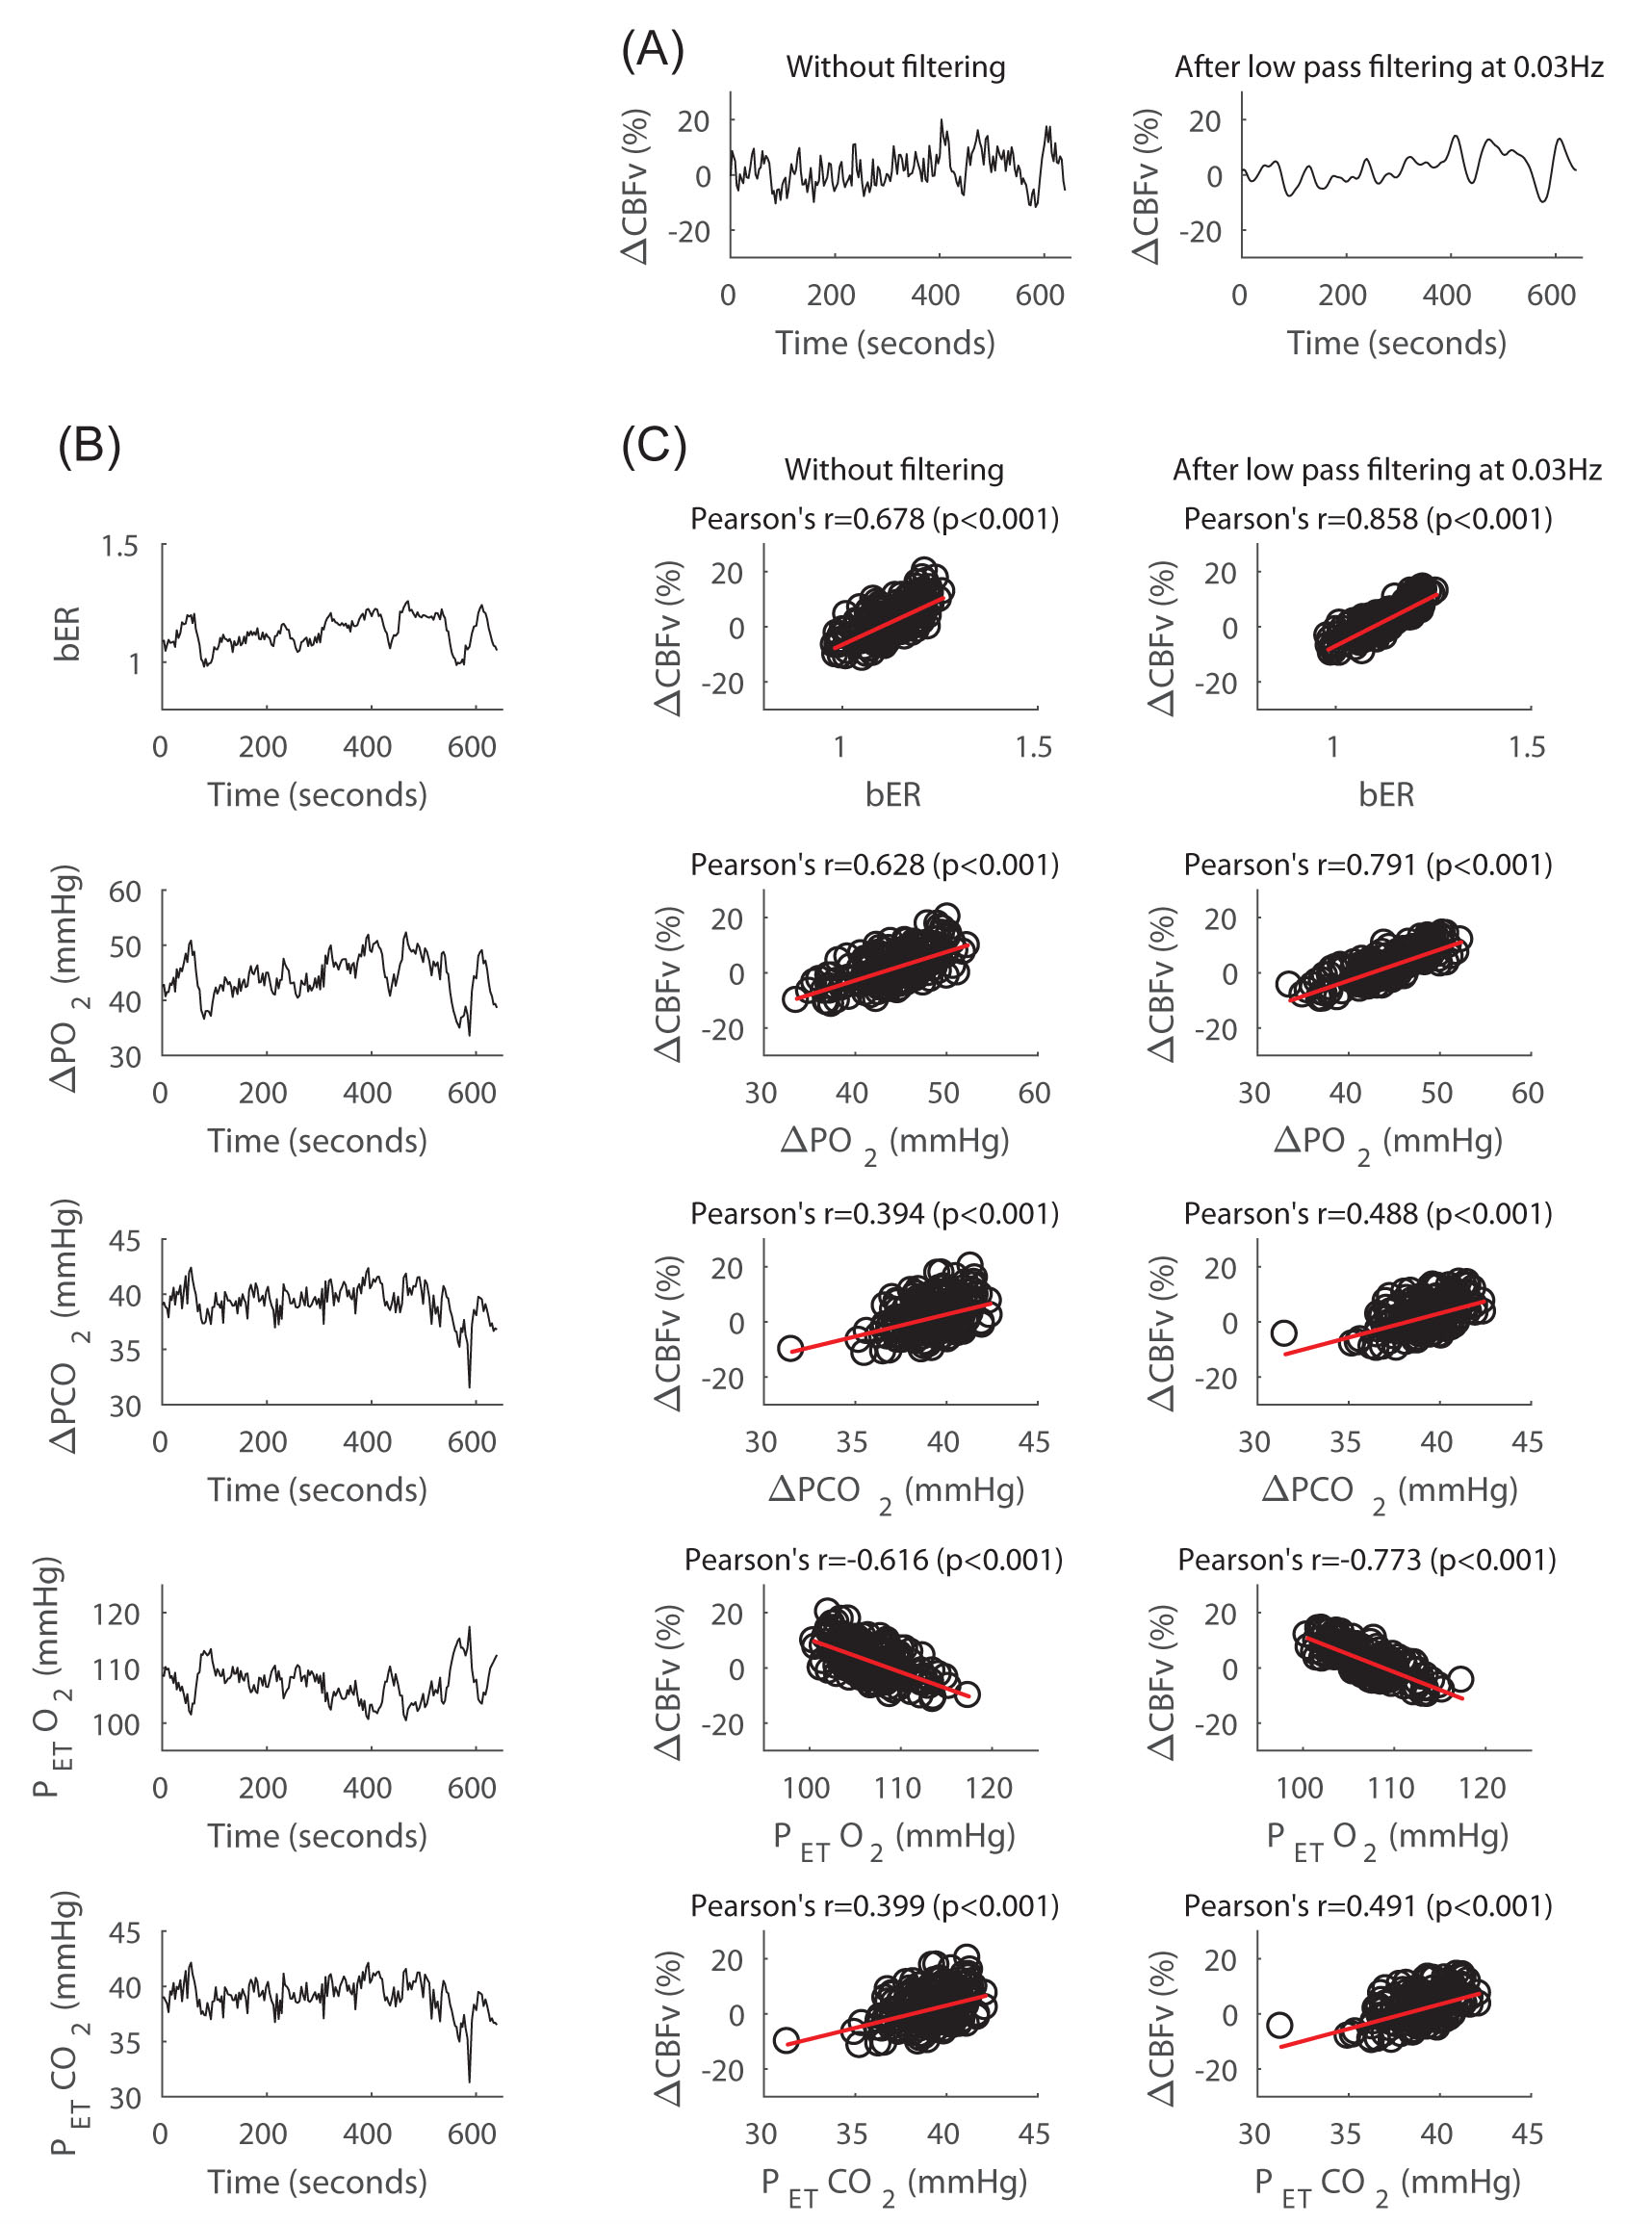
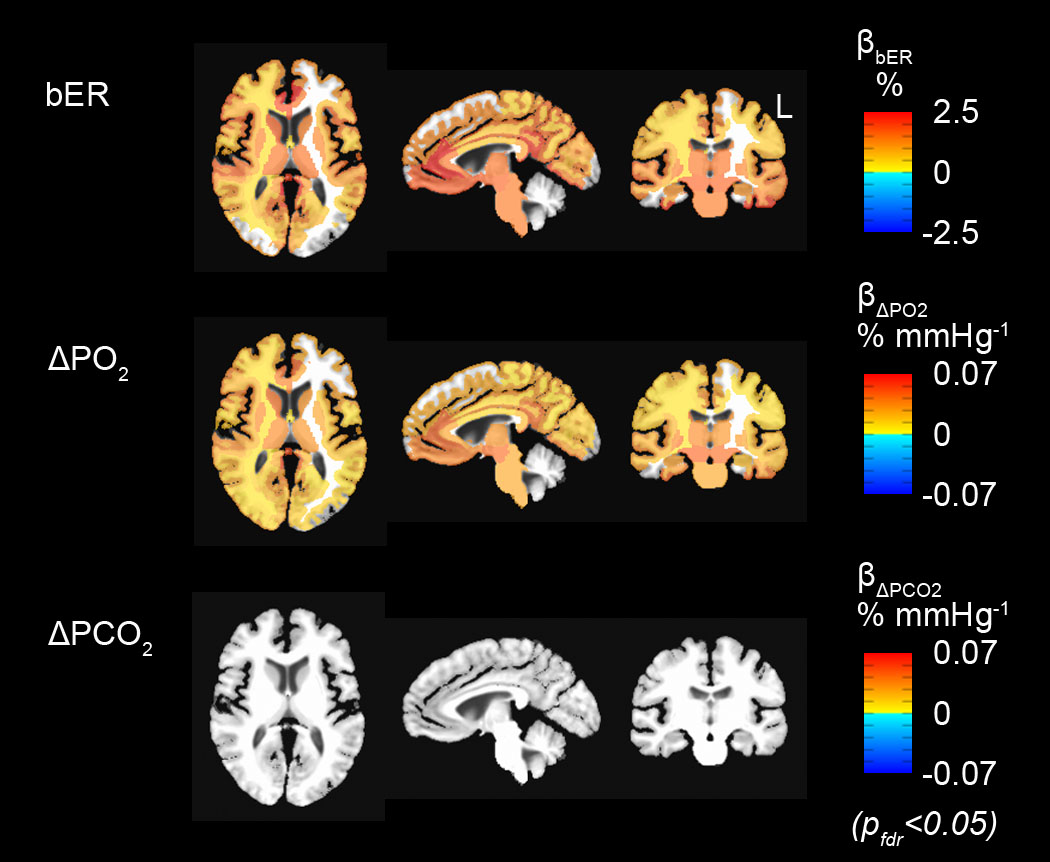
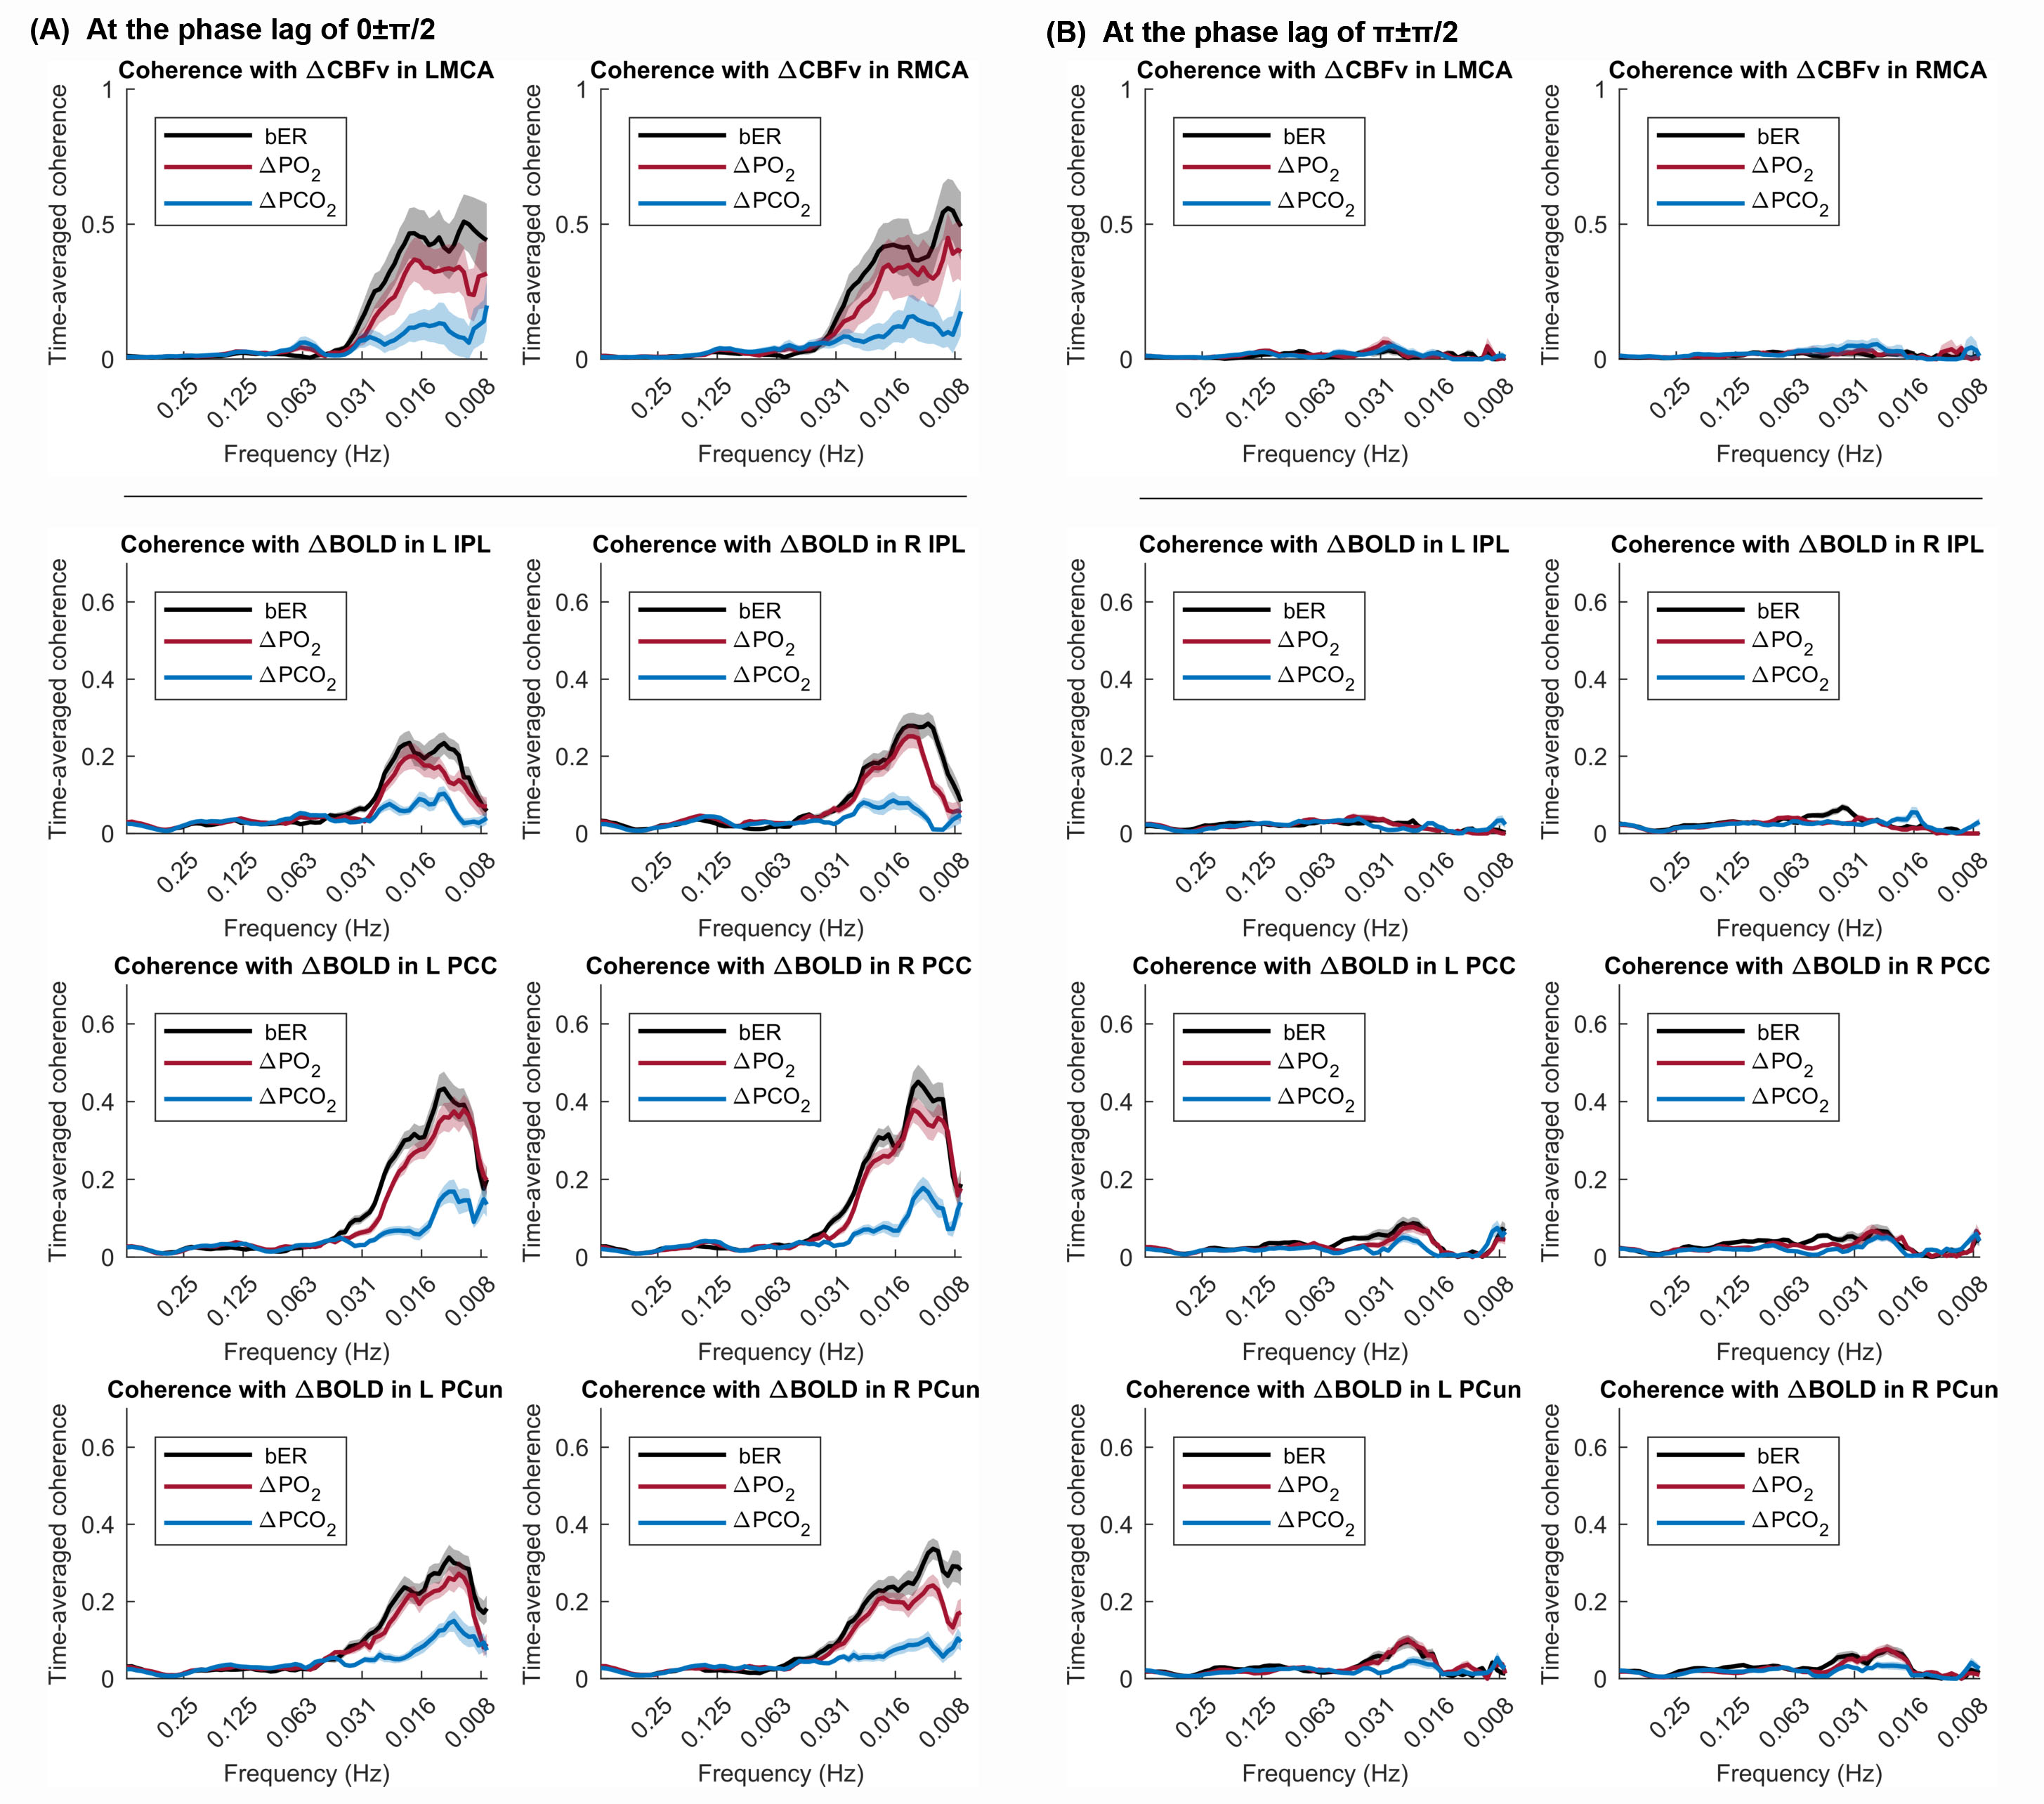
Participants: A total of 22 volunteers aged from 19 to 48 years were included in this study. Eleven of them participated in both TCD and MRI sessions, while the remaining participated in either one of the sessions (TCD sessions, n=13; MRI sessions, n=20). They were screened to exclude neurological, mental disorders and drug abuse. Methods: TCD and MRI scanning were performed in the Athinoula A. Martinos Center for Biomedical Imaging at Massachusetts General Hospital. All the experimental procedures were explained to the subjects, and signed informed consent was obtained prior to participation in the study. In the TCD sessions. TCD system (Delicate EMS-9U, Shenzhen, China) with 2MHz transducers were used for simultaneous recording of CBFv in the MCA on both left and right sides when the subject was at rest in seated position. The total duration of the CBFv data acquisition lasted 10 minutes. In the MRI sessions, whole brain MRI datasets were acquired on a 3-Tesla scanner (Siemens Medical Germany) for each subject: 1) T1-weighted 3D-MEMPRAGE; 2) BOLD-fMRI images (TR=1450ms, TE=30ms) acquired when the subject was at rest. The total duration of the BOLD data acquisition lasted 10 minutes. Physiological changes including PCO2, PO2 and respiration were measured by calibrated gas analyzers simultaneously with MRI acquisition. Data analysis: Time series of bER was derived as the ratio of ΔPO2 (i.e. inspired PO2 – expired PO2) to ΔPCO2 (i.e. expired PCO2 – inspired PCO2) measured between end inspiration and end expiration in each respiratory cycle. Percent change of CBFv (∆CBFv) were correlated separately with RGE metrics (bER, ∆PCO2 and ∆PO2). BOLD-fMRI data were imported into the software AFNI1 for time-shift correction, motion correction, normalization and detrending. Linear regression analyses were used to evaluate the association of percent change of BOLD signals (∆BOLD) with each RGE metric for each subject. Regression coefficient beta (β) value was defined as the percent BOLD signal changes per unit change of a RGE metric. Region-of-interest (ROI) analyses were applied to the β values in 160 brain regions parcellated by the software FreeSurfer.2 To study the association between ∆BOLD and RGE metrics in group, one-sample t-tests were used onto the brain volumes with regional βbER, β∆PO2 and β∆PCO2. Differences were considered significant at false discovery rate adjusted pfdr<0.05. Wavelet transform coherence analysis was used to examine the dynamic interaction between RGE metrics and CHF (∆CBFv and ∆BOLD).Results
Prominent oscillations with periods of 0.5 to 2 minutes characterized ΔPO2, ΔPCO2 and bER, and the time series of ΔPO2 and ΔPCO2 were not redundant. In both TCD (Fig1) and MRI (Fig2) sessions, the correlation of bER with CHF was the strongest among all the RGE metrics. ∆PO2 followed relatively closely behind bER, and ∆PCO2 was the weakest in correlation with CHF. Brain regions showing significant association of DBOLD with bER and ∆PO2 including precuneus, posterior cingulate, anterior insula, caudate nucleus, superior temporal and inferior parietal regions overlapped with those in default mode network.3 At the phase lag of 0±π/2, the mean time-averaged coherence between bER and CHF and that between ΔPO2 and CHF reached a value of 0.5 or above in the frequency range of 0.008-0.03Hz, while the mean time-averaged coherence between ΔPCO2 and CHF stayed below 0.2 (Fig3).Discussion
While the physiological mechanisms underlying the strong correlation between bER and CHF (∆CBFv and ∆BOLD) are not completely understood, bER and ΔPO2 was found to be superior to ΔPCO2 in mapping the association between RGE metrics and CHF. The superiority of bER over ΔPCO2 in correlating with CHF is likely to be attributed partly to the ratio format of bER enabling a reduction of ventilatory fluctuations and partly to the physiological role of bER which takes into account the interdependence between ΔPO2 and ΔPCO2. The CHF coherence with RGE metrics at the low frequency range of 0.008-0.03Hz may be associated with low frequency physiological processes in the brain.Conclusion
Our findings provide evidence of brain-body interaction that fluctuations of RGE metrics are associated with resting state CHF at low frequency range of 0.008-0.03Hz, with bER being the superior RGE metric, followed by ΔPO2 and then by ΔPCO2. Imaging of bER-CHF coupling may open up opportunities for potential clinical diagnosis and monitoring the progress of treatment that involve brain-body interaction.Acknowledgements
This research was carried out in whole at the Athinoula A. Martinos Center for Biomedical Imaging at the Massachusetts General Hospital, using resources provided by the Center for Functional Neuroimaging Technologies, P41EB015896, a P41 Biotechnology Resource Grant supported by the National Institute of Biomedical Imaging and Bioengineering (NIBIB), National Institutes of Health, as well as the Shared Instrumentation Grant S10RR023043. This work was also supported, in part, by NIH-K23MH086619.References
1. Cox RW. AFNI: software for analysis and visualization of functional magnetic resonance neuroimages. Computers and Biomedical Research 1996;29:162-173.
2. Fischl B, Sereno MI, Dale AM. Cortical surface-based analysis. II: Inflation, flattening, and a surface-based coordinate system. Neuroimage 1999;9:195-207.
3. Raichle ME, MacLeod AM, Snyder AZ, Powers WJ, Gusnard DA, Shulman GL. A default mode of brain function. Proceedings of the National Academy of Sciences of the United States of America 2001;98:676-682.
Figures