3855
Assessment of longitudinal cerebrovascular reactivity measurements based on breath-hold and resting state BOLD multi-echo fMRI1Basque Center on Cognition Brain and Language, San Sebastián, Spain, 2Physical Therapy and Human Movement Sciences, Feinberg School of Medicine, Northwestern University, Chicago, IL, United States, 3Biomedical Engineering, McCormick School of Engineering, Northwestern University, Evanston, IL, United States
Synopsis
Cerebrovascular reactivity (CVR) is an important measure of vascular function, but true variability in CVR can be masked by numerous confounds. We explore the variability of CVR maps, extracted using breath-holding and resting state data, over 9 weekly scanning sessions. Our results show that CVR demonstrates robust spatial patterns that vary across known neural networks.
Introduction
Cerebrovascular reactivity (CVR) measures the vasculature’s responsiveness to a vasoactive stimulus such as CO2. It can be readily mapped using fMRI during breathing challenges, such as breath-holding (BH), which transiently modulate CO2 levels and drive a vasodilatory response. Although BH is non-invasive, highly tolerable, and relatively easy to implement, BH-derived CVR maps can be confounded by task-correlated movement, large vessel signals, and variability in task performance. This makes it challenging to explore true variability in the CVR response, both across grey matter and across timepoints. To our knowledge, no previous work has evaluated the variability of CVR estimates across beyond two scanning sessions.Alternatively, resting state fMRI data can be used to estimate CVR1,2 with reduced concern over the aforementioned confounds. However, these surrogate metrics may not map identical vascular parameters, and may not reflect the same underlying brain physiology. In this study, we present the first longitudinal study comparing BH and RS CVR maps over 9 sessions, spaced one week apart, using multi-echo acquisition to minimize noise artifacts and increase BOLD sensitivity. We assess the variability in these CVR estimates over time, and compare patterns in CVR across grey matter with known spatial patterns of functional neural networks.
Methods
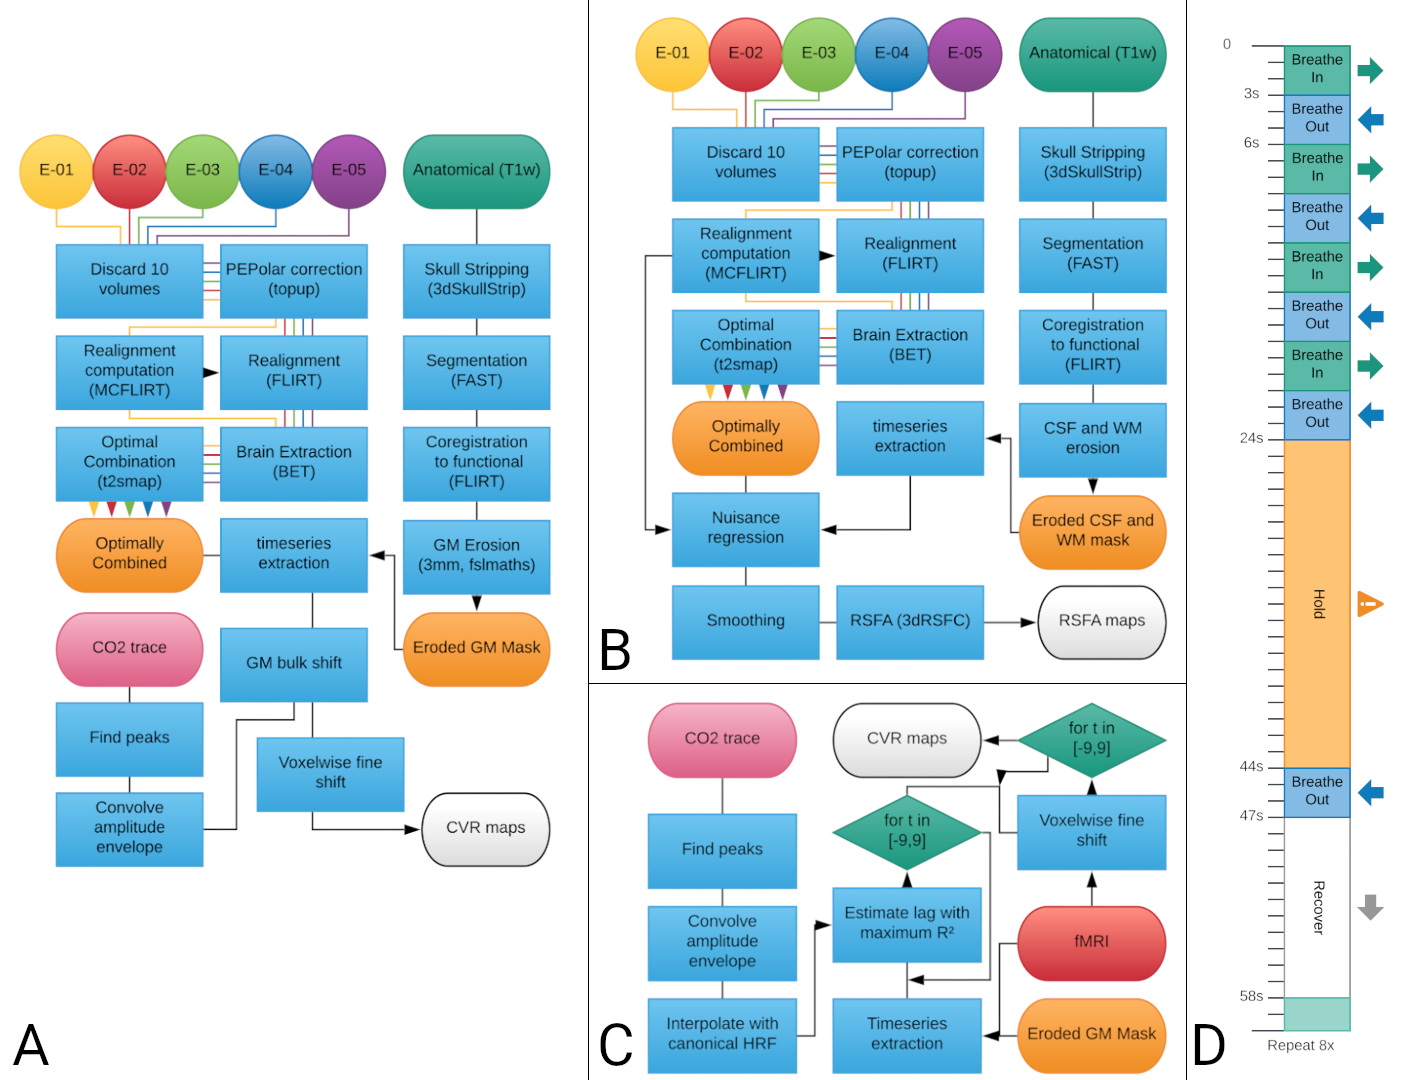
Three healthy subjects underwent nine imaging sessions in a 3T Siemens PrismaFit scanner, spaced 1-week apart at the same time of day. Multi-echo fMRI data (TR=1.5 s, TEs=10.6/28.69/46.78/64.87/82.96 ms, flip angle=70°, Multi-Band=4, GRAPPA=2, 52 slices, Partial-Fourier=6/8, FoV read=211x211 mm2, voxel size = 2.4x2.4x3 mm3) were acquired while subjects remained at rest (i.e. resting-state, 400 scans) while fixating their eyes in a white cross shown in the center of a back-projected screen, and also during a BH paradigm3 (Figure 1D, 340 scans). Expired CO2 levels were measured throughout the session using a nasal cannula with an ADInstruments ML206 gas analyser connected to a BIOPAC MP150 system. A T1-w MP2RAGE image was also collected (176 slices, FoV read = 256 mm, voxel size = 1x1x1 mm3). BH fMRI and RS fMRI preprocessing pipelines are described in Figure 1A and Figure 1B, respectively.CVR maps from the BH task (CVRBH) were obtained from the multi-echo optimally combined data by (1) interpolating the amplitude envelope of the end-tidal CO2 traces with a canonical HRF (PetCO2 trace), (2) finding the lag that maximised correlation between average grey matter signal and the trace (optimal shift), (3) running a GLM with the PetCO2 trace shifted in time with steps of 0.25 s, up to ±9 s around the optimal shift, and (4) selecting the highest beta score from the shifted versions of the GLM for each voxel (fine shift) (Figure 1C). The maps were then rescaled to indicate value of %BOLD/mmHg based on the PetCO2 traces3,4. CVR maps based on resting-state fluctuation amplitude (CVRRSFA) were computed using AFNI’s 3dRSFC5.
Within each subject and for each session, both CVR maps were co-registered to the first session, and then masked by both statistical significance (p<0.01, two-tailed) and physiological plausibility (absolute temporal shift <= 8.75 s) of the CO2 model fit across all the sessions. Then, the average value of both metrics was computed, together with their Coefficient of Variation (CoV).
The average values of CVRBH and CVRRSFA were also computed within the voxels of 10 functional networks identified based on previous templates of functional resting state networks6 (thresholded at z-score > 2.7), which were registered to the subject’s functional space.
Results and discussion
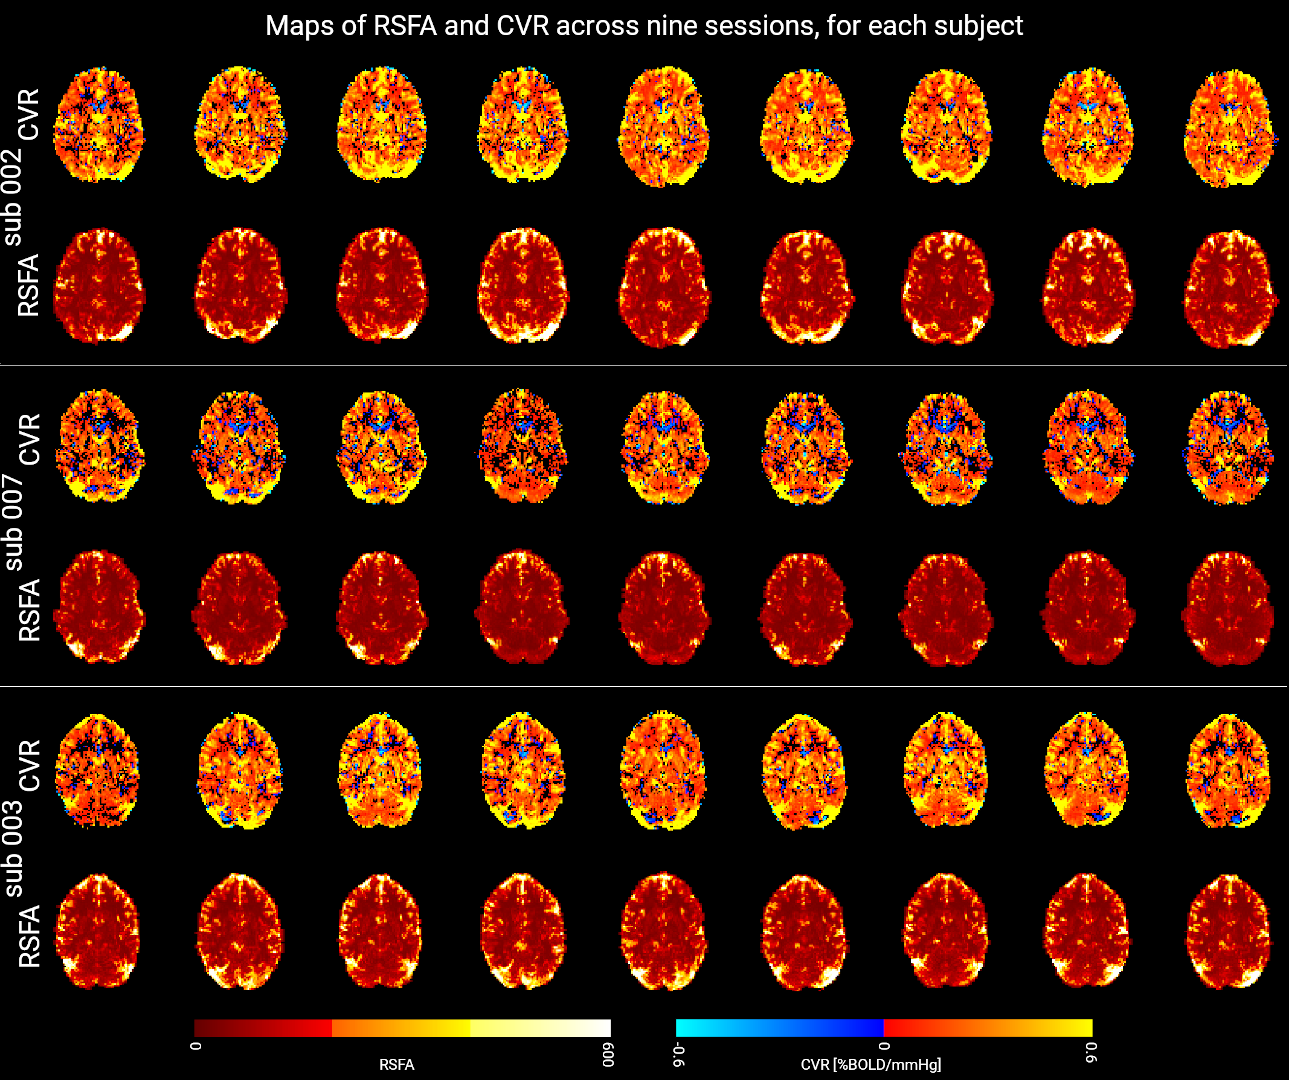
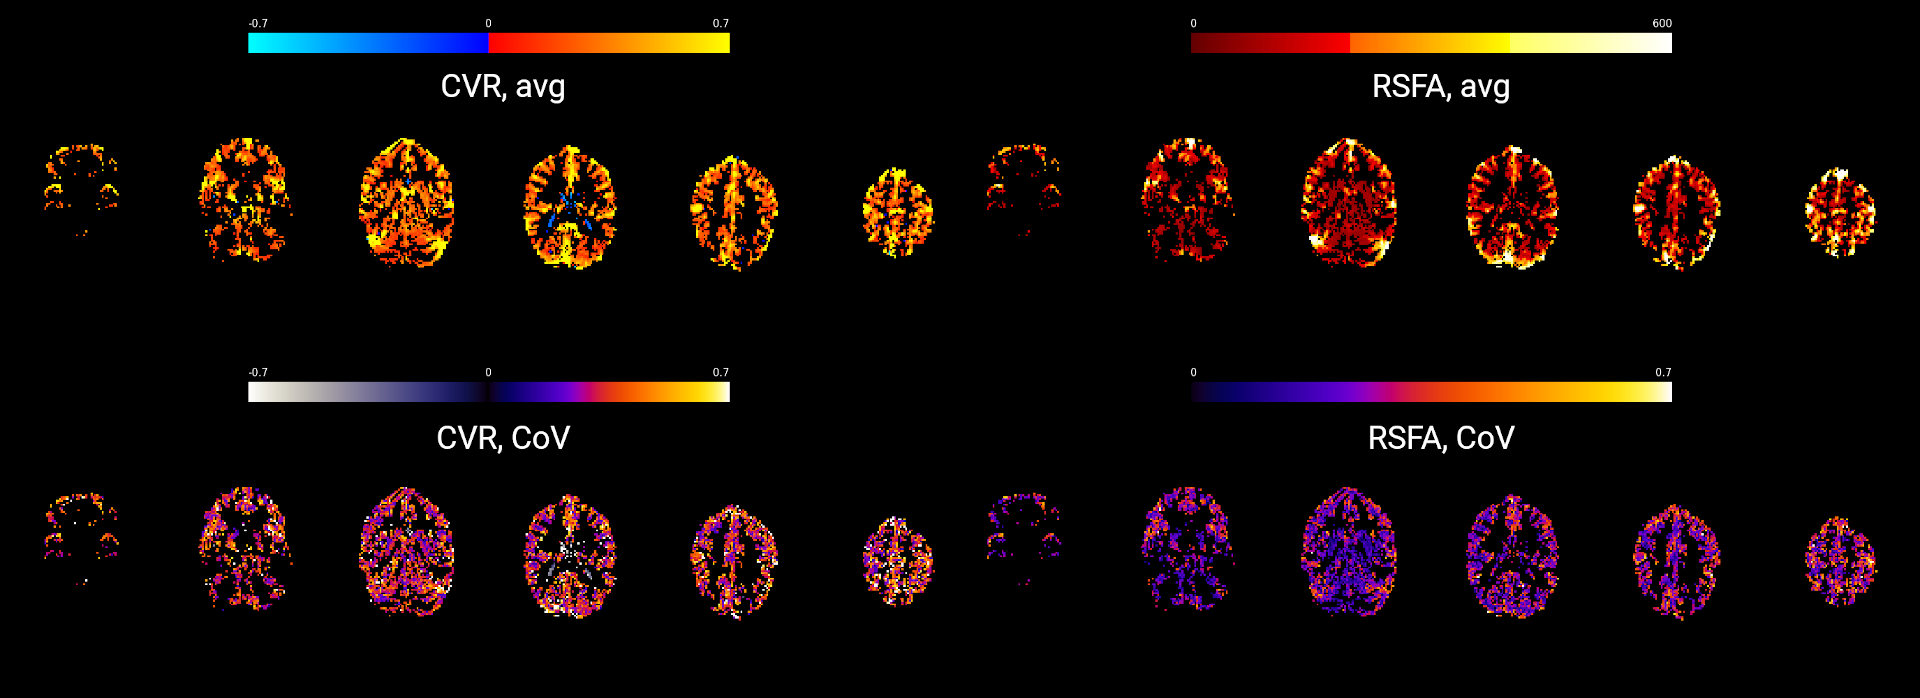
Figure 2 shows a representative slice of the CVRBH and the CVRRSFA maps for each session and each subject. Both CVRBH and CVRRSFA maps depict spatially homogeneous patterns of CVR in grey matter voxels, particularly in the cortex, as well as around large vessels which might indicate a bias introduced by macrovasculature in the two measurements. Importantly, the CVRBH maps allow to reveal stable spatial patterns with proper CVR in areas of physiologically plausible negative CVR responses around the edges of the ventricles, which might be associated with CVR-related changes in flow and cannot be revealed by the RSFA approach.Figure 3 shows the maps of average CVRBH and CVRRSFA, as well as their CoV, across the nine sessions, for a representative subject. While cortical grey matter shows higher values of average CVRBH and CVRRSFA and cerebellum shows lower intensities in both measures, subcortical structures show high average CVRBH responses but low CVRRSFA. This difference in subcortical areas is reflected also in the CoV maps.
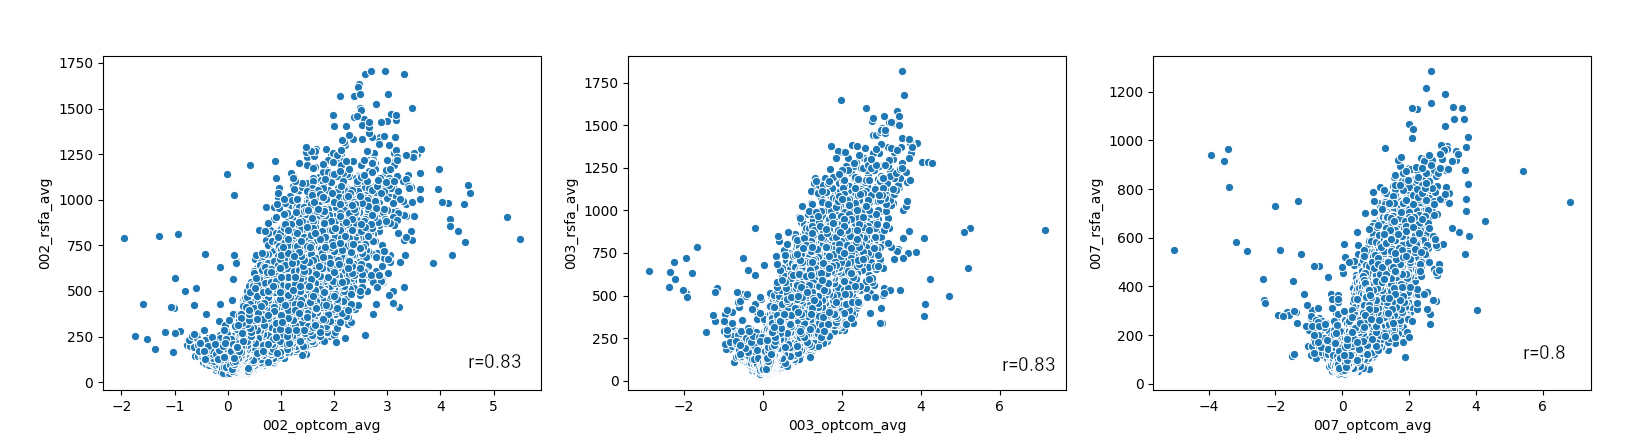
Figure 4 shows the spatial relationship between average CVRBH and CVRRSFA and between their CoV, for each subject. The spatial distribution of positive average CVRBH is common to CVRRSFA.
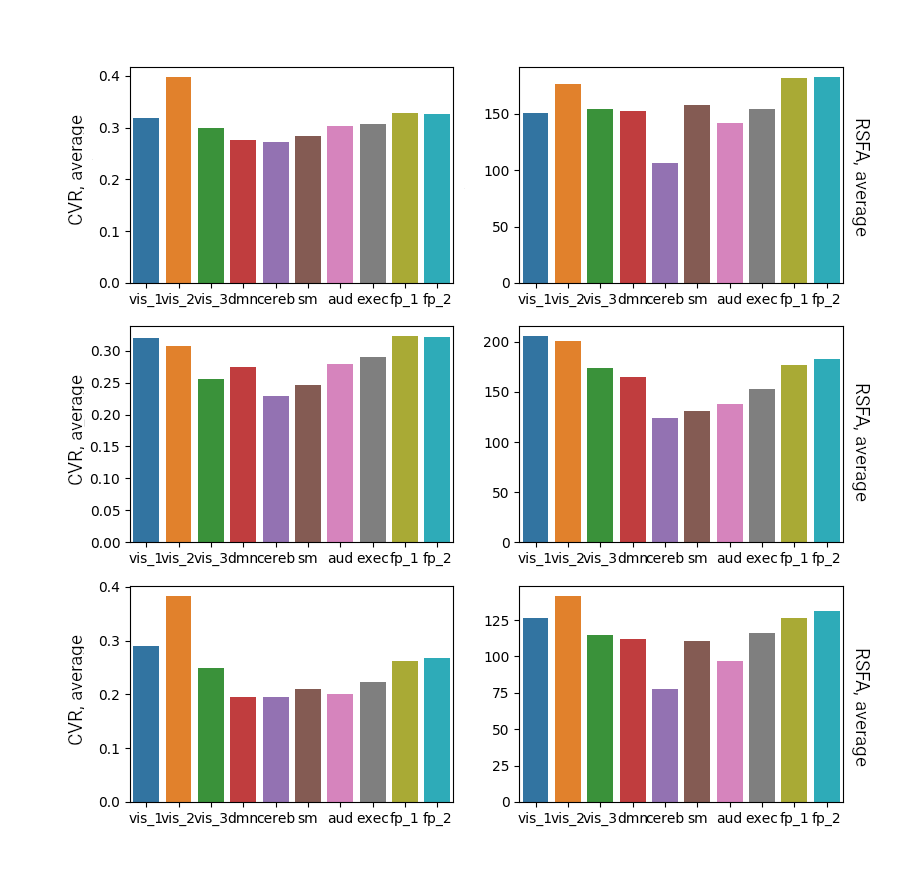
Figure 5 shows the average CVRBH and the average CVRRSFA in ten RS networks, for the three subjects. While the cerebellum tends to have the lowest CVR, the secondary visual network seems to have the highest CVR. However, this might be due to proximity of large vessels that introduce a bias in the CVR computation. It remains an interesting open question how this variability in CVR across known neural networks may influence our understanding of functional connectivity and brain physiology.
Acknowledgements
Research reported in this abstract was supported by the European Union’s Horizon 2020 research and innovation programme (Marie Skłodowska-Curie grant agreement No. 713673), a fellowship from La Caixa Foundation (ID 100010434, fellowship code LCF/BQ/IN17/11620063), the Spanish Ministry of Economy and Competitiveness (Ramon y Cajal Fellowship, RYC-2017-21845), the Spanish State Research Agency (BCBL “Severo Ochoa” excellence accreditation, SEV- 2015-490), the Basque Government (BERC 2018–2021), the Spanish Ministry of Science, Innovation and Universities (MICINN; FJCI-2017-31814), the Eunice Kennedy Shriver National Institute of Child Health and Human Development of the National Institutes of Health under award number K12HD073945.References
1. Liu P, Li Y, Pinho M, Park DC, Welch BG, Lu H. Cerebrovascular reactivity mapping without gas challenges. Neuroimage. 2017 Feb 1;146:320-6.
2. Lipp I, Murphy K, Caseras X, Wise RG. Agreement and repeatability of vascular reactivity estimates based on a breath-hold task and a resting state scan. Neuroimage. 2015;113:387-396. doi:10.1016/j.neuroimage.2015.03.004
3. Bright MG, Murphy K. Reliable quantification of BOLD fMRI cerebrovascular reactivity despite poor breath-hold performance. Neuroimage. 2013;83:559-568. doi:10.1016/j.neuroimage.2013.07.007
4. Yezhuvath US, Lewis-Amezcua K, Varghese R, Xiao G, Lu H. On the assessment of cerebrovascular reactivity using hypercapnia BOLD MRI. NMR Biomed. 2009;22(7):779-786. doi:10.1002/nbm.1392
5. Taylor PA, Saad ZS. FATCAT: (An Efficient) functional and tractographic connectivity analysis toolbox. Brain Connect. 2013;3(5):523-535. doi:10.1089/brain.2013.0154
6. Smith SM, Fox PT, Miller KL, et al. Correspondence of the brain’s functional architecture during activation and rest. Proc Natl Acad Sci U S A. 2009;106(31):13040-13045. doi:10.1073/pnas.0905267106
Figures