3854
Region-to-region covariation of cerebral blood flow in the young brain before and after acute exercise
Nicholas J. Luciw1,2, Benjamin I. Goldstein2,3, and Bradley J. MacIntosh1,2
1Department of Medical Biophysics, University of Toronto, Toronto, ON, Canada, 2Sunnybrook Research Institute, Toronto, ON, Canada, 3Departments of Psychiatry and Pharmacology, University of Toronto, Toronto, ON, Canada
1Department of Medical Biophysics, University of Toronto, Toronto, ON, Canada, 2Sunnybrook Research Institute, Toronto, ON, Canada, 3Departments of Psychiatry and Pharmacology, University of Toronto, Toronto, ON, Canada
Synopsis
Functional brain networks reflect inherent inter-regional relationships that subserve behaviour and information processing. There is evidence that the correlations of regional brain function across individuals partly reflect functional connectivity. The current study focuses on region-to-region covariation of cerebral blood flow (CBF) across participants using arterial spin-labelled MRI. To investigate the stability of this CBF covariance mapping, we compare maps acquired within the same day but before and after a single exercise session. To refine our CBF covariance mapping methodology, we consider whether choice of anatomical atlas and use of partial volume correction impact the results of our between-session comparison.
Introduction
Arterial spin labelling (ASL) MRI is a non-invasive method of measuring quantitative cerebral blood flow (CBF), a core measure of physiological brain health. ASL and other functional neuroimaging modalities are frequently used to compare CBF images between groups of individuals or between scan sessions, offering insight into the neurophysiology of individual brain regions. Recently, the relationships between such individual brain regions have been interrogated using the co-variation of regional brain structure or function across a group of individuals.1,2 In fact, there is evidence that regional covariation of brain function across individuals partly reflects fMRI-based functional connectivity.3 Images of CBF can be used to study this functional covariance, and CBF covariance is reported in both healthy and patient populations.4-6 Meanwhile, it remains to be seen whether CBF covariance patterns are static, or whether a change in the physiological state brought about from a single acute exercise session is sufficient to alter region-to-region CBF covariance. Here, we investigate an intra-day session effect subsequent to an exercise session. To provide methodological context, we consider whether: A) choice of two neuroanatomical atlases (i.e. based on anatomy or functional networks), and B) partial volume correction (i.e. yes/no) on the regional CBF estimates influence the CBF covariance session differences.Methods
We acquired pseudo-continuous ASL MRI and T1w scans from 39 healthy adolescents with mean age 17±1.5 years. Scanning was conducted on a 3T MRI (Achieva, Philips Healthcare). We used a 2D EPI acquisition with parameters: TR/TE=4.0s/9.7ms; 64x64x18 matrix; voxel size 3x3x5mm3; and 4min8s scan duration. The pseudo-continuous labelling scheme used the following parameters: 1650ms label duration; 1600ms post-label delay for the most inferior slice; and 30 control-label pairs. We collected an ASL scan pre- and post-exercise, with a minimum of 90 min between scans. Between scans, aerobic exercise was performed at a steady rate and load (70% of age-estimated heart rate maximum) for 20 min. ASL scans were processed using the ENABLE algorithm to reduce the impact of head motion corruption.7 Quantification of CBF and, if applied, partial volume correction (PVC) was performed using the BASIL package (FMRIB Software Library).8 Each participant’s CBF image was registered to the standard MNI152 2mm template, using registration to the participant’s T1w image as an intermediate step. The CBF images were demeaned and regional CBF values were extracted using either the Automated Anatomical Labelling (AAL; 100 regions) atlas or the Shen functional atlas (268 regions). For each of the four processing choices (AAL+noPVC, AAL+PVC, Shen+noPVC, Shen+PVC), we calculated CBF covariance maps as the correlation coefficient, across individuals, between every region and every other. The elements of each covariance map (i.e. correlations) were transformed to z-scores using Fisher’s r-to-z. For all four processing choices, the intra-class correlation coefficient and average element-wise difference was calculated between pre- and post-exercise covariance maps.Results
The pre- and post-exercise CBF covariance maps, for each of the four processing choices, are shown in Figure 1. The correspondence between covariance map elements before and after exercise is shown in Figure 2, and the intra-class correlation coefficients are summarized in Table 1A. In all cases, intra-class correlation was greater than 0.75. The CBF covariance maps computed using the AAL parcellation had marginally higher agreement between pre-/post-exercise than did those computed using the Shen parcellation. Lastly, the average session differences between individual elements of the CBF covariance maps are given in Table 1B. Here we observed, on average, the post-exercise CBF covariance map had higher correlation values than those measured pre-exercise; this effect was independent of choice of atlas but accentuated by applying PVC.Discussion
We present a comparison of inter-regional CBF correlations across 39 adolescents scanned with ASL MRI before and after acute exercise. Forming CBF covariance maps, these correlations showed high agreement between pre- and post-exercise, regardless of atlas choice and presence/absence of PVC. For both PVC- and PVC+, the covariance maps computed using the AAL atlas showed marginally higher agreement between sessions. This is a likely consequence of the larger region size in the AAL resulting in more robust and less specific regional CBF averages, whereas the higher-resolution Shen atlas may allow more specific assessment of local changes. Average CBF covariance was elevated post exercise regardless of processing choice, however, this elevation was largest when partial volume correction was applied. Especially in this young cohort, in which neuroanatomical development is ongoing, PVC may help prevent anatomical variability from biasing CBF measurement and thereby washing out exercise-related effects. Aerobic exercise is known to transiently increase CBF across the brain, which may be why we detected increased region-to-region CBF correlations in the post-exercise session.Acknowledgements
No acknowledgement found.References
- Alexander-Bloch, A., Giedd, J.N., Bullmore, E., 2013. Imaging structural co-variance between human brain regions. Nat. Rev. Neurosci. 14(5):322-336.
- Taylor, P.A., Gohel, S., Di, X., Walter, M., Biswal, B.B., 2012 Functional covariance networks: obtaining resting-state networks from intersubject variability. Brain connectivity. Aug 1;2(4):203-17.
- Di, X., Biswal, B.B., and Alzheimer's Disease Neuroimaging Initiative, 2012. Metabolic brain covariant networks as revealed by FDG-PET with reference to resting-state fMRI networks. Brain connectivity. Oct 1;2(5):275-83.2.
- Melie-García, L., Sanabria-Diaz, G., Sánchez-Catasús, C., 2013. Studying the topological organization of the cerebral blood flow fluctuations in resting state. Neuroimage 64, 173–184.
- Zhu, J., Zhuo, C., Qin, W., Xu, Y., Xu, L., Liu, X., Yu, C., 2015. Altered resting-state cerebral blood flow and its connectivity in schizophrenia. J. Psychiatr. Res. 63, 28–35.
- Liu, F., Zhuo, C., Yu, C., 2016. Altered cerebral blood flow covariance network in schizophrenia. Front. Neurosci. 10.
- Shirzadi, Z., Stefanovic, B., Chappell, M.A., Ramirez, J., Schwindt, G., Masellis, M., Black, S.E., MacIntosh, B.J., 2018. Enhancement of automated blood flow estimates (ENABLE) from arterial spin‐labeled MRI. Journal of Magnetic Resonance Imaging. Mar;47(3):647-55.
- Chappell, M.A., Groves, A.R., Whitcher, B., Woolrich, M.W., 2008. Variational Bayesian inference for a nonlinear forward model. IEEE Transactions on Signal Processing. Sep 16;57(1):223-36.
Figures
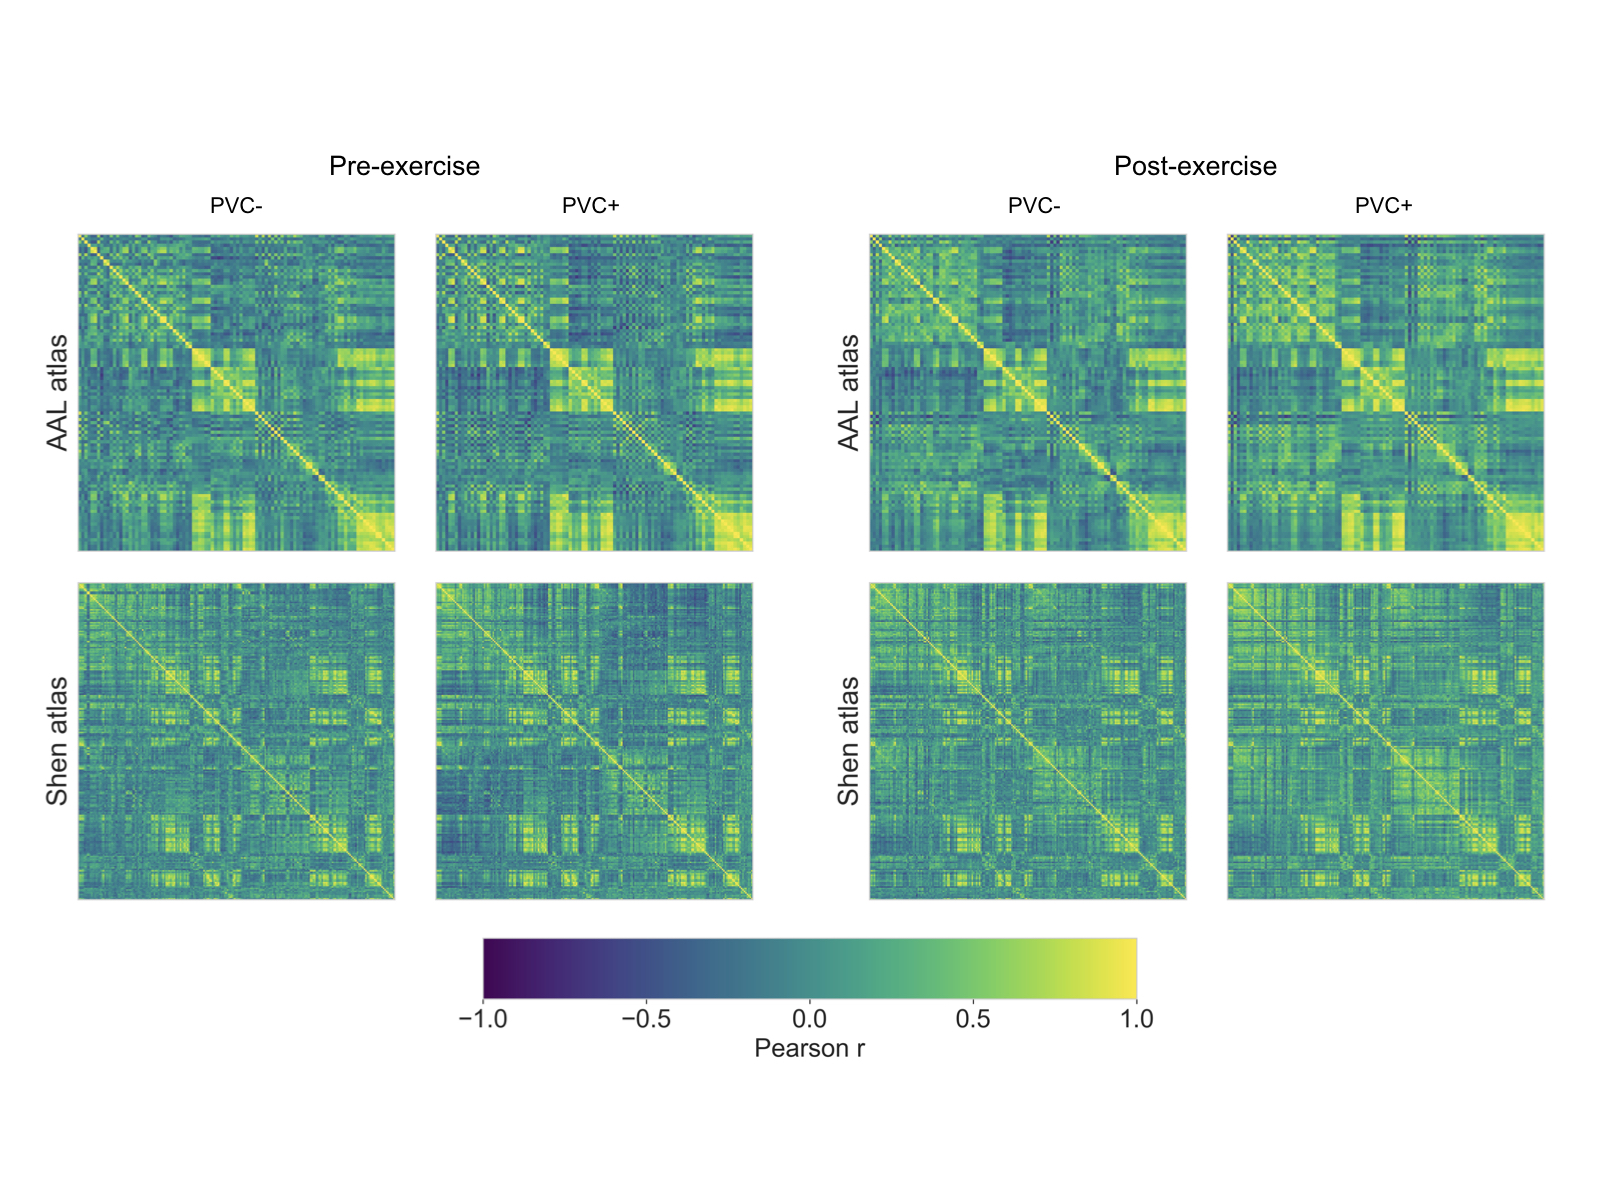
Figure 1. CBF covariance maps at pre- (left) and post- (right) exercise. For each session, the AAL (100 regions) and Shen (268 regions) parcellations are shown, both with and without partial volume correction (PVC) applied.
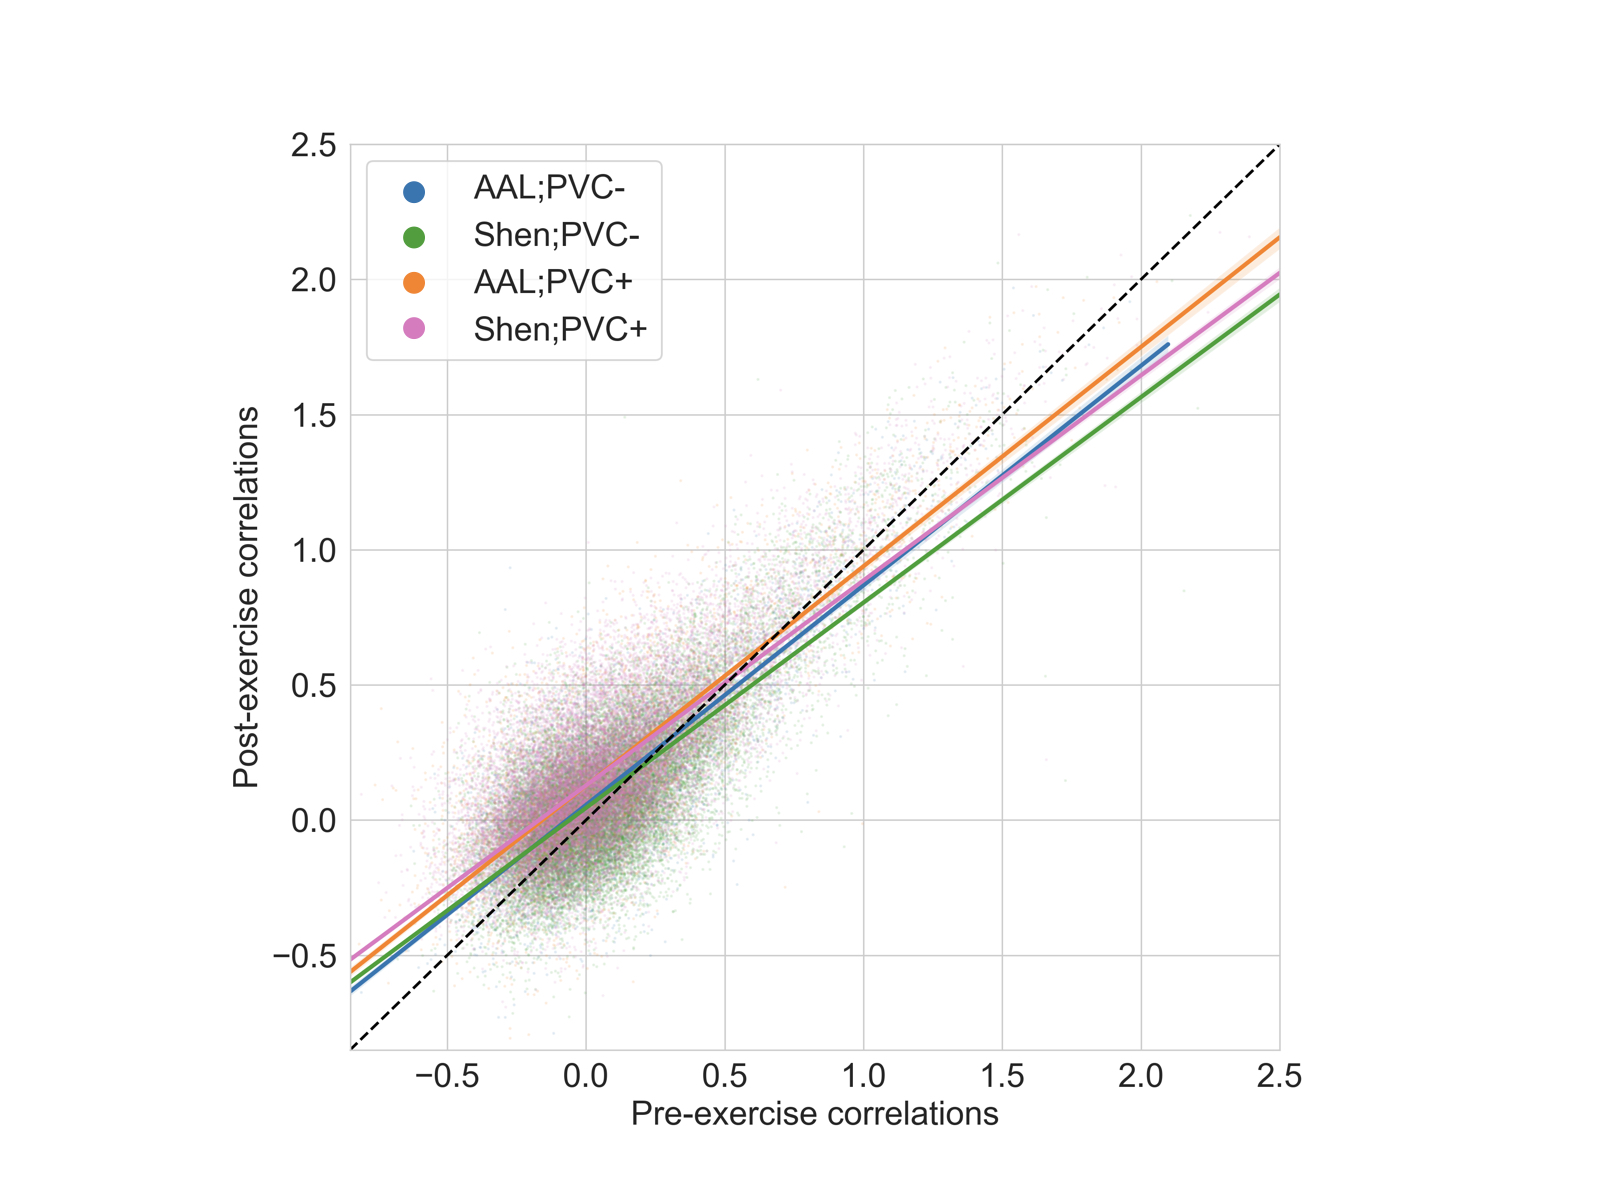
Figure 2. Cerebral blood flow covariance pre- and post-exercise, for all four combinations of atlas and choice of partial volume correction (PVC). To encourage normality, correlations have been transformed to z-scores using Fisher’s r-to-z. The coloured lines are linear regression lines for the corresponding processing choice, and individual data points are shown in the background. The dashed black line is the line of unity.
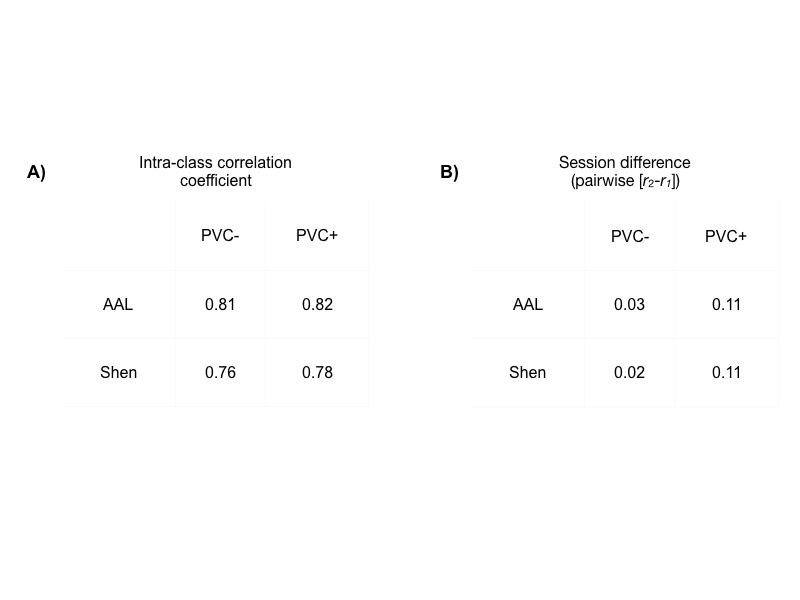
Table 1. A) Intra-class correlation coefficients between scan session 1 and session 2, for all four combinations of atlas and choice of partial volume correction (PVC). B) Mean difference between every pair of elements of covariance maps at session 2 and session 1, for all four combinations of atlas and choice of partial volume correction.