3853
Effects of mild hypoxia on oxygen extraction fraction responses to brain stimulation1Radiology, Capital Medical University, Beijing, China, 2Linguistics, the University of Hong Kong, Beijing, China
Synopsis
The oxygen extraction fraction (OEF) is a key physiological marker of cerebral oxygen metabolism. While the availability of oxygen plays a crucial role in oxygen metabolism, the effect of mild hypoxia on OEF during brain activity remains largely unclear. In this study, a novel OEF dynamic measurement technique, multiecho asymmetric spin echo pulse sequence, was used to investigate the OEF response during motor task in both normoxia and mild hypoxia. Results demonstrated that the motor-induced OEF response change was larger in mild hypoxia (-23% ± 6%) than that in normoxia (-12% ± 4%) and was positively correlated with oxygen saturation.
Purpose
Without continuous oxygen supply, the brain is prone to irreversible damage. The delivery of oxygen may be compromised in many clinical or environmental settings, such as hypoxia1,2. The oxygen extraction fraction (OEF) represents the amount of oxygen that leaves the blood stream to enter surrounding tissues, defined as the ratio of oxygen consumption to oxygen delivery. While the availability of oxygen plays a crucial role in energy metabolism, there lacks research investigating the effect of mild hypoxia on OEF during brain activity due to the limitation of OEF acquisition time.Methods
Using a fMRI 3.0T GE MR750 scanner, this study recruited 21 healthy adult subjects (20-28 y). The paradigm consisted of 12s of dummy scanning and two blocks of a right-hand grasp-release task (1 Hz) alternated with three baseline blocks; each block lasted 60s. Medical air (21% O2,79% N2) and hypoxia gas mixture (12% O2, 88% N2) were respectively provided during normoxia and hypoxia. Gas was delivered to subjects via a nonrebreather facial mask, as blood oxygen saturation levels were monitored by a digital pulse oximeter throughout the experiments. Sufficient time was given in-between runs for blood-oxygen-saturation level stabilization.Before fMRI data collection, a high-order shimming sequence was performed to minimize magnetic field inhomogeneity. A MASE pulse sequence was implemented for OEF mapping3 (FOV=260×260mm2; voxel size=4x4x6mm3; TR=3s; 16 interleaved axial slices without space encompassing the motor cortex; SENSE factor=2; TESE=100ms; ΔTE₁=35ms; and ΔTE₂=12.4ms). 3D T1-weighted images were acquired with TR/TE/FA=6.6ms/2.9ms/12°, 1x1x1mm3.
Data collected during dummy period were discarded to ensure that the signal has reached a steady state. Then, all fMRI images were corrected for motion, co-registered to the 3D T1 anatomical image, and normalized to the MNI space and spatially smoothed. The strategy for detailed calculation of OEF values has been described in our previous publication3. Notably, For the venous oxygenation fraction in the case of hypoxia, it has been derived that: 1-Yv=1-Ya+OEF·Ya.
A General linear model was performed to identify significantly activated voxels (P<0.001 with a P<0.05 FWE correction) of OEF in each gas condition. The regions-of-interest was defined as the overlapping activation regions of OEF significant activation in the primary motor cortex under the two gas conditions.
For each gas condition, the OEF signal changes (δOEF) was evaluated by the following calculations. First, the time course of the OEF in all voxels of the ROI were extracted and averaged. Second, baseline value of OEF (OEFbase) was calculated by averaging the baseline data, but excluding the first five time points of baseline state due to the effect of hemodynamic response. Finally, δOEF were calculated by normalized with its baseline OEF value.
In order to compare the baseline and activation values under different gas conditions. The OEF signal changes in both baseline and activation conditions during mild hypoxia were normalized to the normoxia baseline value. In addition, Pearson correlation analysis was applied to assess significant correlations (P<0.05, two-tailed) between %SpO2 and normalized OEF signal changes. All other statistical analyses were done using paired t-test with the same significance levels. All data are presented as mean± SD.
Results
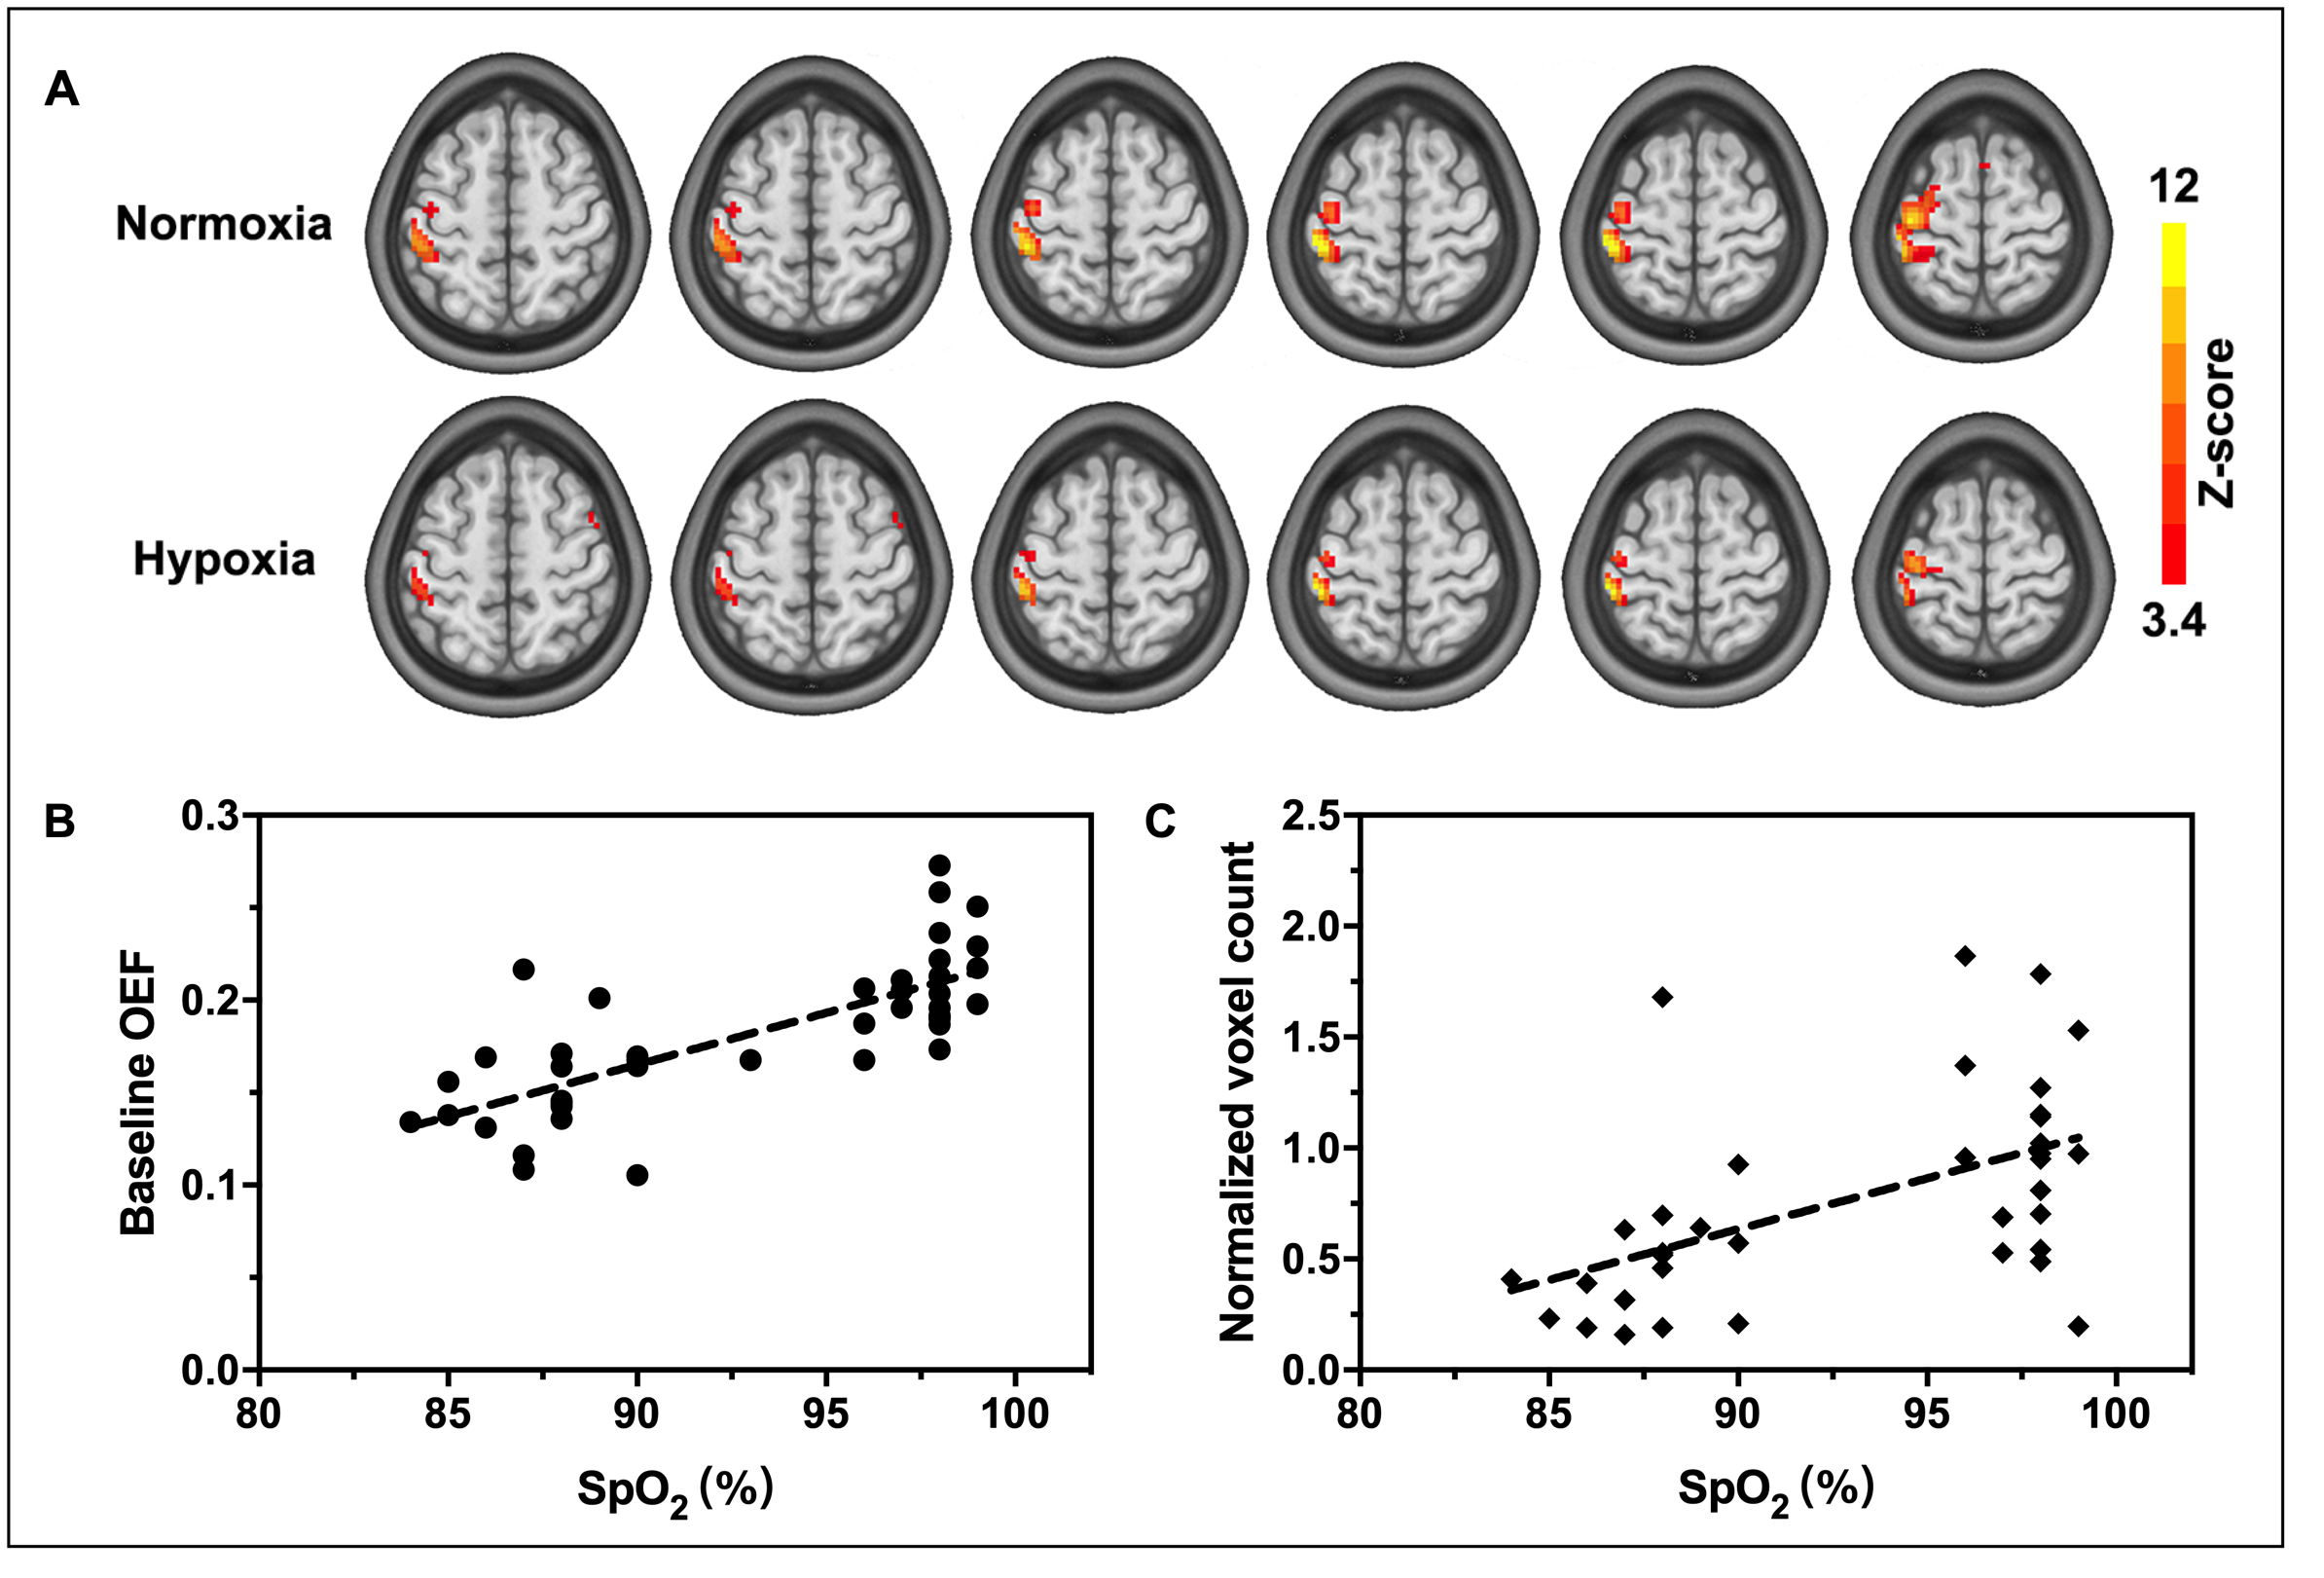
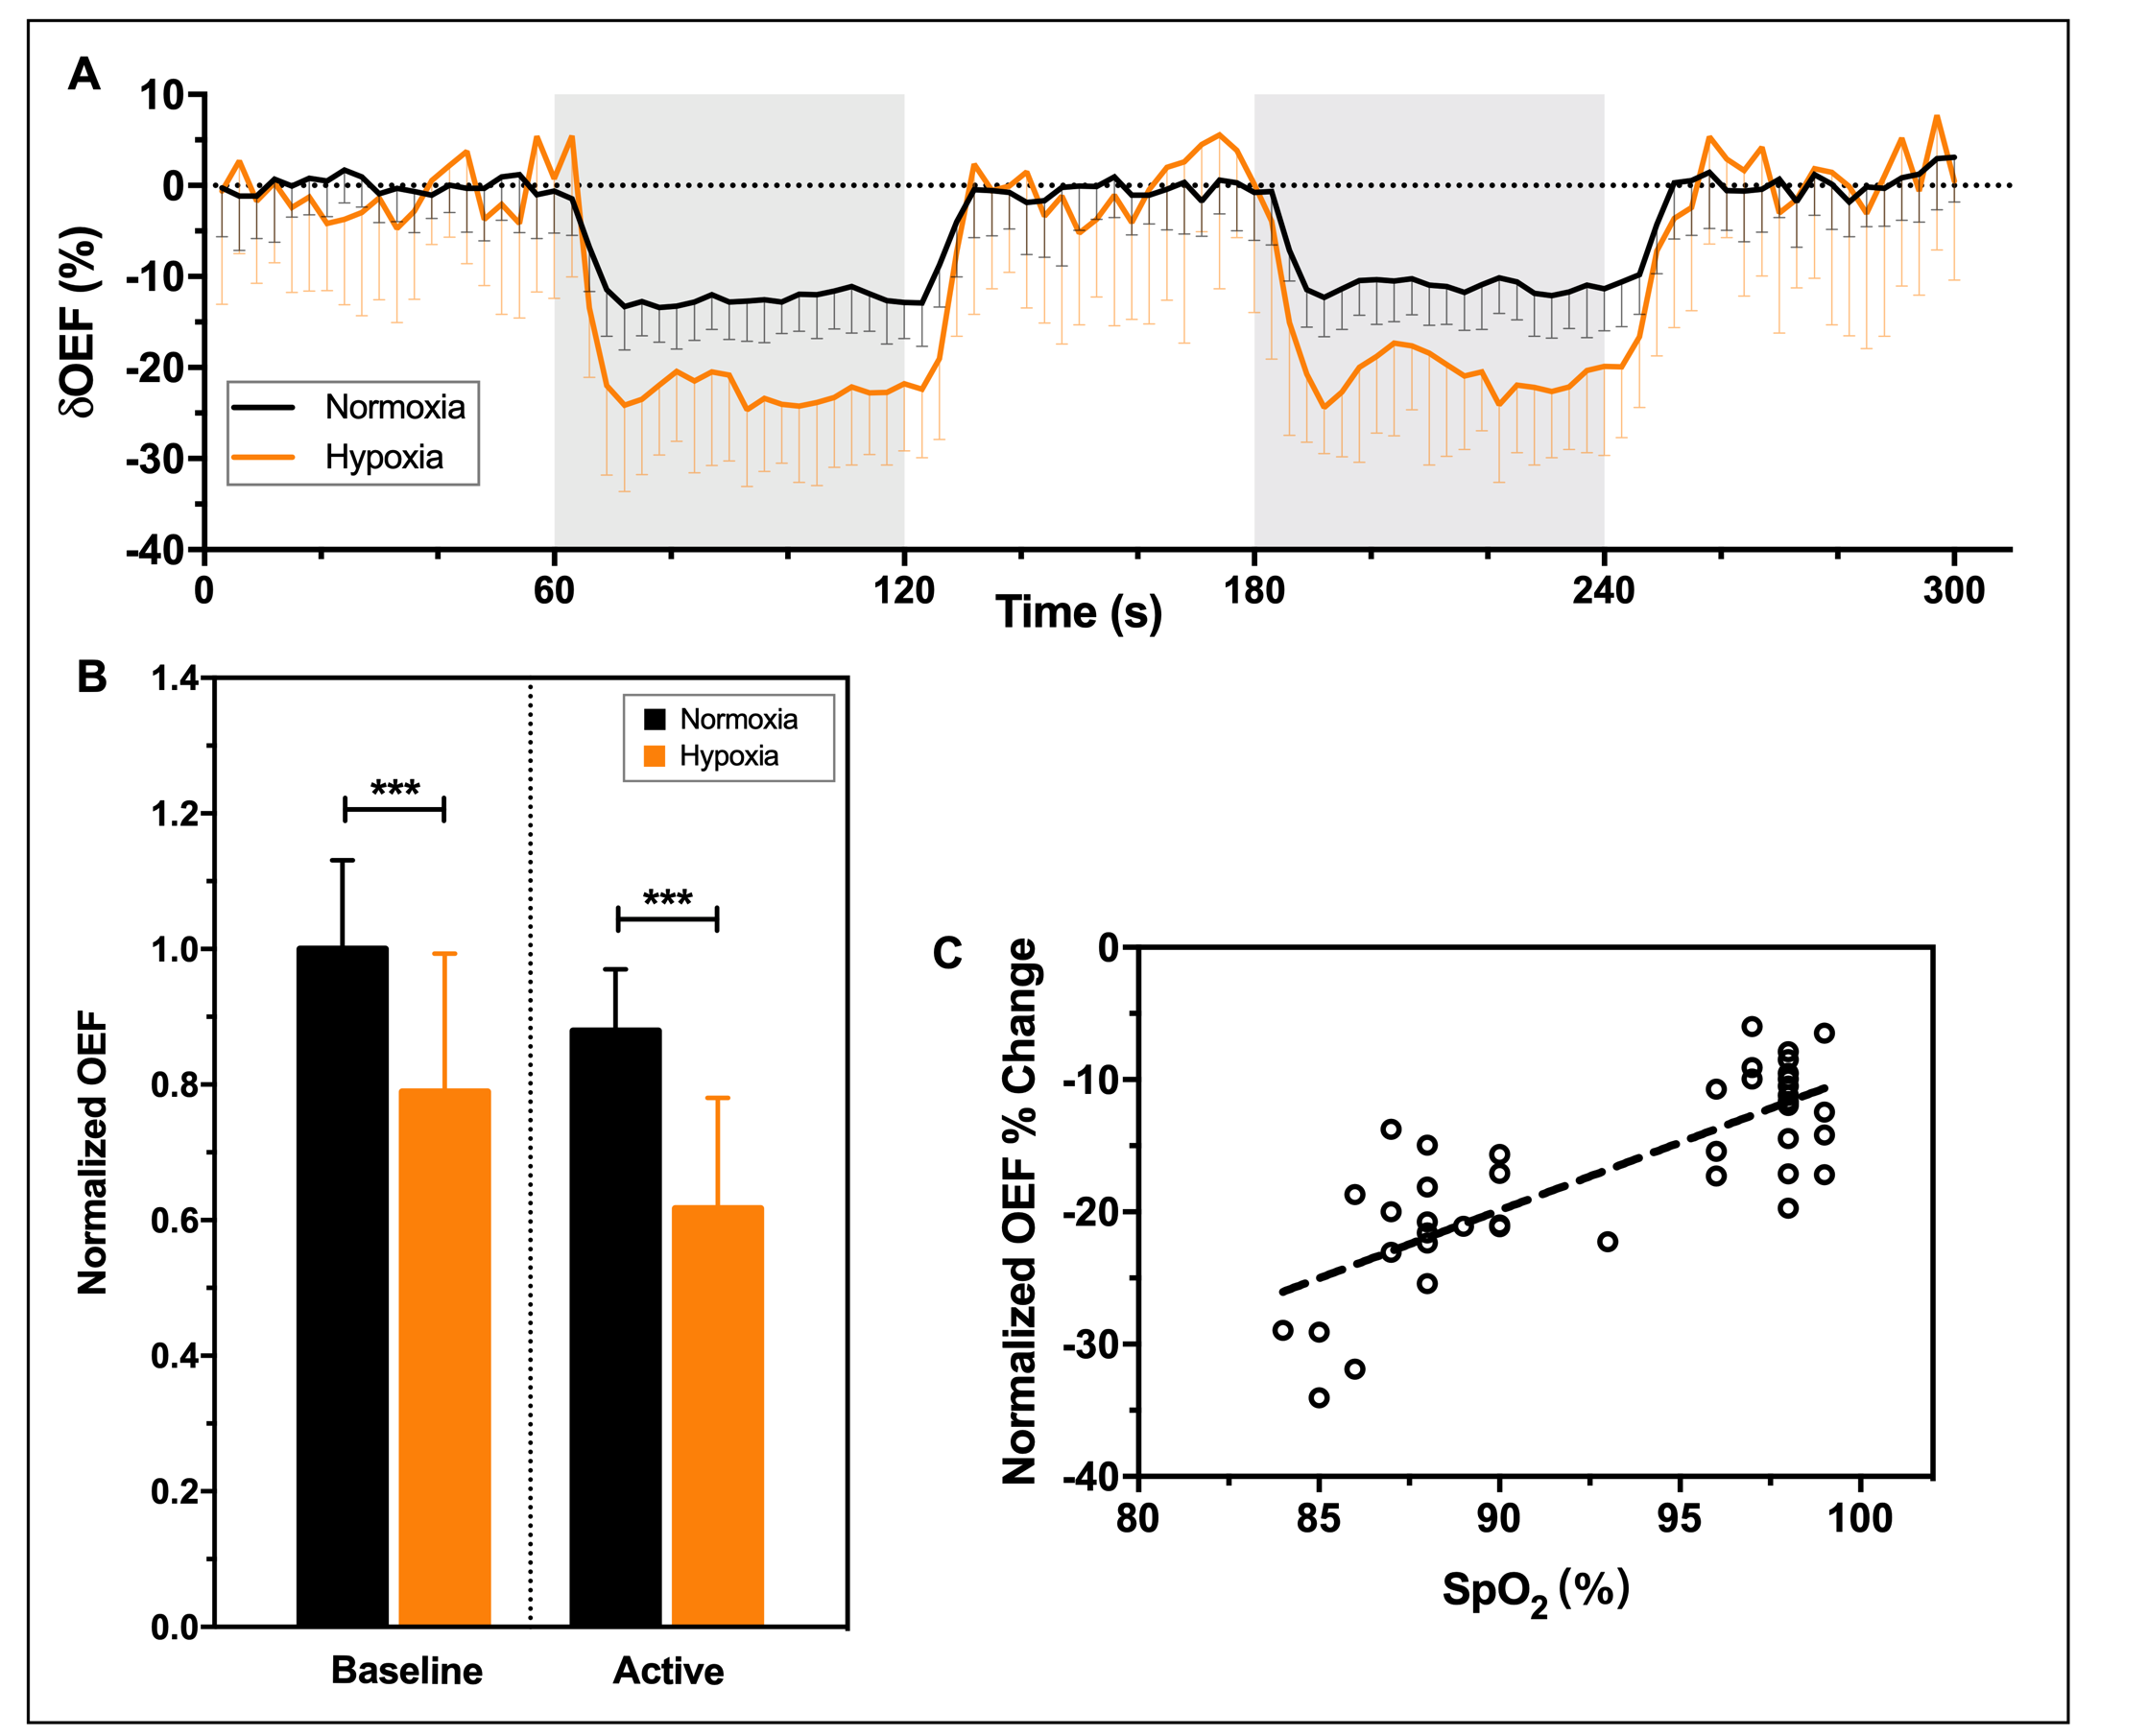
The %SpO2 significantly decreased by 12% from 97.86% ± 0.85% to 87.24% ± 2.74% (P<0.0001). Typical OEF activation maps obtained from one representative subject during normoxia and mild hypoxia are shown in Figure 1A. Significant reductions of activated areas in OEF during hypoxia was observed. The baseline OEF in normoxia was 0.21 ± 0.03 and the decrease of baseline OEF as a function of SpO2 (Figure 1B). Compared with normoxia, there was a reduction by 53.14% ±19.68% in OEF activated areas and a positive correlation (Figure 1C) was evident for the plot of OEF voxel count against SpO2 (P=0.001).In Figure 2A, the motor-induced OEF signal change was larger in mild hypoxia (-23% ± 6%) than that in normoxia (-12% ± 4%) (P < 0.0001) and was positively correlated with oxygen saturation (P < 0.0001) (Figure 2C). Both baseline and activation OEF were significantly lower under mild hypoxia than those under normoxia (P < 0.0001) (Figure 2B).
Discussion and conclusion
With the latest dynamic measurements of OEF technology, the present study is the first time to show the time course of OEF response for motor task in both normoxia and mild hypoxia. The results showed that mild hypoxia caused a larger OEF response during mild hypoxia. A recent study of Barreto et al. (2017)4 reported that stimulus-induced cerebral metabolic rate of oxygen response was smaller during mild hypoxia than that of normoxia but cerebral blood flow response was not affected. According to Fick’s law, thus, the response amplitude of OEF is larger during mild hypoxia, which is consistent with the results obtained in present study. Moreover, hypoxia significantly reduced the OEF including baseline and activation. A possible explanation for the decrease of baseline OEF is that a reduced arterial oxygen saturation results in a decrease in oxygen concentration gradient between capillary and tissue, thereby affecting the diffusion of oxygen from capillary to tissue. In conclusion, OEF can be used as an effective contrast to investigate neural activity in different oxygen environments.Acknowledgements
This study was supported by The National Natural Science Foundation of China (81901722). China Postdoctoral Science Foundation (Grant No. 2019M650772).References
1. Bain, A. R. et al. Hypercapnia is essential to reduce the cerebral oxidative metabolism during extreme apnea in humans. Journal of Cerebral Blood Flow & Metabolism. 2017; 37(9): 3231–3242.
2. Lawley, J. S. et al. Unexpected reductions in regional cerebral perfusion during prolonged hypoxia’, Journal of Physiology. 2017;595:935-947.
3. Yin, Y. et al. Dynamic measurement of oxygen extraction fraction using a multiecho asymmetric spin echo (MASE) pulse sequence. Magnetic Resonance in Medicine. 2018;80: 1118–1124.
4. Rodrigues Barreto, F. et al. Effects of reduced oxygen availability on the vascular response and oxygen consumption of the activated human visual cortex. Journal of Magnetic Resonance Imaging. 2017;46(1): 142-149.
Figures