3851
The relationship of functional connectivity of the sensorimotor and visual cortical networks between resting and task states1Department of Radiology, Guizhou Provincial People's Hospital, Guiyang, China, 2Department of Radiology, Michigan State University, East Lansing, MI, United States, 3GE Healthcare, Beijing, China
Synopsis
The current study investigated the relationship of the sensorimotor and visual cortical functional connectivity (FC) networks between the resting and task states. Our study demonstrated a general relationship of the task-evoked FC network with its corresponding intrinsic FC network, regardless of the tasks.
Introduction
The intrinsic activity of the human brain maintains its general operation at rest. These spontaneous activities exhibit a high level of spatiotemporal correlation among different cortical areas, showing intrinsically organized brain functional connectivity (FC) networks1-3. While functional network properties of the human brain have been investigated extensively at both rest and task states, the relationship between these two states has been rarely examined and remains unclear. Comparing well-defined task-specific networks with corresponding intrinsic FC networks may reveal their relationship and improve our understanding of the brain’s operations at both rest and task states.Using resting state, sensorimotor task- and visual task-related functional MRI (fMRI) approaches, here we investigated the relationship of the sensorimotor and visual cortical FC networks between the resting and task states.
Material and Methods
Fourteen healthy subjects participated in this study. All participants first underwent a 9 min resting-state (rs) run and then a 9 min task run. During the task run, they performed two tasks. The first task trial consisted of rubbing five fingers of the right hand for 8 sec followed by a 22 sec rest period; and the second task trial consisted of opening eyes for 8 sec and then closed them for a 22 sec rest period. These two task trials were repeated for 8 times, resulting in a total of 8 min task period. All data were acquired on a 3.0T MR scanner (Discovery MR 750, GE Healthcare, Milwaukee, WI) with a 32-channel phased-array coil. Thirty-eight axial T2*-weighted functional images covering the whole brain were obtained using a gradient echo echo-planar imaging pulse sequence with following parameters: TR/TE = 2500/28 ms, FA = 80°, FoV = 224x224 mm, matrix = 64×64, slice thickness/gap = 3.5/0 mm. Function data post-processing with a standard procedure4 including removing spikes, slice timing correction, motion correction, smoothing, baselin computation, generating mask, bandpassing, and computing the relative signal change were performed using AFNI (Available from http://afni.nimh.nih.gov/afni). FC were analyzed using two-tail paired t-test.Results
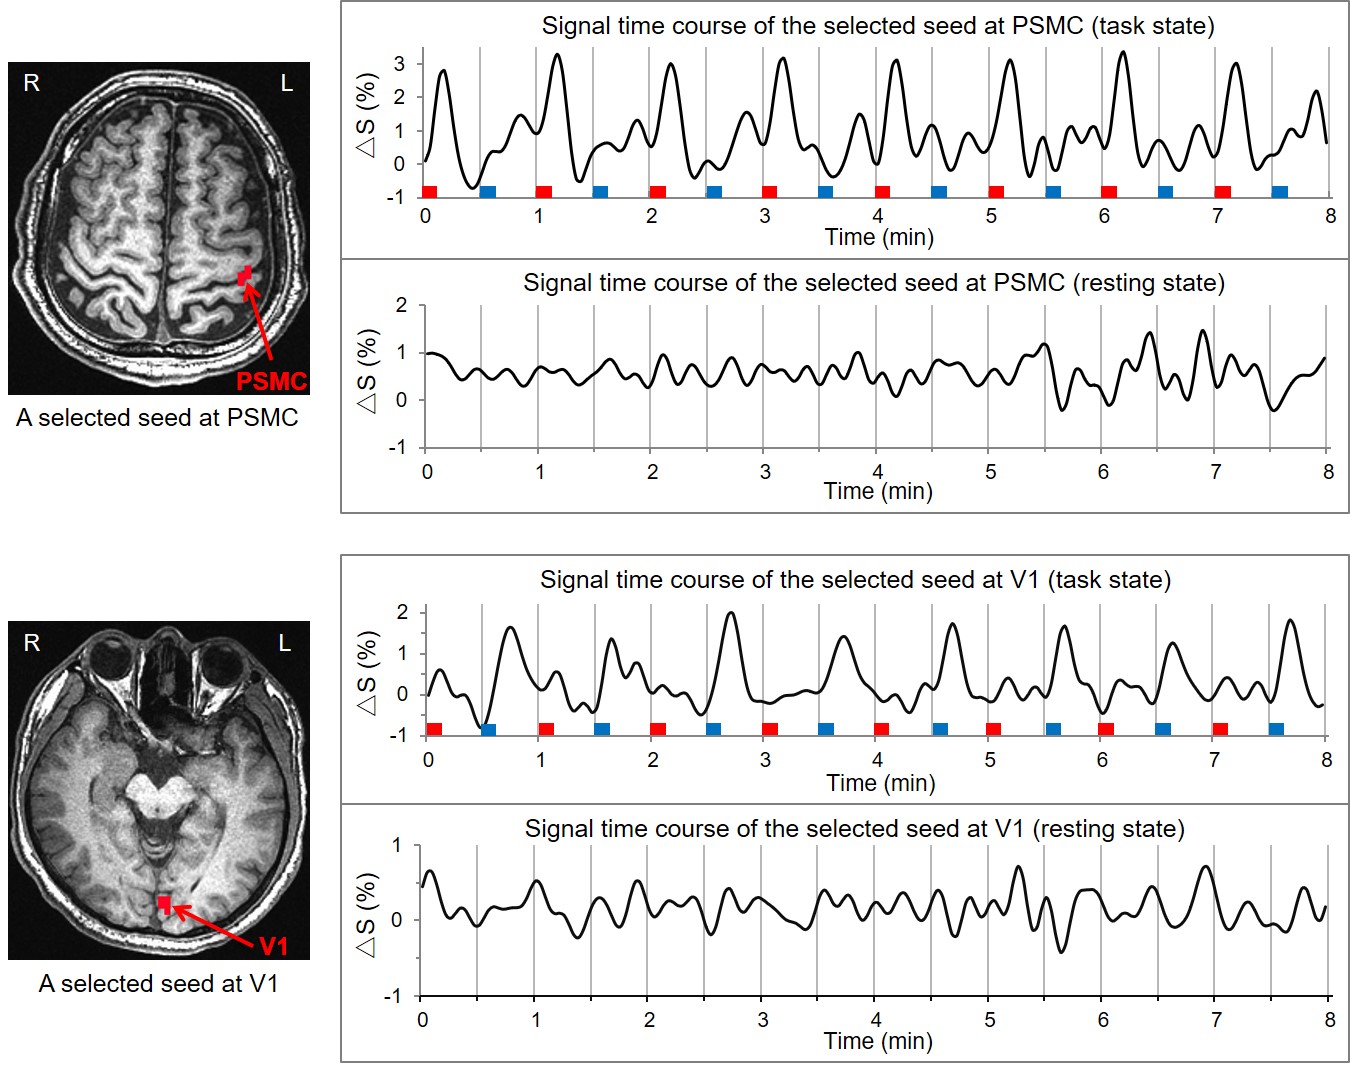
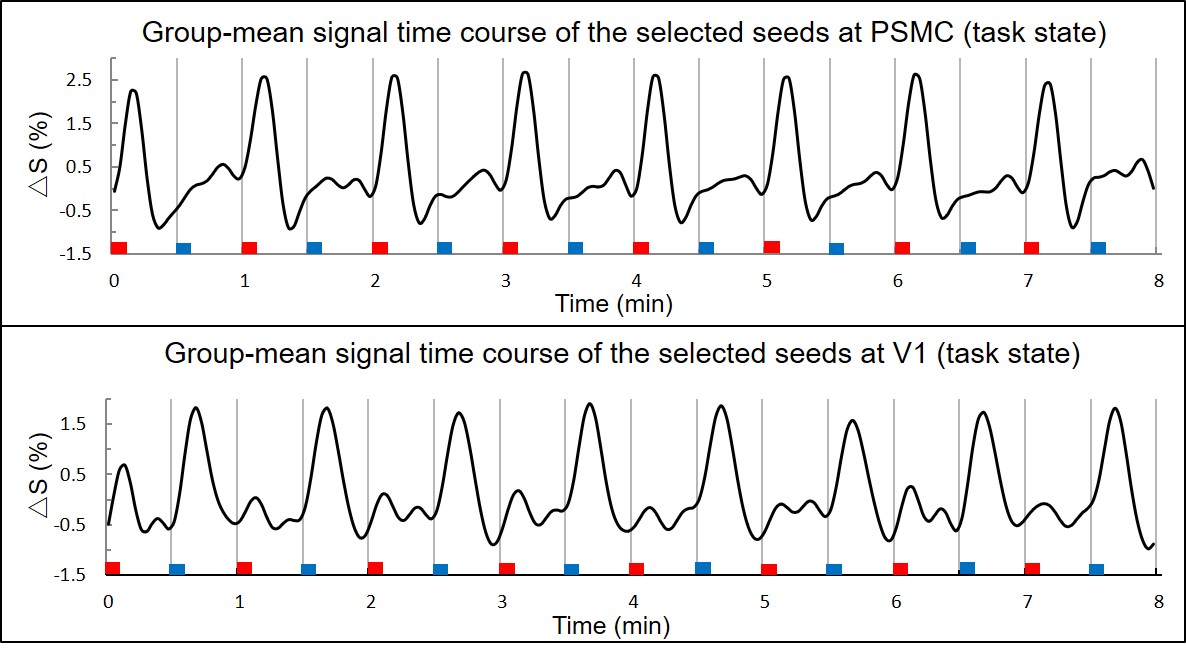
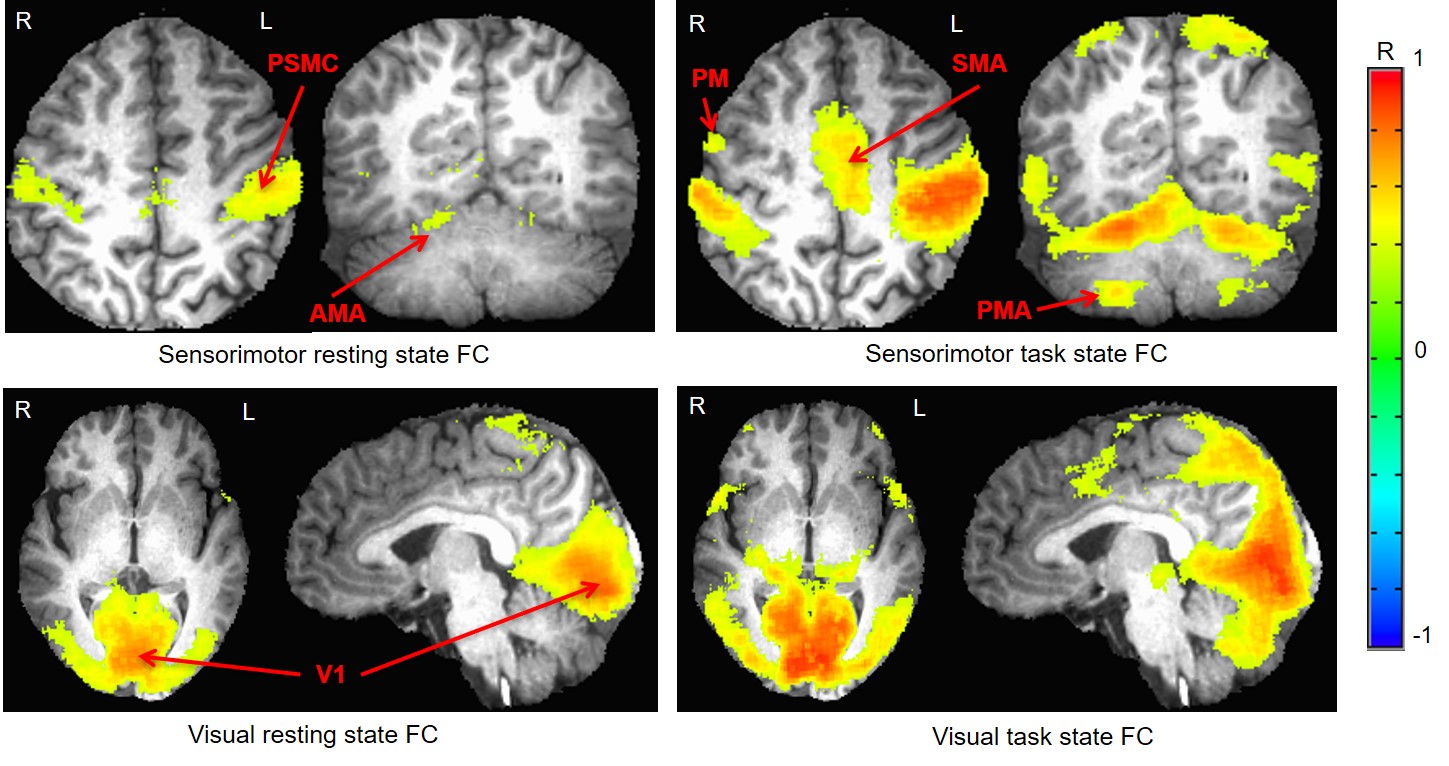
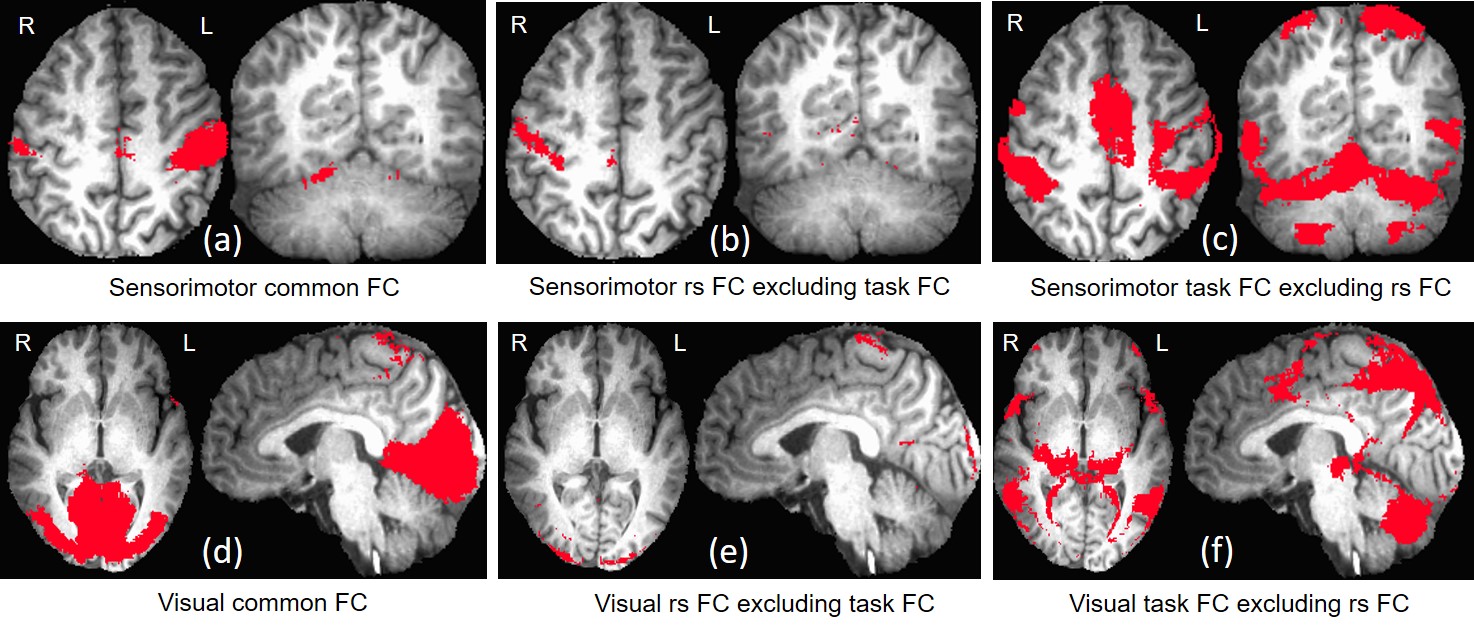
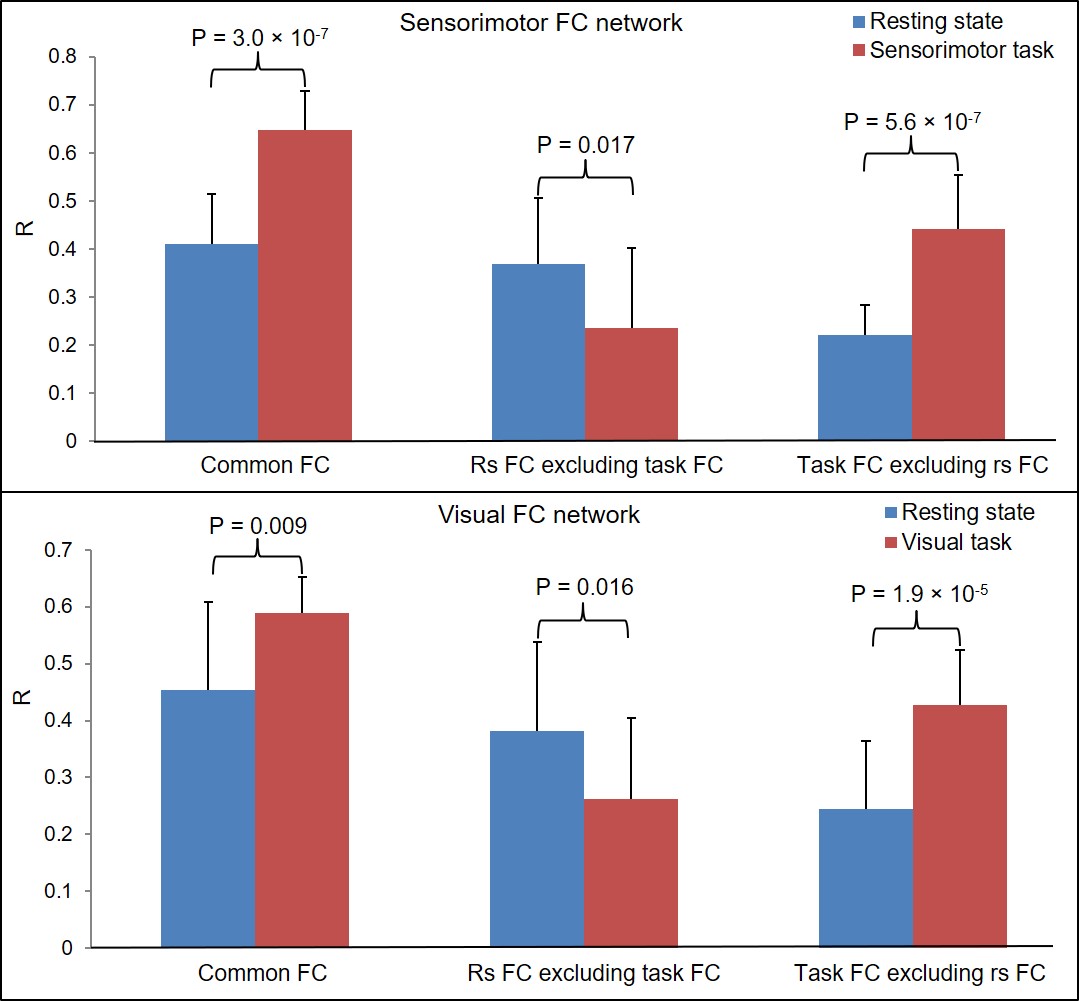
We identified one seed region in left primary sensorimotor cortex (PSMC) that was associated with the finger-rubbing task and one seed region in left V1 associated with the eye-opening and closing task for each participant. Fig. 1 illustrates the two selected seeds in these areas for a representative participant. For the task state, we computed a group-mean signal time course averaged across all participants for each seed type, and its association with the corresponding task is conspicuous for each of the eight task trials (Fig. 2). For the seed selected in left PSMC, the determined FC map demonstrated a significant correlation of intrinsic neural activity in both left and right primary sensorimotor cortex, premotor area, supplementary motor area, parietal cortex, and the right anterior motor area of the cerebellum at the resting state (Fig. 3, top panel). For the seed selected in left V1, the identified FC map showed a significant correlation of the intrinsic neural activity in both left and right visual cortex at the resting state (Fig. 3, bottom panel). Fig. 4a illustrates the overlapped areas of the FC maps between the resting and task states, Fig. 4b illustrates the major areas of the rs FC map excluding the task FC map, and Fig. 4c the major areas of the task FC map excluding the rs FC map for sensorimotor cortical network, similarly, for visual cortical network.Using the common areas of the two FC maps as a mask, we compared the group-mean analysis of the R values between the resting and task states (Fig. 5). For the sensorimotor FC map, the finger-rubbing task significantly increased the co-activity across the entire common FC network (P = 3.0×10⁻⁷) and across those expanded and additionally activated brain areas (P = 5.6×10⁻⁷), respectively. In the resting FC map excluding the task FC map, the R was significantly larger for the resting state than that for the task state (P = 0.017). For the visual FC map, the eye-opening and closing task significantly increased the co-activity across the entire common FC network (P = 0.009) and across those expanded and additionally activated brain areas (P = 1.9×10⁻⁵), respectively. In the resting-state FC map excluding the task FC map, the R was significantly larger for the resting state than that for the task state (P = 0.016).
Discussion and Conclusion
Our study demonstrated a general relationship of the task-evoked FC network with its corresponding intrinsic FC network, regardless of the tasks. For each task type, we demonstrated that: (1) the intrinsic and task-evoked FC networks shared a common network and the task enhanced the co-activity within that common network compared to the intrinsic activity; (2) some areas within the intrinsic FC network were not activated by the task, indicating that the task activated only partial but not whole of the intrinsic FC network; and (3) the task activated substantial additional areas outside the intrinsic FC network, which may be attributed to a recruitment of more intrinsic FC networks to help the task performing.Acknowledgements
This work was supported by the National Natural Science Foundation of China (No. 81960314), the Science and Technology Foundation of Guizhou Province (QKHZC[2019]2810), (QKHJC[2016]1096), (QKHPTRC[2019]5803), and (QKHPTRC[2017]5724), the Guizhou Provincial People’s Hospital Doctoral Foundation (GZSYBS[2015]02), and the Guizhou Science and Technology Department Key lab. Project (QKF[2017]25).References
1. Biswal, B., Yetkin, F. Z., Haughton, V. M., & Hyde, J. S. Functional connectivity in the motor cortex of resting human brain using echo-planar MRI. Magn Reson Med. 1995; 34(4), 537-541.
2. Ogawa, S., Tank, D. W., Menon, R., Ellermann, J. M., Kim, S. G., Merkle, H., & Ugurbil, K. Intrinsic signal changes accompanying sensory stimulation: functional brain mapping with magnetic resonance imaging. Proc Natl Acad Sci USA. 1992; 89(13), 5951-5955.
3. Raichle, M. E. The restless brain. Brain Connect. 2011; 1(1), 3-12.
4. Huang, J. Human brain functional areas of unitary pooled activity discovered with fMRI. Sci Rep. 2018; 8(1), 2388.
Figures