3849
Neural Basis of Global Resting-state ASL Perfusion Signals1Computer Science, State University of New York at Binghamton, Binghamton, NY, United States, 2Radiology, Beth Israel Deaconess Medical Center & Harvard Medical School, Boston, MA, United States, 3National Institute on Aging, National Institite of Health, Baltimore, MD, United States
Synopsis
Global fluctuations of arterial spin labeling (ASL) signals may emerge from global synchronization of resting-state brain networks. We aimed to investigate the synchrony of ASL global signal with brain neural activity using simultaneously recorded ASL perfusion images and EEG. The correlation between the EEG frequency power time series and ASL global time courses was evaluated. The shape for time course of the correlation is very similar to hemodynamic response functional curve. The peak correlation time indicates that the global ASL signals follow the neural activity and the function of human brain is organized by the presence of global functional synchronization.
Introduction
Global synchronization of arterial spin labeling (ASL) perfusion signals has been reported [1]. Global perfusion fluctuations showed little association with cardiac pulsation and respiratory motion, and power spectra of global perfusion fluctuations demonstrated that the global fluctuations are of very low frequency. All these phenomena indicate that global fluctuations may emerge from global synchronization of brain resting state networks. Here, we aimed to investigate the synchrony of ASL global signal with brain neural activity. Specifically, EEG signals were recorded simultaneously with ASL perfusion images.Methods
Four healthy subjects (31.5±7.5 years old, 2 females) were scanned on a GE 3 Tesla MR750 scanner. EEG data were concurrently recorded using a 128 channel MRI compatible Geodesic Sensor Net (1kHz sampling rate) during a 17-min resting-state pseudo-continuous ASL (PCASL) [2] image acquisition. Two hundred 3D PCASL label images with temporal resolution of 5.318s were collected. Labeling duration of 2s and post-labeling delay of 1.8s were used for the ASL labeling. Background suppression pulses were optimized for 0.3% of background signal [3]. ASL images were reconstructed with the phase map from the traditional ASL baseline scan. The ASL images were transformed to the standard Montreal Neurological Institute (MNI) space using SPM8. The global resting state signal was extracted as the mean of the same 3D brain mask from each temporal frame. EEG data were first preprocessed to remove MR gradient artifacts and Balistocardiogram (BCG) artifacts, as implemented in Net Station software. Further, eye blink and lateral movement artifacts were removed via regression methods [4] using the time series of Electrooculography (EOG) electrodes. EEG power level at each frequency and each frequency band, i.e. delta: 2-4 Hz, theta: 4-8 Hz, alpha: 8-12 Hz, beta1: 12-18 Hz, beta2: 18-30 Hz, and gamma: 30-50 Hz was calculated, using fast Fourier transformation (FFT). The EEG frequency power, corresponding to each ASL image volume, was calculated for each 5s segment centered at a time shift before ASL image volume. This resulted in a EEG power time courses sampled at the same rate as the ASL signals for each time shift and each frequency/frequency band. The correlation between the EEG frequency power time series and ASL global time courses was evaluated.Results and Discussions
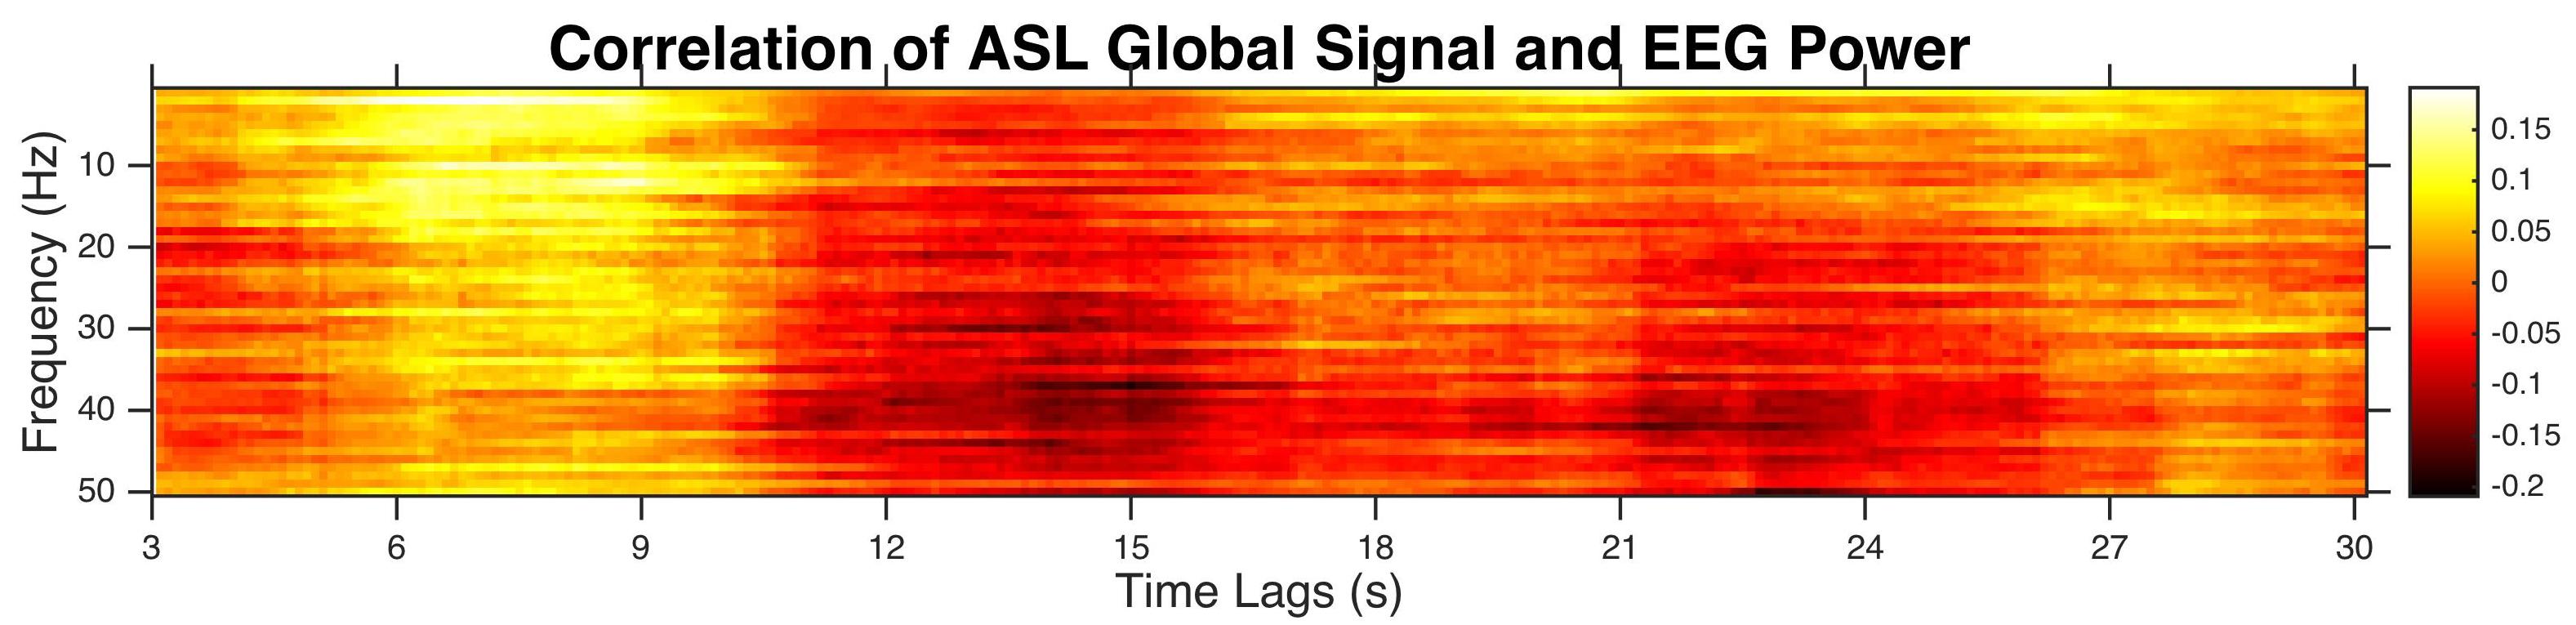
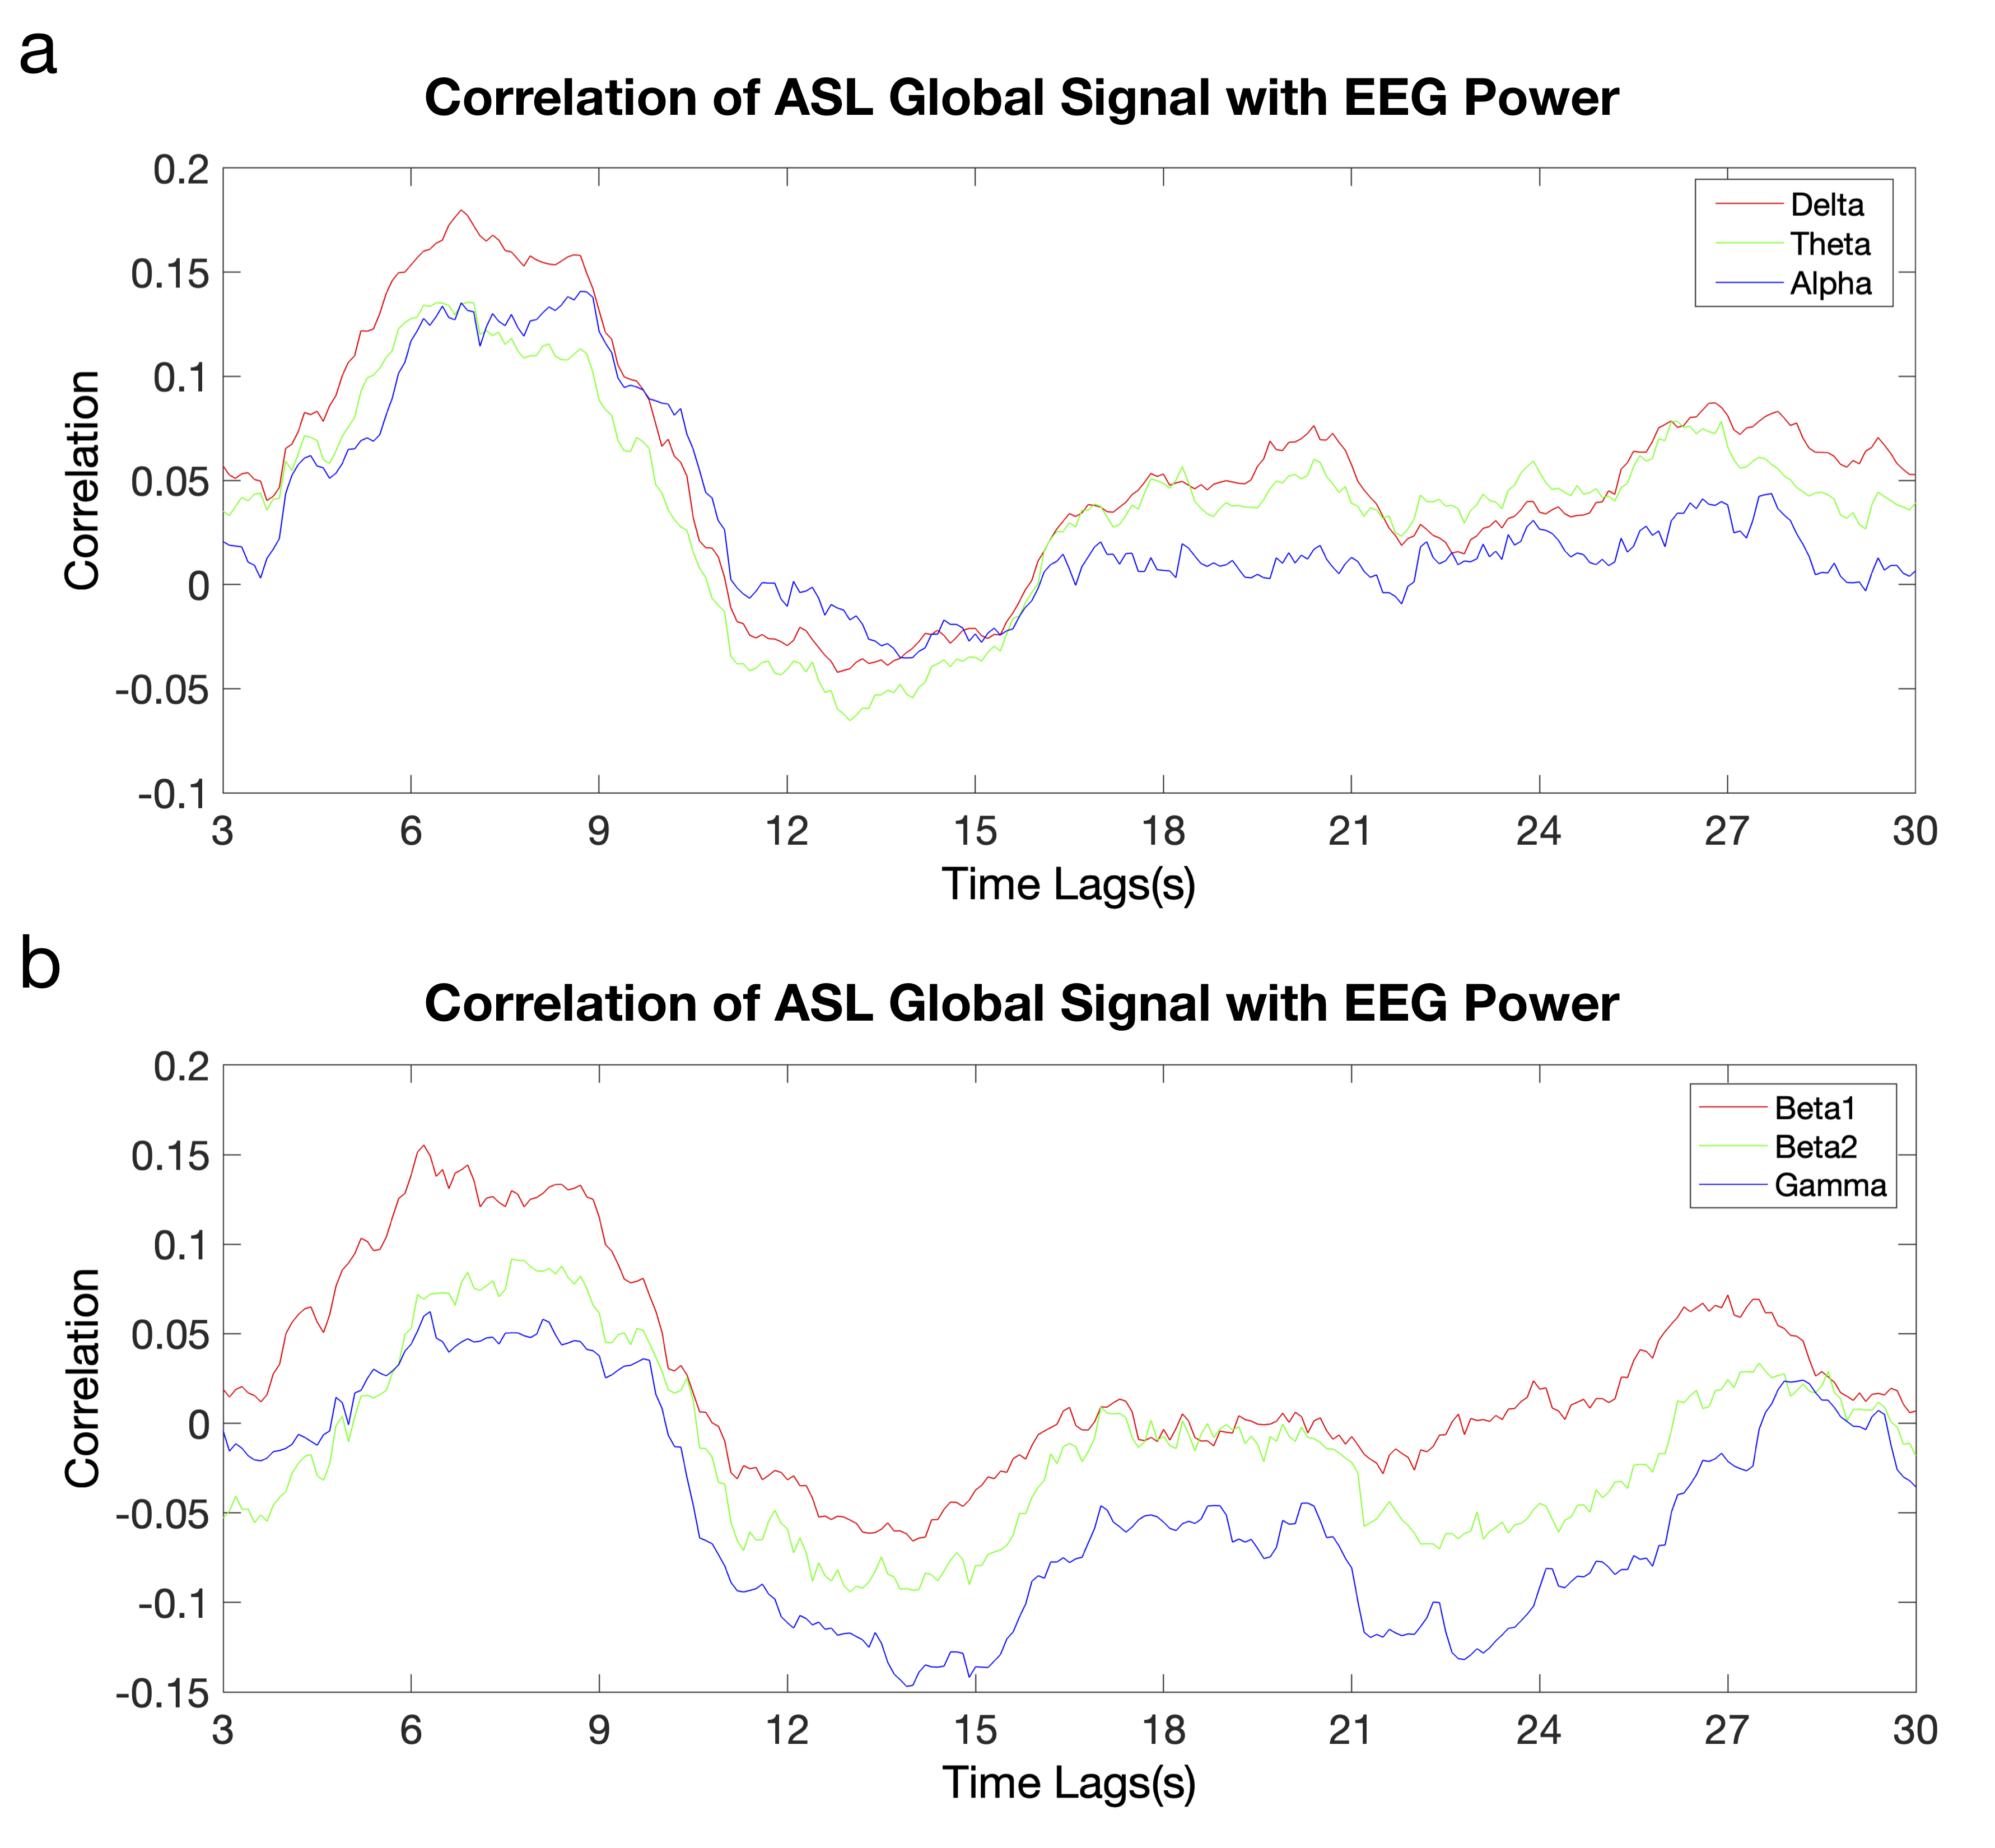
The correlation between EEG power time series and ASL global time courses (averaged across four subjects) is shown as a function of EEG frequency and time tags of ASL signal from EEG signal (Fig. 1). The correlation of EEG power with ASL global signals at the high frequencies is much weaker than the low frequencies. The weaker correlation at the higher frequency bands (e.g., smaller peak correlation in the beta2 and gamma bands) can be observed from the association between EEG/ASL correlation and time lags with different frequency bands (Fig. 2). For all the frequency bands, the correlation peaks when the global ASL signal lagged the neural signal by 6-9 s. The shape for time course of the correlation is very similar to hemodynamic response functional curve. The peak correlation time indicates that the global ASL signal fluctuations measured during the resting state is tightly coupled with underlying neural activity, which agrees well with neural basis of global fMRI signals using simultaneous fMRI and local field potentials(LFP) measures from implanted electrodes in monkeys [5]. The neural origin of global ASL signals further reveals that the function of human brain is organized by the presence of global functional synchronization.Acknowledgements
No acknowledgement found.References
Zhao L, Alsop DC, Detre JA, and Dai W, Global fluctuations of cerebral blood flow indicate a global brain network independent of systemic factors. J Cereb Blood Flow Metab, 2017:271678X17726625.
Dai W, Garcia D, de Bazelaire C, and Alsop DC, Continuous flow-driven inversion for arterial spin labeling using pulsed radio frequency and gradient fields. Magn Reson Med, 2008;60(6):1488-97.
Dai W, Varma G, Scheidegger R, and Alsop DC, Quantifying fluctuations of resting state networks using arterial spin labeling perfusion MRI. J Cereb Blood Flow Metab, 2016;36(3):463-73.
Lins O, Picton T, Berg P, and Scherg M, Ocular artifacts in EEG and event-related potentials: I. Scalp topography. Brain Topography, 1993;6(1):51-63.
Scholvinck ML, Maier A, Ye FQ, Duyn JH, and Leopold DA, Neural basis of global resting-state fMRI activity. Proc Natl Acad Sci, 2010;107(22):10238-43.
Figures