3848
Ultrafast EPI enables event-related fMRI and the mapping of hemodynamic response function in the mouse visual pathway1QBI/SBMS, The University of Queensland, Brisbane, Australia, 2QBI, The University of Queensland, Brisbane, Australia, 3QBI/CAI, The University of Queensland, Brisbane, Australia, 4SBMS/QBI, The University of Queensland, Brisbane, Australia
Synopsis
- BOLD activation by 1.5s short event can be reliably measured with ultrafast multiband EPI.
- HRF in different brain regions of the visual pathway can be derived.
- The HRF timing discrepancy may suggest timing difference in neural activity.
Introduction
Hemodynamic response (HR) of the brain is related to neuronal activity through the neurovascular coupling. Better characterization of HR function (HRF) is not only essential for fMRI analysis but also important for understanding the underlying brain processing, such as pathways and information flow. HRF can be derived from short stimuli (event), but it has been difficult to resolve in mouse fMRI due to the very low blood oxygenation level dependent (BOLD) sensitivity and typical rodent studies have been relying on block design to achieve enough detection sensitivity. In this study, we took advantage of increased sensitivity and temporal sampling of a novel ultrafast EPI to measure the event-related activation 1. Additionally, we compared the discrepancy of HRF in the visual pathway.Methods
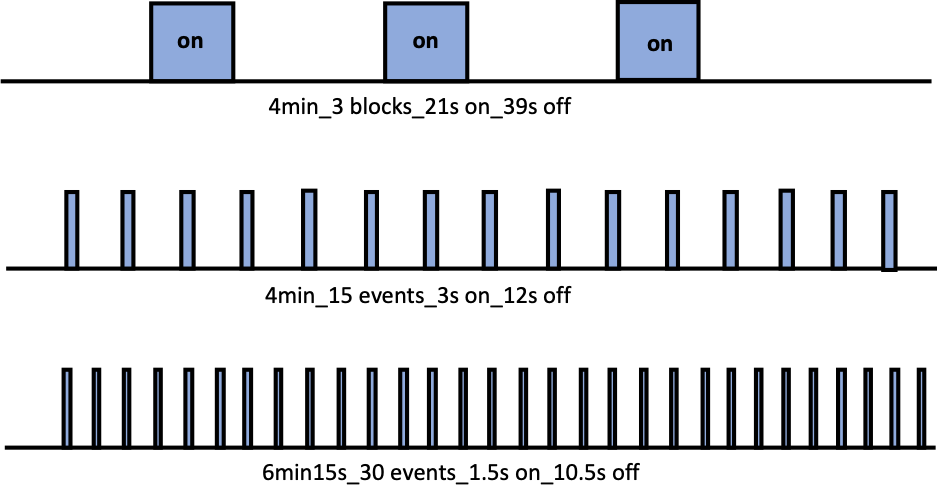
The study was approved by the animal ethic committee of the University of Queensland. Young C57BL/6 mice were sedated under 0.1mg/kg/h medetomidine and 0.25-0.5% isoflurane anesthesia for fMRI 1,2. Visual stimulation was done by flashing blue light with 20 ms pulse duration at 5 Hz. Three stimulation paradigms (Fig 1) were used in the study: 1) a block design with alternating 39 s resting and 21 s stimulation, repeated 3 times and adding another 60 s of resting at the end (total duration: 4min); 2) an event-related design with alternating 12 s resting and 3 s stimulation, repeated 15 times (4min); 3) an event-related design with alternating 10.5 s resting and 1.5 s stimulation, repeated 30 times (6min). MRI was conducted on a on a 9.4T pre-clinical scanner with a volume coil for transmit and a 10mm surface coil for receive. Time-series were acquired using multiband EPI (TR=0.3s, TE=15ms) covering the whole brain with resolution of 0.3X0.3X0.6mm 1. Data was first phase-corrected and reconstructed in Matlab, then cropped and rearranged into proper 3D volumes. Motion correction, band-pass filter (0.01–0.3 Hz), and spatial smoothing (0.6mm Gaussian kernel) were then applied to the data. Activation was detected by a general linear model (FSL). Time-courses were extracted from regions-of-interests (ROIs) defined in the visual pathway, which includes the dorsal lateral geniculate nucleus(LGd) of the thalamus, the sensory layers of the superior colliculus (SCs), the primary visual cortex (V1) and secondary visual cortex (V2) 3. HRFs of the ROIs were estimated from the averaged time series under 1.5s and 3s stimulations by fitting to a gamma-variate function. The onset time was estimated as the time to 10% of the peak in the fitted curve.Results
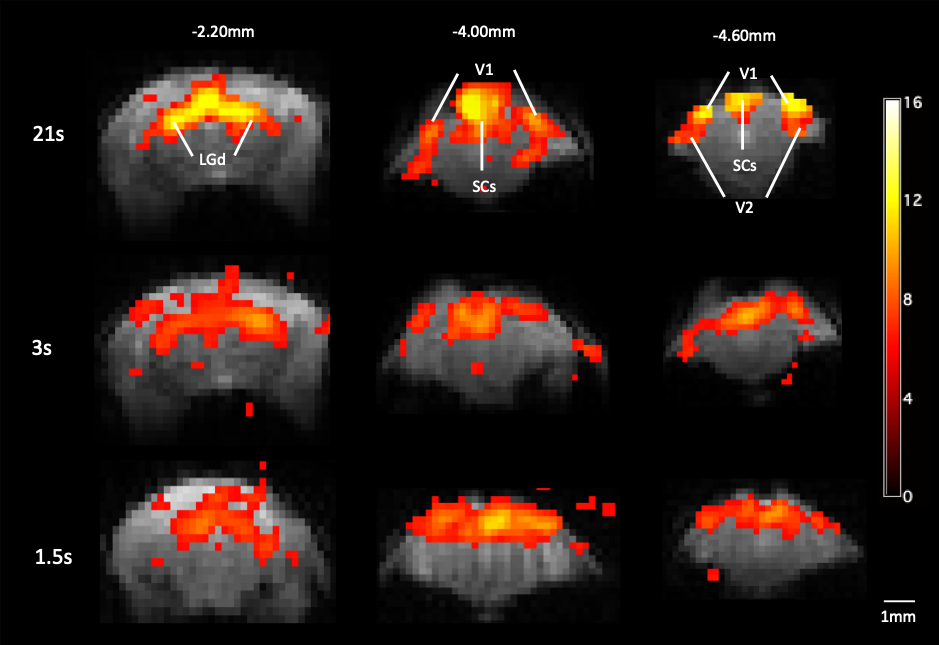
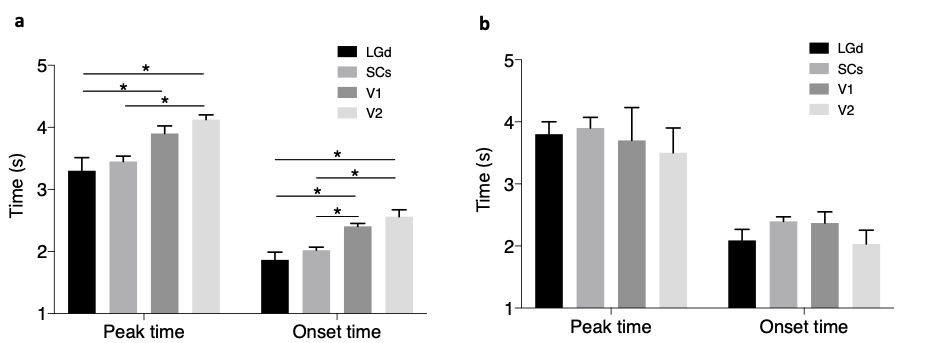
Strong bilateral BOLD responses to the visual stimuli were identified in the LGd, SCs, V1 and V2 under all 3 paradigms (Fig 2). In general, the activation of the 1.5s stimulation is weaker than that of 3s. The averaged BOLD signals in ROIs (Fig 3a, c, e, g) showed decreased activation amplitude with shorter stimulation of 3s and 1.5s compared to 21s stimulation. Parametric fitting of HRF (Fig 3b, d, f, h) indicated good fitting and slight variation among animals under 1.5s stimulation. Then we quantified temporal response of peak time and onset time in 1.5s and 3s stimulation (Fig 4). By calculating the onset time in 1.5s stimulation (Fig 4a), we found that response in LGd (1.86±0.12s) was most rapidly evoked, followed by SCs (2.02±0.50s), V1 (2.40±0.47s), and then V2 (2.56±0.22s), The time-to-peak in LGd (3.30±0.21s) is also faster than SCs (3.45±0.08s), V1 (3.90±0.12s) , and V2 (4.12±0.75s). Both onset time and time-to-peak indicate there exists response discrepancy between regions in the visual pathway (Fig 4a, *p < 0.05, repeated-measures ANOVA followed by FDR post hoc test). Importantly, the differences of time-to-peak and onset time in these brain regions are consistent with the order of information flow 4. However, the regional discrepancy was not significant under 3s stimulation (Fig 4b), showing that the 1.5s stimulation is more sensitive in detecting the temporal difference than 3s stimulation.Discussion and conclusion
Event-related fMRI was successfully conducted in mouse. With the high temporal resolution of the ultrafast EPI, HRF can be easily measured with high fidelity. By resolving HRFs in different brain regions, we found regional variation of HRFs. Moreover, the visual pathway was reconstructed by estimating the delay time of HRF, particularly using the 1.5s short event. A recent study estimated HRF in awake mouse under somatosensory, auditory and olfactory stimulations using a design mixing short and long blocks of stimulations and cryoprobe to increase the detection sensitivity 5. Using this pure event-related design, more naturalistic stimulations can be applied in rodent fMRI studies to avoid neural adaptation and allow flexibility in the design, such as mixing events and randomization. The individually characterized HRF can be used to improve detection accuracy and infer dynamics of neural processes.Acknowledgements
No acknowledgement found.References
1. Lee, H.-L., Li, Z., Coulson, E. J. & Chuang, K.-H. Ultrafast fMRI of the rodent brain using simultaneous multi-slice EPI. Neuroimage 195, 48–58 (2019).
2. Nasrallah, F. A., Tay, H. C. & Chuang, K. H. Detection of functional connectivity in the resting mouse brain. Neuroimage (2014). doi:10.1016/j.neuroimage.2013.10.025
3. Niranjan, A., Christie, I. N., Solomon, S. G., Wells, J. A. & Lythgoe, M. F. fMRI mapping of the visual system in the mouse brain with interleaved snapshot GE-EPI. Neuroimage 139, 337–345 (2016).
4. Seabrook, T. A., Burbridge, T. J., Crair, M. C. & Huberman, A. D. Architecture, Function, and Assembly of the Mouse Visual System. Annu. Rev. Neurosci. 40, 499–538 (2017).
5. Chen, X. et al. Sensory evoked fMRI paradigms in awake mice. Neuroimage 204, 116242 (2019).
Figures