3844
Amplitude of slow fluctuations in CSF as a time-resolved marker of sleep states for resting-state fMRI: a validation study.1Section on Functional Imaging Methods, NIMH, Bethesda, MD, United States, 2FMRI Facility, NIH, Bethesda, MD, United States
Synopsis
Wakefulness fluctuations during rest are a key confound for dynamic functional connectivity. Yet, tracking such fluctuations is not trivial when lacking concurrent EEG and/or eye-tracking. Recent work suggests that ultra-slow CSF fluctuations accompany descent into sleep. Here we evaluate how such fluctuations help track wakefulness in rest scans acquired on non sleep-deprived subjects using sequences not optimized for detecting such inflow-related fluctuations. We conclude that those fluctuations can be easily detected in other samples, and that they may provide valuable time-resolved information about fluctuations in wakefulness, as well as a means to segregate subjects according to their overall wakefulness levels.
Introduction
During resting fMRI scans, subjects’ level of consciousness fluctuates, yet such fluctuations are often ignored despite their confounding role when estimating dynamic functional connectivity (dFC)1. The main reason for ignoring these fluctuations is that tracking them is not easy. It either requires additional concurrent recordings (e.g., EEG2 or eye tracking) or the use of advanced analytical methods (e.g., classifiers trained on dFC estimates)3. Although simpler methods exist, they are not as robust4. Recently, it was reported that sleep is accompanied by the appearance of ultra-slow fluctuations in CSF inflow; and that such fluctuations can be identified in BOLD-fMRI rest scans optimized for their detection (i.e., TR < 500ms with the forth ventricle sitting on the bottom slices to maximize inflow weighting)2.Here we evaluate how well those findings generalize to a different pre-existing sample of 100 subjects with acquisition parameters not optimized for detecting those CSF fluctuations of interest. In particular, we study how well the amplitude of those ultra-slow CSF fluctuations track long periods of eye closure. We do this for two different ROIs, one located in the most inferior portion of the CSF, and another one in the 4th ventricle.
Methods
DATA: The first rest scan with concurrent eye tracking from 100 subjects in the S1200-7T Release from the HCP5.DATA PROCESSING: Un-preprocessed timeseries were filtered to minimize respiration signals [0.16 – 0.4Hz]. In the same step, estimates of head-motion were removed from the otherwise un-preprocessed fMRI data.
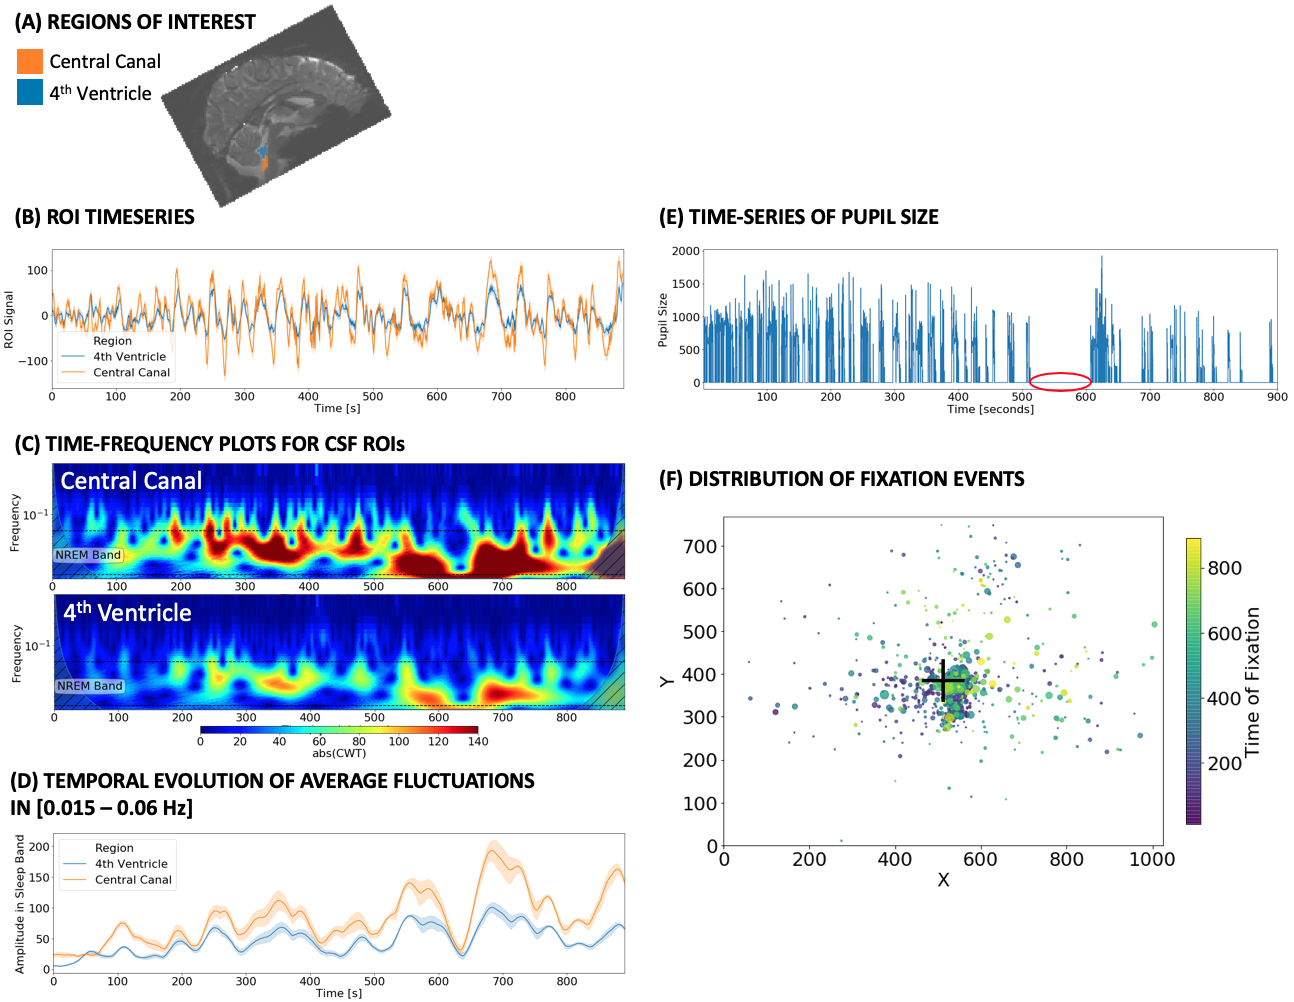
CSF SIGNAL ANALYSIS: First, we created two ROIs per subject (Fig. 1.A): one for the 4th ventricle (blue), and one for the central canal (CC; orange). The CC-ROI sits near the lower end of the imaged FOV (as the 4th ventricle did on the original study2). Then, for each ROI, we performed the following steps: 1) compute mean representative time-series (Fig 1.B); 2) generate a spectrogram (Fig. 1.C) using the continuous wavelet transform [Complex Morlet waveforms]; 3) compute the mean amplitude of fluctuations in the frequency range [0.015 – 0.06 Hz] (Fig 1.D); which corresponds to those reported to be associated with sleep; 4) calculate the area under the mean amplitude traces (AuSBF: Area under Sleep Band Fluctuations). Overall, a larger area indicates a more prominent presence of hypothesized sleep-related fluctuations in CSF for a given subject.
EYE TRACKING: HCP provides pre-processed concurrent eye-tracking data. These include, time-series of pupil size for the left eye (Fig 1.E), as well as information regarding the location of all detected fixations (Fig. 1.F). Periods with a value of zero for the eye pupil traces indicates prolonged periods of eye-closure (red circle in Fig. 1.F).
Results / Discussion
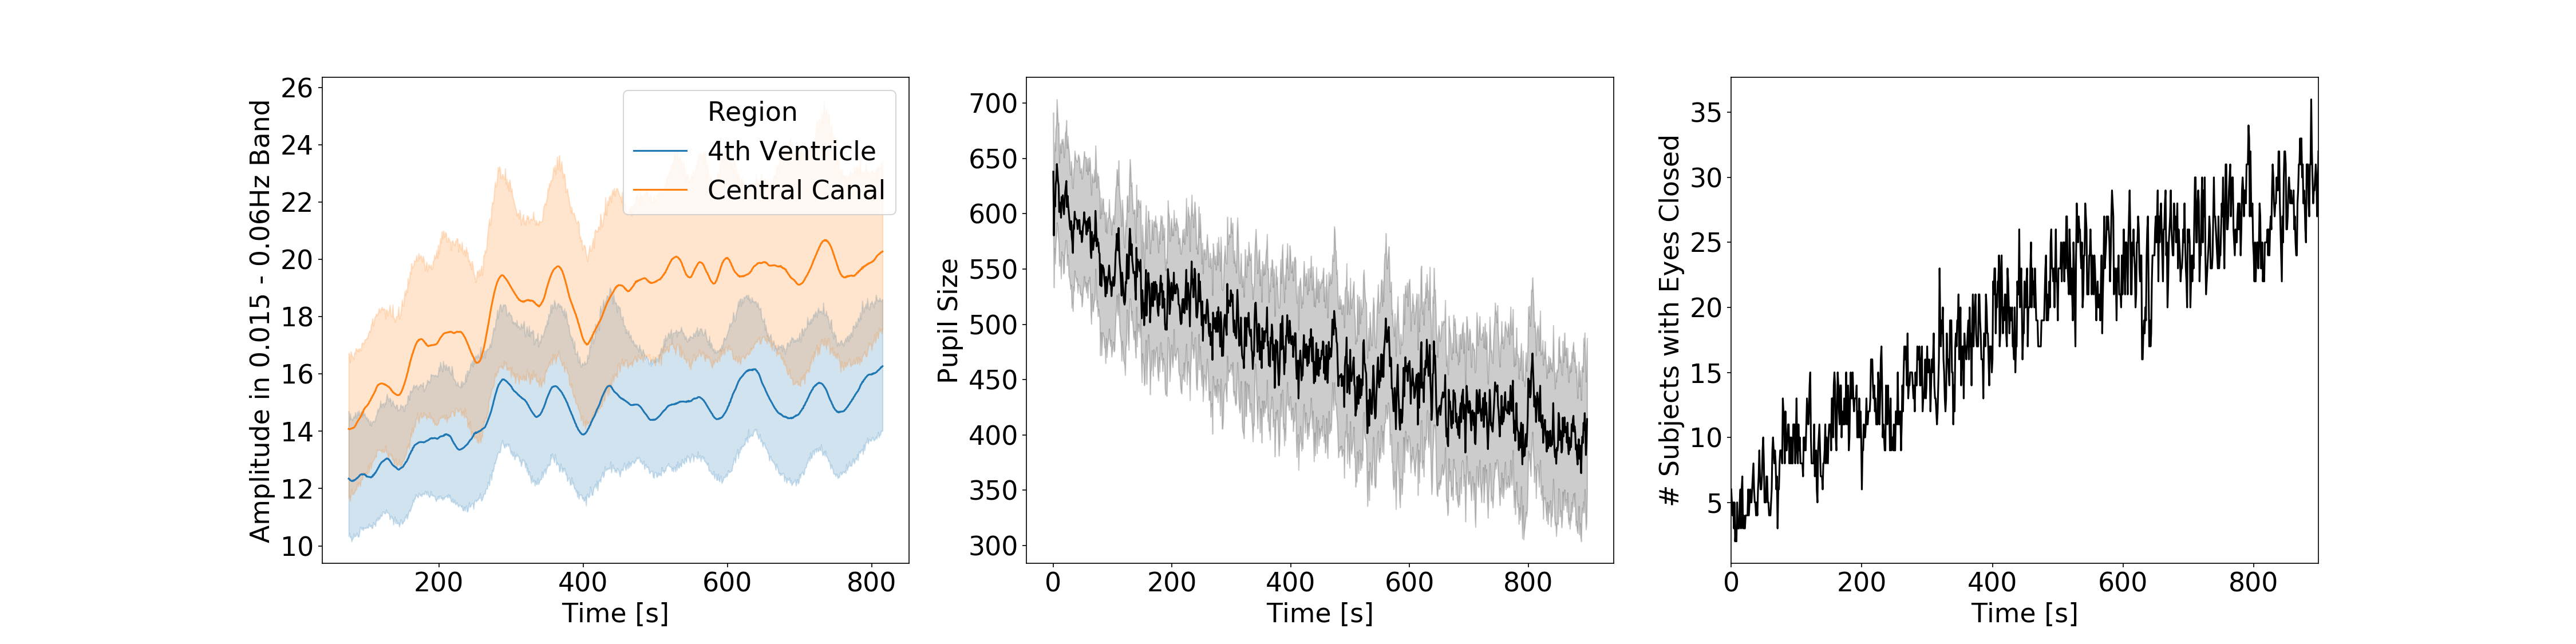
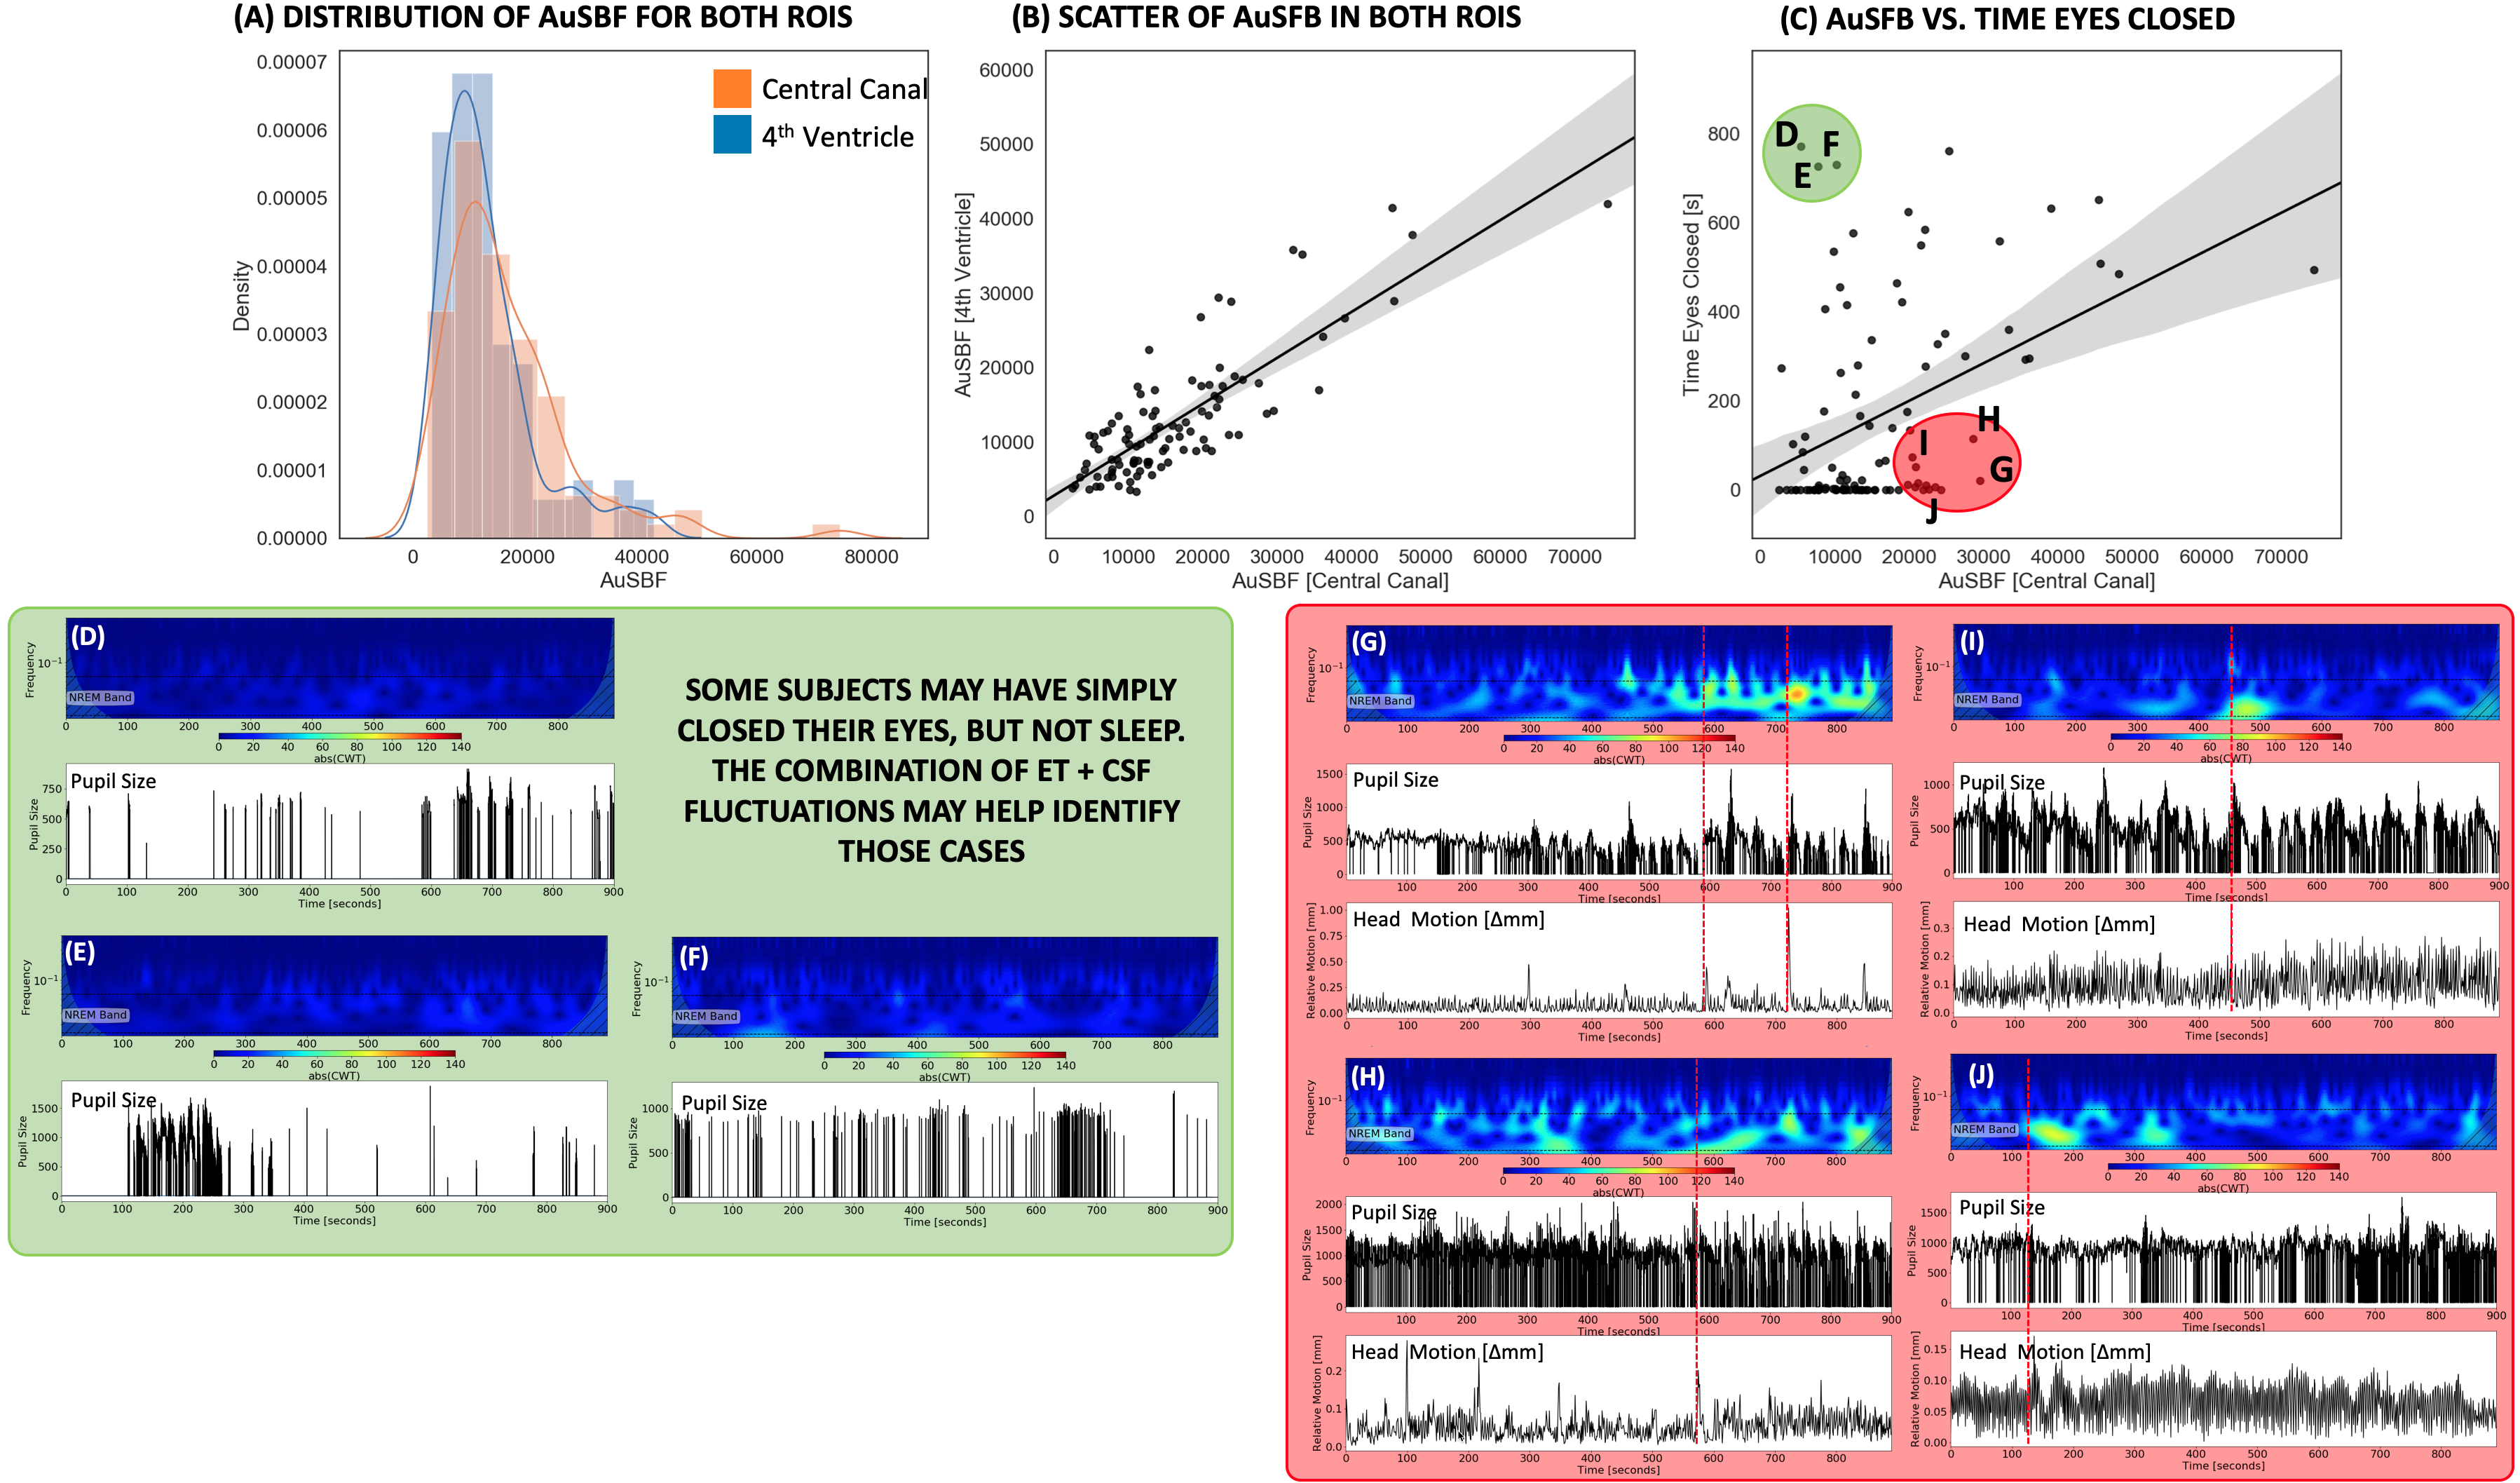
Fig.2 shows the average temporal evolution of the amplitude of CSF fluctuations in the 0.015-0.06Hz band for both ROIs (Fig. 2.A), pupil size (Fig. 2.B) and time of eye closure (Fig 2.C). Those graphs confirm previously reported trends that subjects lower their vigilance and sleep as rest scan progress6.Fig.3.A shows histograms of AuSBF for both ROIs across subjects. We can observe a Gaussian-like distributions with long right tails; which may signal a subset of subjects with lower vigilance/higher likelihood of being asleep. Fig.3.B shows a scatter plot of AuSBF for both ROIs against each other. The linear relationship suggests both ROIs contain similar information. Fig.3.C shows a scatter of AuSBF in the Central Canal against total duration of eye closure. Overall, subjects with higher AuSBF tend to have their eyes closed longer; yet one can also observe subjects with long periods of eye closure that lack slow fluctuations in CSF (green circle; Fig.3D-F). Those could correspond to non-compliant subjects that did not kept eyes open yet did not fall slept. It is also possible that ultra-slow CSF fluctuations in these subjects were weaker or even absent. In addition, we can also observe slow CSF fluctuations in the absence of sleep for some subjects (red circle; Fig.3G-J). Close inspection suggests that, in some instances, power in this band may be a result of motion spikes (dashed red lines), yet drowsiness cannot be fully discarded.
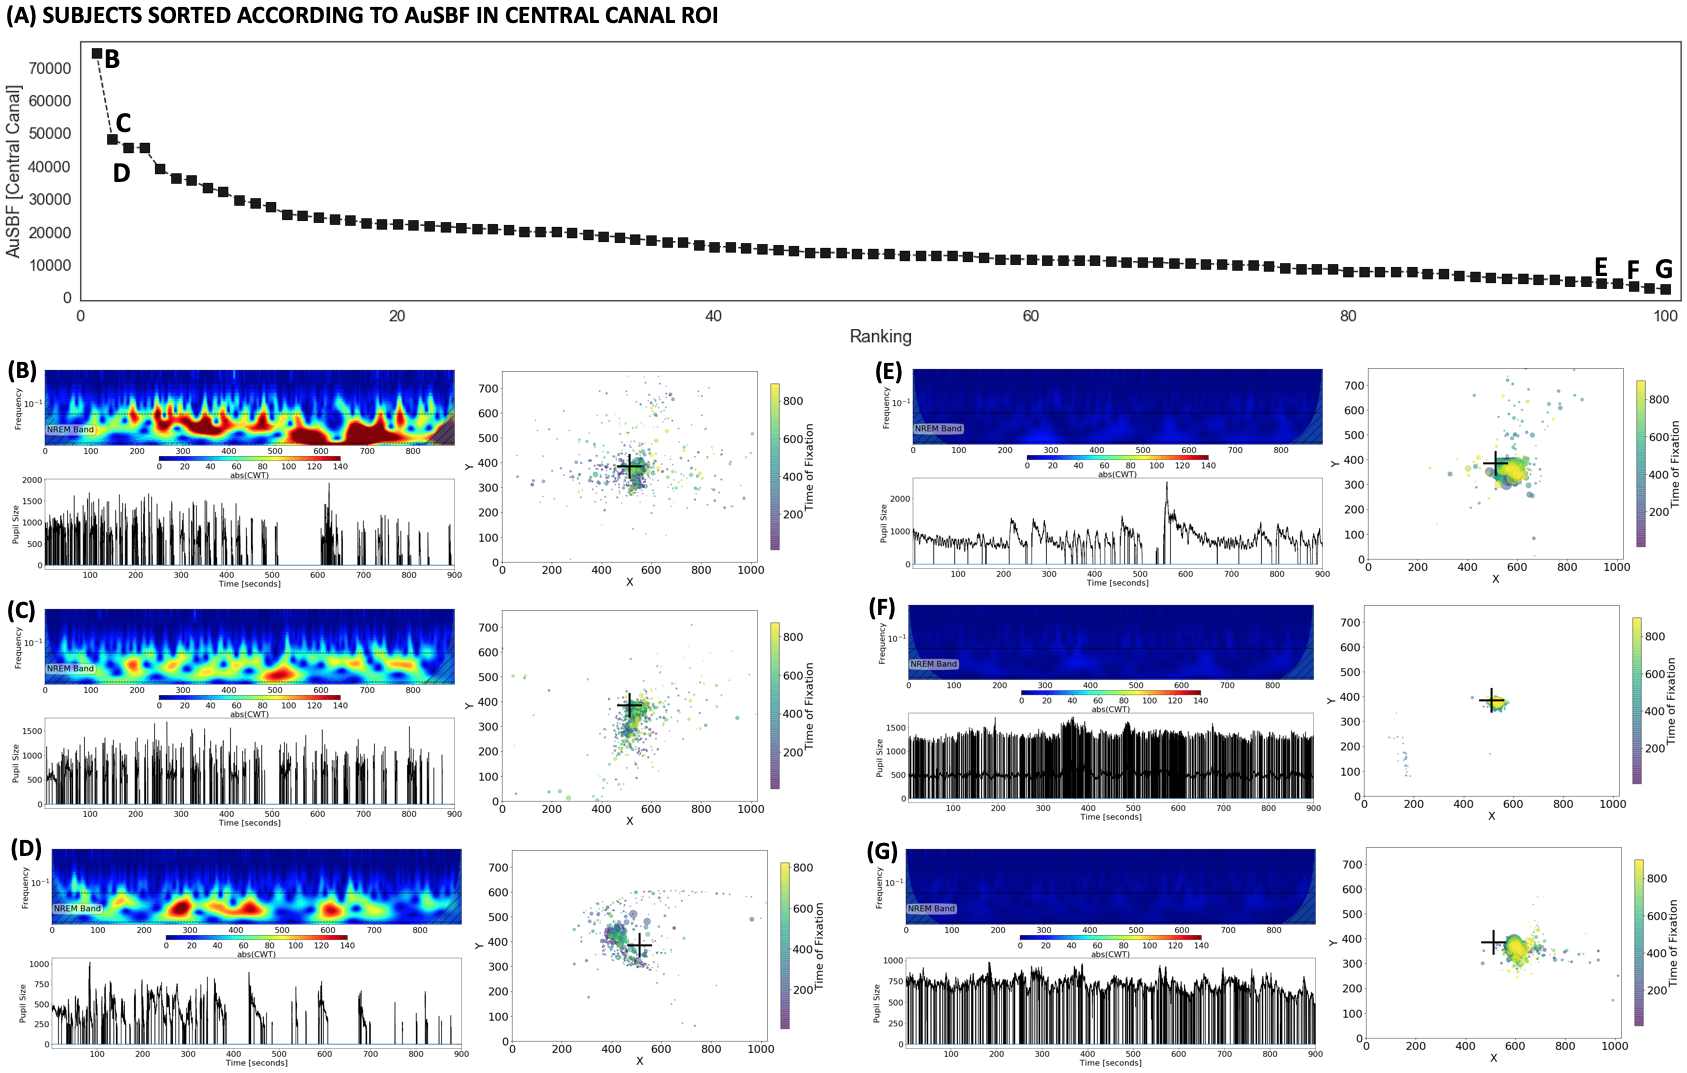
Finally, Fig.4.A shows sorted values of AuSBF for all 100 subjects. A small set of subjects had elevated AuSBF compared to the rest of the sample (Fig. 4.B-D; see examples). Those all correspond to subjects with long periods of eye closure, and inaccurate and variable fixations away from the center of the screen. On the other end of the tail, subjects with minimal AuSBF kept eyes open and fixated as requested (Fig. 4.E-G; see examples). Overall, based on the ET data, AuSBF seems to be a valuable indicator to separate subjects according to wakefulness levels during resting scans.
Conclusions
Slow CSF fluctuations, possibly associated with sleep, can be detected in previously acquired data not optimized for their detection. Those fluctuations may still be present during awake rest, likely due to motion artifacts. Slow fluctuations in CSF can help easily identify subjects with different wakefulness levels during rest scans when no other information (EEG, ET) is available; and may help account for its confounding effects in FC analyses. Future work should evaluate concordance with other methods such as those based on brain templates4 and dFC estimates3.Acknowledgements
The authors thank Laura Lewis for providing valuable information regarding her original work. This research was possible thanks to the support of the National Institute of Mental Health Intramural Research Program. Portions of this study used the high-performance computational capabilities of the Biowulf Linux cluster at the National Institutes of Health, Bethesda, MD (biowulf.nih.gov). This study is part of NIH clinical protocol number NCT00001360 and protocol ID 93-M-0170. Resting-state data were provided by the Human Connectome Project, WU-Minn Consortium (Principal Investigators: David Van Essen and Kamil Ugurbil; 1U54MH091657) funded by the 16 NIH Institutes and Centers that support the NIH Blueprint for Neuroscience Research; and by the McDonnell Center for Systems Neuroscience at Washington University.References
1. Laumann, T.O., et al., On the Stability of BOLD fMRI Correlations. Cereb Cortex, 2017. 27(10): p. 4719-4732.
2. Fultz, N.E., et al., Coupled electrophysiological, hemodynamic, and cerebrospinal fluid oscillations in human sleep. Science, 2019. 366(6465): p. 628-631.
3. Tagliazucchi, E., et al., Automatic sleep staging using fMRI functional connectivity data. Neuroimage, 2012. 63(1): p. 63-72.
4. Falahpour, M., et al., Template-based prediction of vigilance fluctuations in resting-state fMRI. Neuroimage, 2018. 174: p. 317-327.
5. Van Essen, D.C., et al., The WU-Minn Human Connectome Project: an overview. Neuroimage, 2013. 80: p. 62-79.
6. Tagliazucchi, E. and H. Laufs, Decoding wakefulness levels from typical fMRI resting-state data reveals reliable drifts between wakefulness and sleep. Neuron, 2014. 82(3): p. 695-708.
Figures