3843
Investigating Cerebral and Cardiac Blood Flow and Cerebral Oxygen Extraction Concurrently During and Immediately after Exercise1University of Nottingham, Nottingham, United Kingdom
Synopsis
To investigate the integrated impact of exercise on cardiac (CI) and cerebral (CBF) blood flow and oxygenation (OEF), measures were made concurrently in older active males at rest, during steady-state exercise and recovery. There was high association between aortic and biplane CI measures, and CBF increases with CI. Exercise induced increases in CI, CBF and the cerebral metabolic rate of oxygen (CMRO2), which were not seen on recovery. OEF was inversely associated with CI at rest, and increased on recovery. Exercise and recovery changes support the need for and highlight the utility of in-scanner exercise studies to investigate cardiovascular regulation.
INTRODUCTION
We live in an increasingly ageing population, understanding the mechanisms of the ageing process and the role of environmental factors, such as physical activity levels, in modulating these responses is key. Changes in brain structure and function with ageing have recently been associated with decreased physical activity levels by both this and other research groups1,2,3,4. The overarching aim of this study is to investigate changes in brain structure and function (cerebral perfusion and oxygen extraction), and cardiac function in sedentary, healthy older men and age and gender matched healthy, lifelong exercisers to understand the effects of physical activity on age-related changes. To do this, MR measures are collected during exercise, with initial data presented outlining this study.METHODS
Data was collected in 5 participants (4 older males, age 72.2±2.6 years, BMI 24.6±1.46kg/m2, three endurance cyclists and one power athlete, 1 young male 36 years).VO2max: Participants underwent a supine incremental exercise test (Cardiospect ergometer, Ergospect) to determine steady-state carbon dioxide production (VCO2) and oxygen consumption, including maximal oxygen consumption (VO2max). Additionally, arterilaised-venous blood sample was collected at each increment for blood acid-base status and lactate determination.
Task: In a 3T Ingenia scanner, MRI measures were taken at rest, during 10 minutes of steady-state exercise at 50% VO2max, and during 10 minutes recovery immediately following exercise.
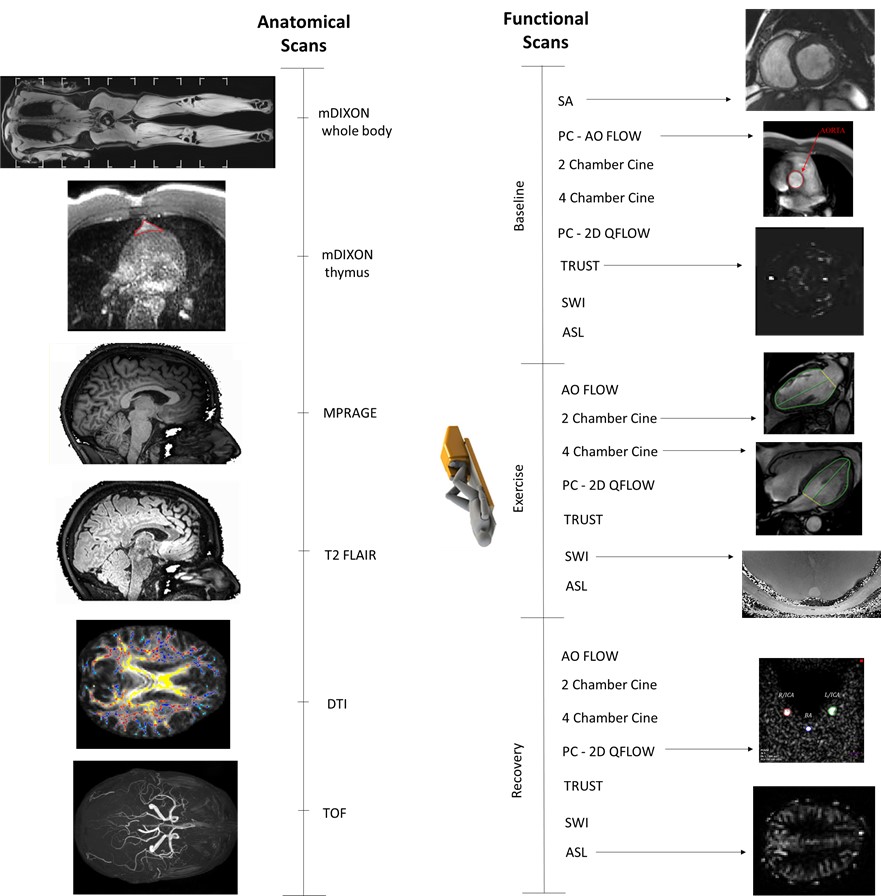
MRI measures: Cardiac output measured by aortic flow from PC-MRI, and 2-chamber and 4-chamber cine; cerebral blood flow (CBF) using PC-MRI of left and right cerebral arteries and the basilar artery; arterial spin-labelling (ASL) to measure brain perfusion, T2-relaxation-under-spin-tagging (TRUST) and susceptibility weighted imaging (SWI) for brain venous oxygenation (Yv) and oxygen extraction fraction (OEF). At baseline only, a short-axis cardiac cine was collected as well as anatomical measures including a whole body and thymus-specific mDIXON for body fat/muscle composition and fat-fraction, an MPRAGE for brain structure, and diffusion tensor imaging for fractional anisotropy (Figure 1). Additionally, cognitive and motor function measures were taken.
Data analysis: Cardiac data was analysed using Viewforum (AO FLOW) and Intellispace (short-axis and 2/4-ch cine), and corrected for body surface area to yield cardiac index (CI), PC-MRI data were analysed using Q-Flow (Philips) for vessel area, velocity and flux in the L/R ICA and BA. The flow from all three vessels was summed and corrected for grey-matter (GM) volume to obtain GM corrected cerebral blood flow (gmCBF). TRUST data were processed following methods of Lu et al5 with the sagittal sinus signal formed from label-control images, and the calculated T2 relaxation converted into Yv using a calibration plot. OEF was calculated as the difference between arterial oxygenation (Ya) and Yv. GM-corrected cerebral metabolic rate of oxygen (gmCMRO2) was quantified as described by Peng et al6 accounting for age and sex.
RESULTS
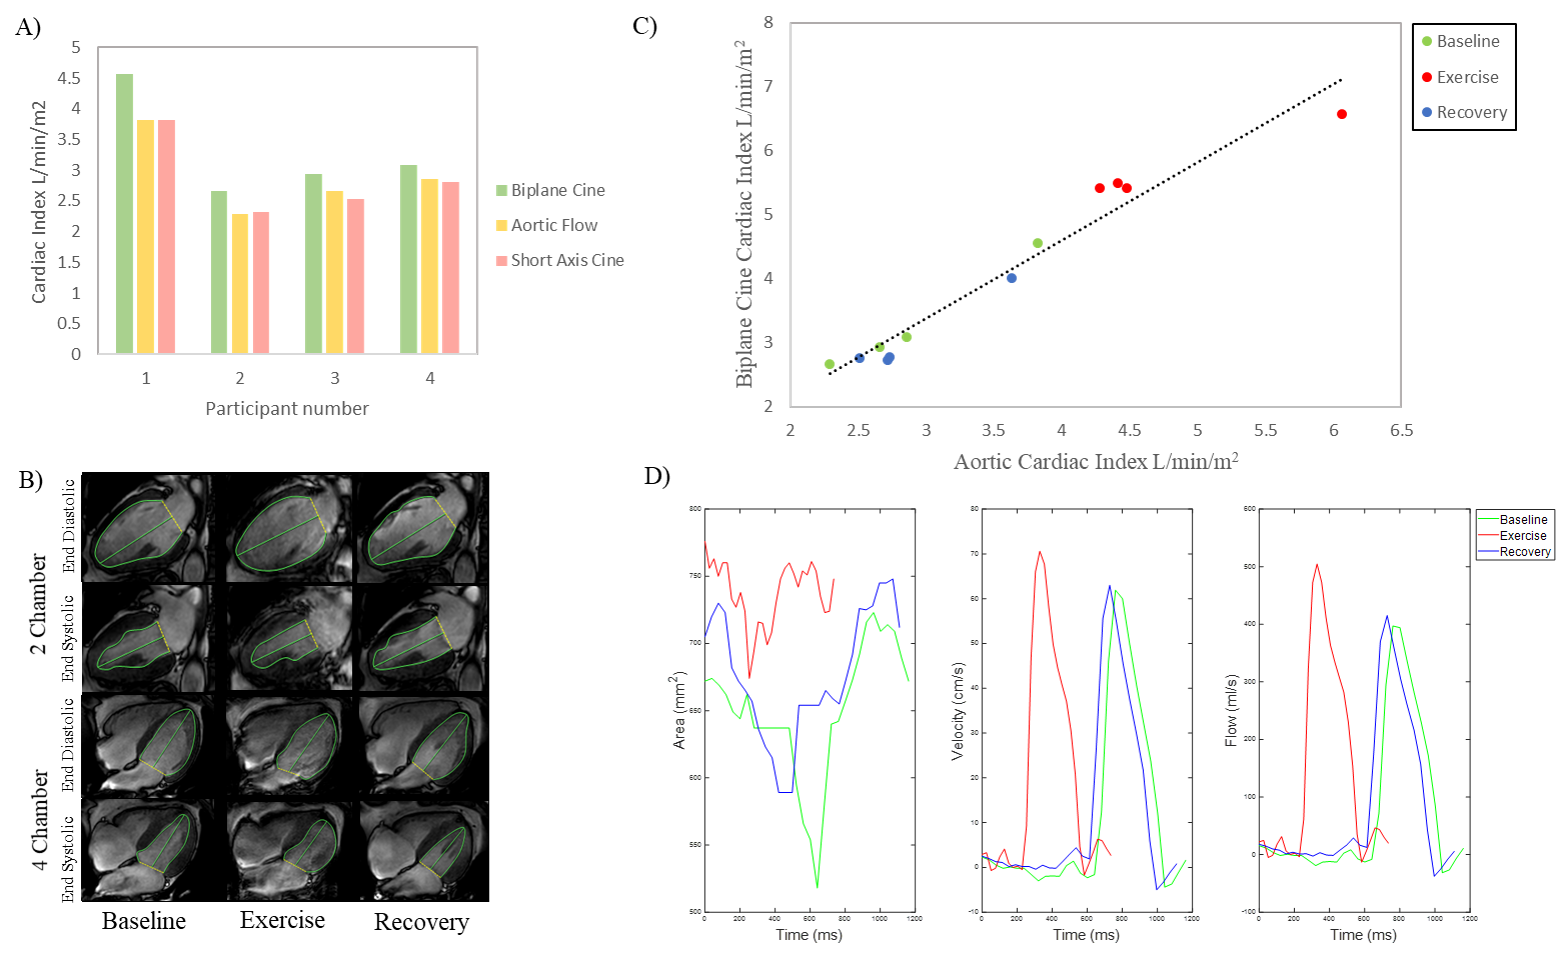
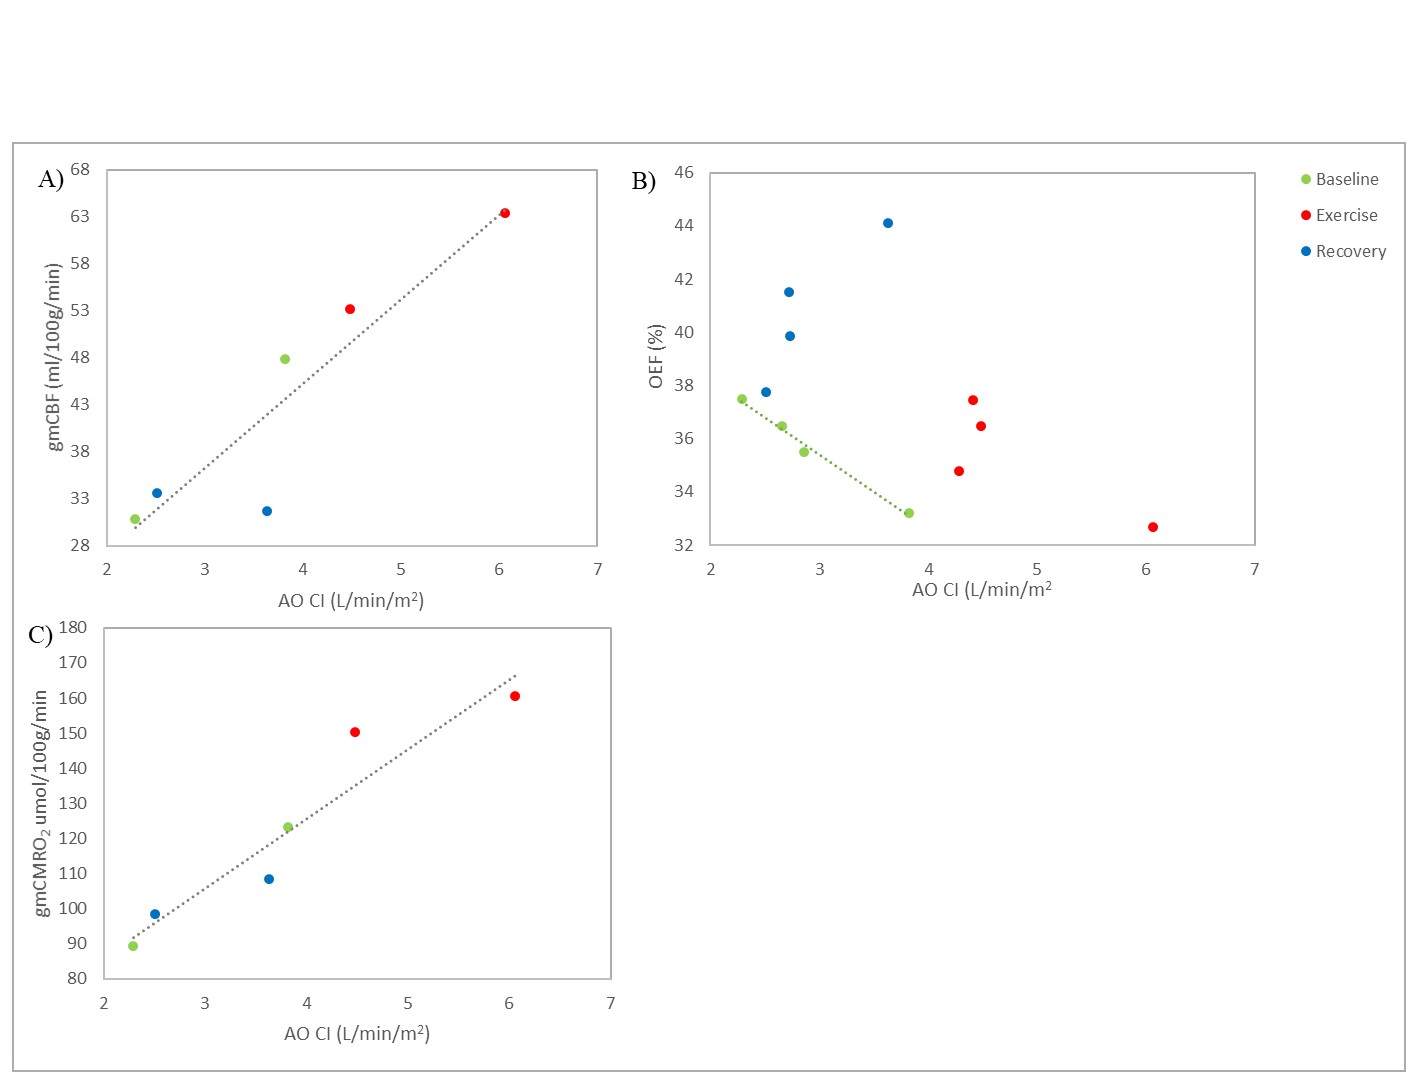
Participants’ cardiovascular fitness measures and changes in heart rate during exercise are summarized in Table 1A. Figure 2A compares the three baseline measures of cardiac index (biplane cine, aortic flow, and short-axis cine). CI measures at baseline, exercise and recovery are plotted in Figure 2B showing a significant correlation between biplane cine and aortic flow measures (R2 = 0.945, p <0.001). Figure 3 shows percent changes from baseline for exercise and recovery periods. All participants showed an increase in cardiac index during exercise (aortic flow: 67.4±10.0%, biplane cine: 77.8±12.6%), returning to baseline levels for the recovery period (aortic flow: 0.59±3.50%, biplane cine: -6.3±3.7%). gmCBF increased on exercise (52.6±20.1%) and returned towards baseline during recovery (n=1: increase 9%, n=1: decrease 33%, from baseline). TRUST OEF shows little change from baseline to exercise (0.85±1.22%) and an increase to recovery (15.0±6.8%). gmCMRO2 increased by 49.3±18.8% during exercise and returned to baseline during recovery, 1.00±11.0%. Figure 4 outlines the relationship between cardiac and cerebral measures. Greater cardiac index (AO CI) is linked to increased cerebral blood flow (gmCBF), across all conditions, (R2 = .847, p = 0.009). The relationship between oxygen extraction and cardiac output is more complex. At rest, a greater CI predicts lower OEF (R2 = 0.989, p = 0.005), but exercise and recovery show more variability, AO CI and gmCMRO2 show a strong correlation (R2 = 0.908 , p = 0.003), greater cardiac index indicating greater metabolic rate of oxygen in the brain.DISCUSSION
It has been demonstrated these methods allow the concurrent investigation of both cardiac and cerebral blood flow responses to exercise and recovery in a single scan session. The same methods will be collected on a greater number of participants, including a sedentary age matched control group. This should allow for the comparison of cardiovascular variables in the resting state and in response to exercise and recovery in sedentary and lifelong exerciser.CONCLUSION
These methods outline above proved a complete protocol to assess changes in brain structure and function (cerebral perfusion and oxygen extraction) and cardiac function during and after recovery from exercise. These results highlight that to examine the effects of exercise, it is essential participants are scanned during exercise; results of scans taken after exercising outside the scanner will reflect the recovery period rather than capturing the physiological effects of exercise.Acknowledgements
Research was supported by the MRC-ARUK Centre for Musculoskeletal Ageing Research.References
1. Batouli, S. A. H., & Saba, V. (2017). At least eighty percent of brain grey matter is modifiable by physical activity: A review study. Behavioural Brain Research, Vol. 332.
2. Szabo, A. N., McAuley, E., Erickson, K. I., Voss, M., Prakash, R. S., Mailey, E. L., Kramer, A. F. (2011). Cardiorespiratory fitness, hippocampal volume, and frequency of forgetting in older adults. Neuropsychology, 25(5),
3. Tseng, B. Y., Uh, J., Rossetti, H. C., Cullum, C. M., Diaz-Arrastia, R. F., Levine, B. D., Zhang, R. (2013). Masters athletes exhibit larger regional brain volume and better cognitive performance than sedentary older adults. Journal of Magnetic Resonance Imaging, 38(5), 1169–1176.
4. Hale, A. P. (2017). Application of MR to Identify Metabolic and Physiological Correlates of Human Ageing and Inactivity. University of Nottingham, (Doctoral Dissertation).
5. Lu, H., & Ge, Y. (2008). Quantitative evaluation of oxygenation in venous vessels using T2‐relaxation‐under‐spin‐tagging MRI. Magnetic Resonance in Medicine: An Official Journal of the International Society for Magnetic Resonance in Medicine, 60(2), 357-363.
6. Peng, S.-L., Dumas, J. A., Park, D. C., Liu, P., Filbey, F. M., McAdams, C. J., Lu, H. (2014). Age-related increase of resting metabolic rate in the human brain. NeuroImage, 98, 176–183.
Figures