3842
BOLD and CBV nonlinear responses during a hand movement task with increasing movement rates using 3D-EPI VASO at 7T1Spinoza Centre for Neuroimaging, Amsterdam, Netherlands, 2Experimental and Applied Psychology, VU University, Amsterdam, Netherlands, 3Experimental Psychology, Helmholtz Institute, Utrecht University, Utrecht, Netherlands, 4Radiology, University Medical Centre Utrecht, Utrecht, Netherlands
Synopsis
We used 3D-EPI VASO to simultaneously measure CBV and BOLD signal changes in the primary motor cortex. We aimed to investigate differences in neurovascular coupling as measured by BOLD and CBV signal changes during a hand movement task with increasing movement rates. In agreement with previous findings, the BOLD response was found to behave nonlinearly with respect to the movement rate. Remarkably, the CBV response amplitude also shows a similar and strong nonlinear behavior where the amplitude saturates at fast movement rates (≥ 1 Hz).
Introduction
When interpreting functional MRI signals, we generally assume a linear coupling between neuronal and the observed vascular signals (neurovascular coupling). However, blood oxygenation level-dependent (BOLD) responses, neuronal activity, and behavior are often mismatched [1]–[3]. For example, an increase in the stimulus rate is not followed by a matching proportional increase in the BOLD response when assuming a linear relationship, as has been demonstrated in cortical responses with increasing hand movement rates[1]. One of the hypotheses for the observed nonlinear relationship is that the BOLD responses from non-specific draining vessels saturate at fast stimulus rates, i.e. a vascular origin). Cerebral blood volume (CBV) measurements are an alternative fMRI approach to BOLD. The Vascular Space Occupancy (VASO) [4] contrast is sensitive to arteriole CBV changes and promises higher microvascular specificity, thus better spatial localization of the neuronal activity with reduced contamination of the draining veins compared to BOLD [5], [6]. We hypothesize that VASO CBV responses will show a reduced vascular nonlinearity effect with increasing hand movement rates, indicating a higher microvascular specificity and thereby tighter neurovascular coupling.Methods
Five healthy volunteers (age 23-40 years, 3 males) participated in the study. Imaging was performed on a 7T scanner (Philips) using a 32-channel receive coil (Nova Medical). SS-SI VASO data were recorded using a 3D EPI readout [7] with the following parameters: TI1/TI2/TE/TRVASO=1100/2600/17/3000ms, 1.5mm isotropic voxels, 14 slices, FOV=192×192×21mm3, matrix size=128×128, partial Fourier factor=0.78 and SENSEinplane factor=2.5, volumes=154, total scan time (per movement rate)=7min42s. We computed an optimal flip angle sweep, flip angles=14.4°, 14.9°, 15.4°, 15.9°, 16.5°, 17.2°, 17.9°, 18.7°, 19.6°, 20.6°, 21.8°, 23.2°, 25.0°, 27.1°, 30.0°, to reduce blurring in the slice encoding direction [8].Participants were asked to move their right hand on a visual cue from a rest position to a loosely clenched fist at five different movement rates: ~0.33, 0.5, 1, 1.5, and 2 Hz. A task trial consisted of 12 seconds of movement followed by 24 seconds of rest. In total, 12 trials were performed per movement rate. The five movement rates were performed in a randomized order across subjects. Hand movements were recorded using a DataGlove 5 Ultra MRI (5DT) with a sampling rate of 1/120Hz. The recorded responses were used to calculate the actual executed movement rate and to check the subject’s task performance. Data processing consisted of motion correction for BOLD and VASO images separately, followed by a BOLD correction scheme to correct the VASO data for BOLD signal contamination [5]. We used SPM12 and in-house scripts (Python and R) to analyze the data. The region of interest (ROI) for the movement rate response assessment was obtained from an additional run using the same paradigm (movement rate of 1.0Hz). The ROI contained the common set of BOLD and VASO voxels with a Z-statistic value>3.2 from a GLM analysis were located within the gray matter mask from a co-registered segmented high-resolution T1w MP2RAGE.Results
Figure 1 illustrates the functional paradigm and task performance. Figure 2 shows the CBV and BOLD activation maps from a single participant across all movement rates. In both cases, the signal changes increase with the movement rate. The CBV activation maps were less spatially extended and with reduced amplitude than the BOLD activation maps. Figure 3 shows the group-averaged percentage signal change (CBV and BOLD) across movement rates. Both BOLD and CBV responses show a linear relationship for movement rates < 1Hz (depicted by the dashed line in Figure 4) and saturation for ≥1Hz. To highlight the similar response behaviour between CBV and BOLD with increasing movement rate, we normalized the responses by the signal amplitude for the movement rate at which the response starts to saturate ((1 Hz), shown in Figure 4). This not only highlights the response saturation but also allows a more direct comparison, taking into account any sensitivity differences between BOLD and CBV-VASO signal changes. Figure 5 shows the averaged timecourse across trials.Discussion & Conclusion
Our findings show a very similar hemodynamic response behaviour between CBV and BOLD signal changes for different hand movement rates. We found a tight relationship between BOLD and CBV responses, both increasing with movement rate, and saturating at higher movement rates ≥1Hz. Interestingly, other modalities such CBF mapping have found comparable nonlinear response behavior [9]. The presumed higher microvascular specificity of CBV-VASO compared to BOLD does not directly result in a more linear relationship at high hand movement rates.Acknowledgements
No acknowledgement found.References
[1] J. C. W. Siero, D. Hermes, H. Hoogduin, P. R. Luijten, N. Petridou, and N. F. Ramsey, “BOLD consistently matches electrophysiology in human sensorimotor cortex at increasing movement rates: A combined 7T fMRI and ECoG study on neurovascular coupling,” J. Cereb. Blood Flow Metab., vol. 33, no. 9, pp. 1448–1456, 2013.
[2] D. Hermes, J. C. W. Siero, E. J. Aarnoutse, F. S. S. Leijten, N. Petridou, and N. F. Ramsey, “Dissociation between neuronal activity in sensorimotor cortex and hand movement revealed as a function of movement rate,” J. Neurosci., vol. 32, no. 28, pp. 9736–9744, 2012.
[3] D. A. Soltysik, K. K. Peck, K. D. White, B. Crosson, and R. W. Briggs, “Comparison of hemodynamic response nonlinearity across primary cortical areas,” Neuroimage, vol. 22, no. 3, pp. 1117–1127, Jul. 2004.
[4] H. Lu, X. Golay, J. J. Pekar, and P. C. M. van Zijl, “Functional magnetic resonance imaging based on changes in vascular space occupancy,” Magn. Reson. Med., vol. 50, no. 2, pp. 263–274, Aug. 2003.
[5] T. Jin and S. G. Kim, “Improved cortical-layer specificity of vascular space occupancy fMRI with slab inversion relative to spin-echo BOLD at 9.4 T,” Neuroimage, vol. 40, no. 1, pp. 59–67, 2008.
[6] L. Huber et al., “Cortical lamina-dependent blood volume changes in human brain at 7T,” Neuroimage, vol. 107, pp. 23–33, 2015.
[7] L. Huber et al., “Techniques for blood volume fMRI with VASO: From low-resolution mapping towards sub-millimeter layer-dependent applications,” Neuroimage, vol. 164, no. November, pp. 131–143, Jan. 2018.
[8] N. D. Gai, S. L. Talagala, and J. A. Butman, “Whole-brain cerebral blood flow mapping using 3D echo planar imaging and pulsed arterial tagging,” J. Magn. Reson. Imaging, vol. 33, no. 2, pp. 287–295, 2011.
[9] K. L. Miller et al., “Nonlinear temporal dynamics of the cerebral blood flow response,” Hum. Brain Mapp., vol. 13, no. 1, pp. 1–12, 2001.
Figures
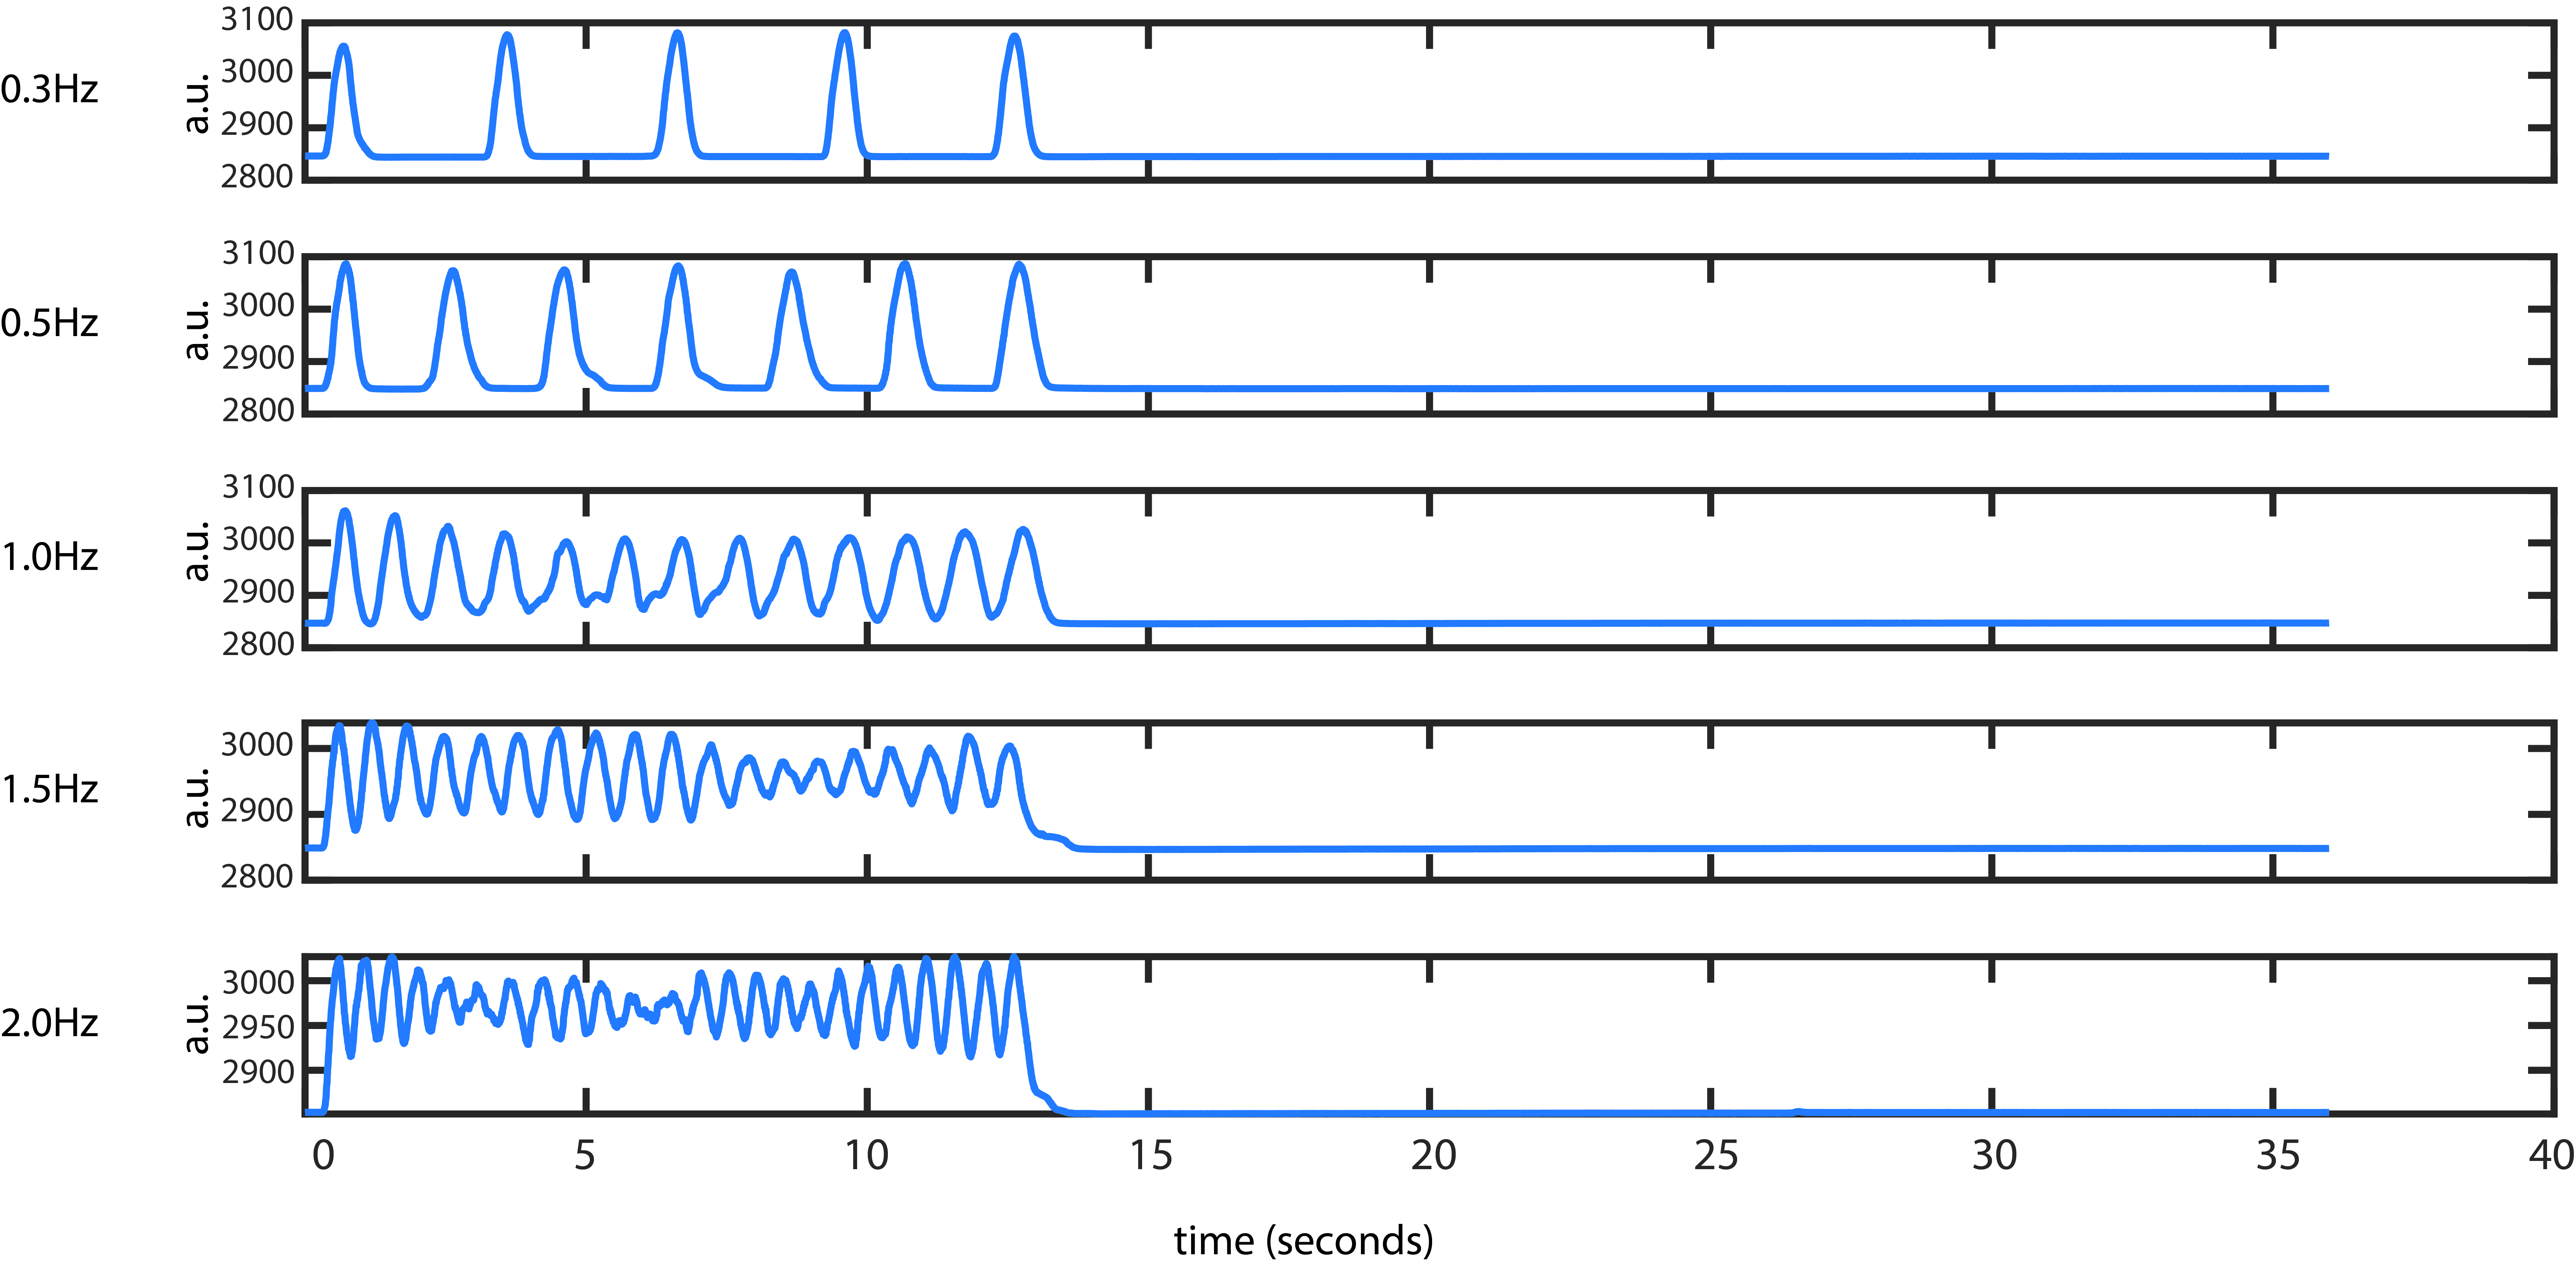
Figure 1: Single-subject dataglove traces, averaged across 12 trials.
The subplots illustrate the functional paradigm and task performance. From top to bottom, hand movement rates ~0.33, 0.5, 1, 1.5, and 2 Hz, the hand movements were performed during 12 seconds followed by 24 seconds of rest. The dataglove data was used to check for task performance and to calculate the actual performed movement rate for each subject.
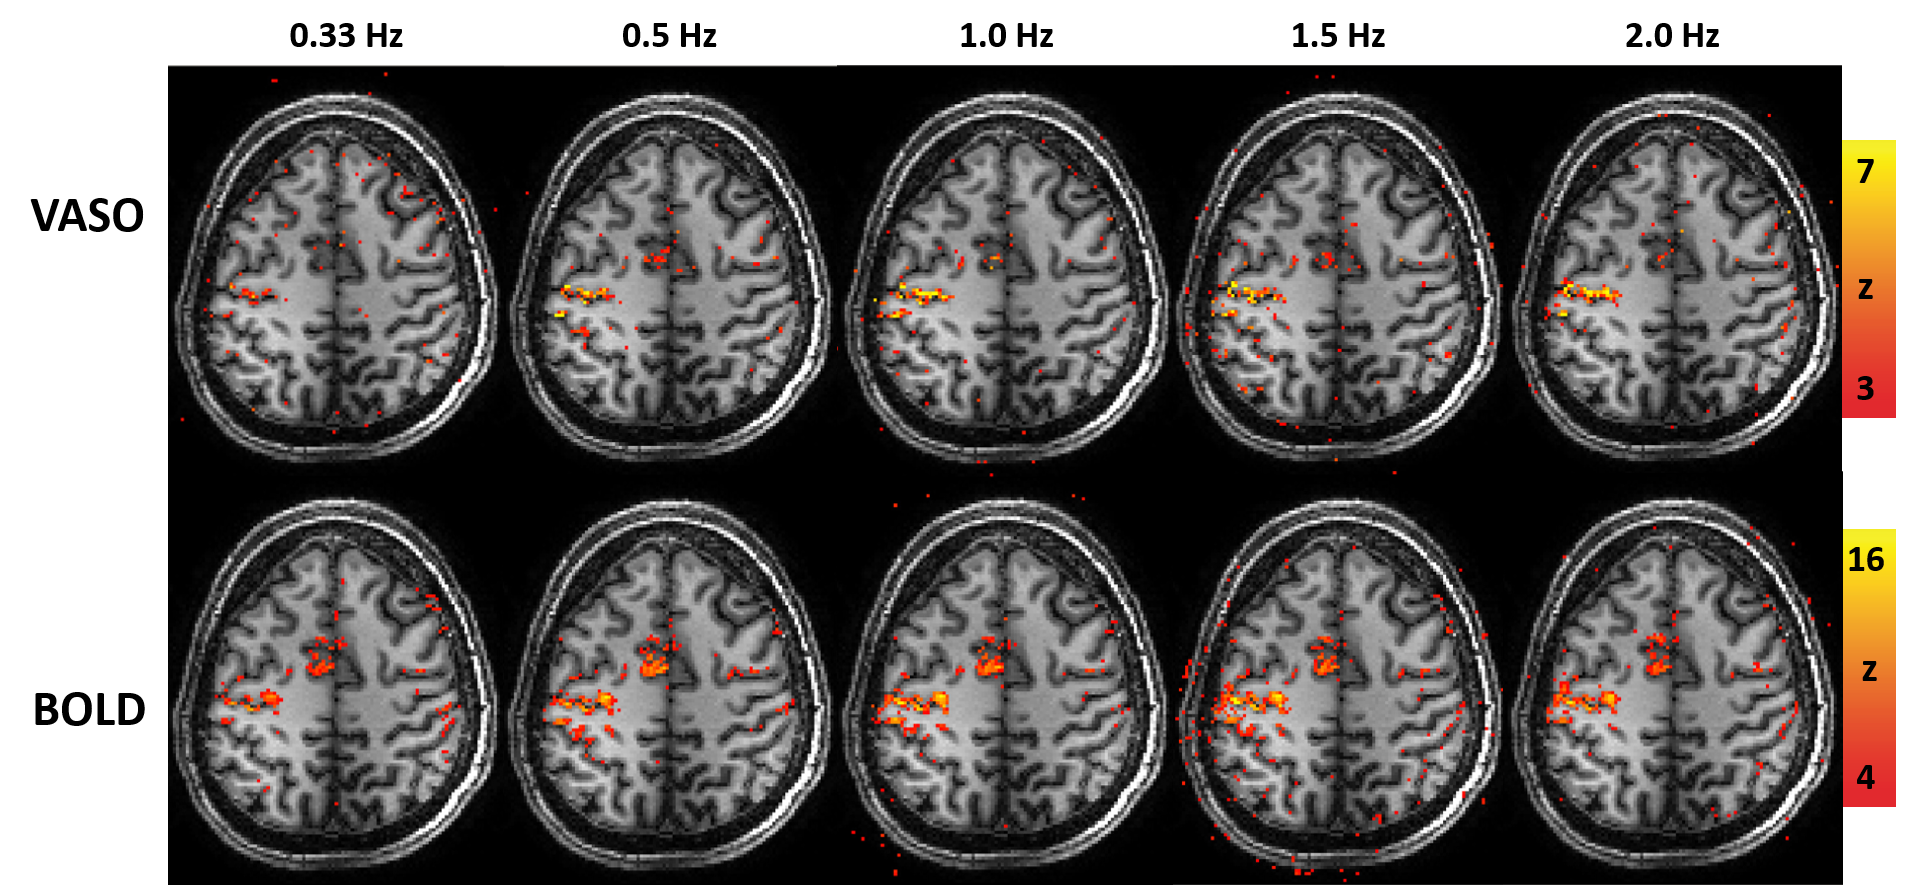
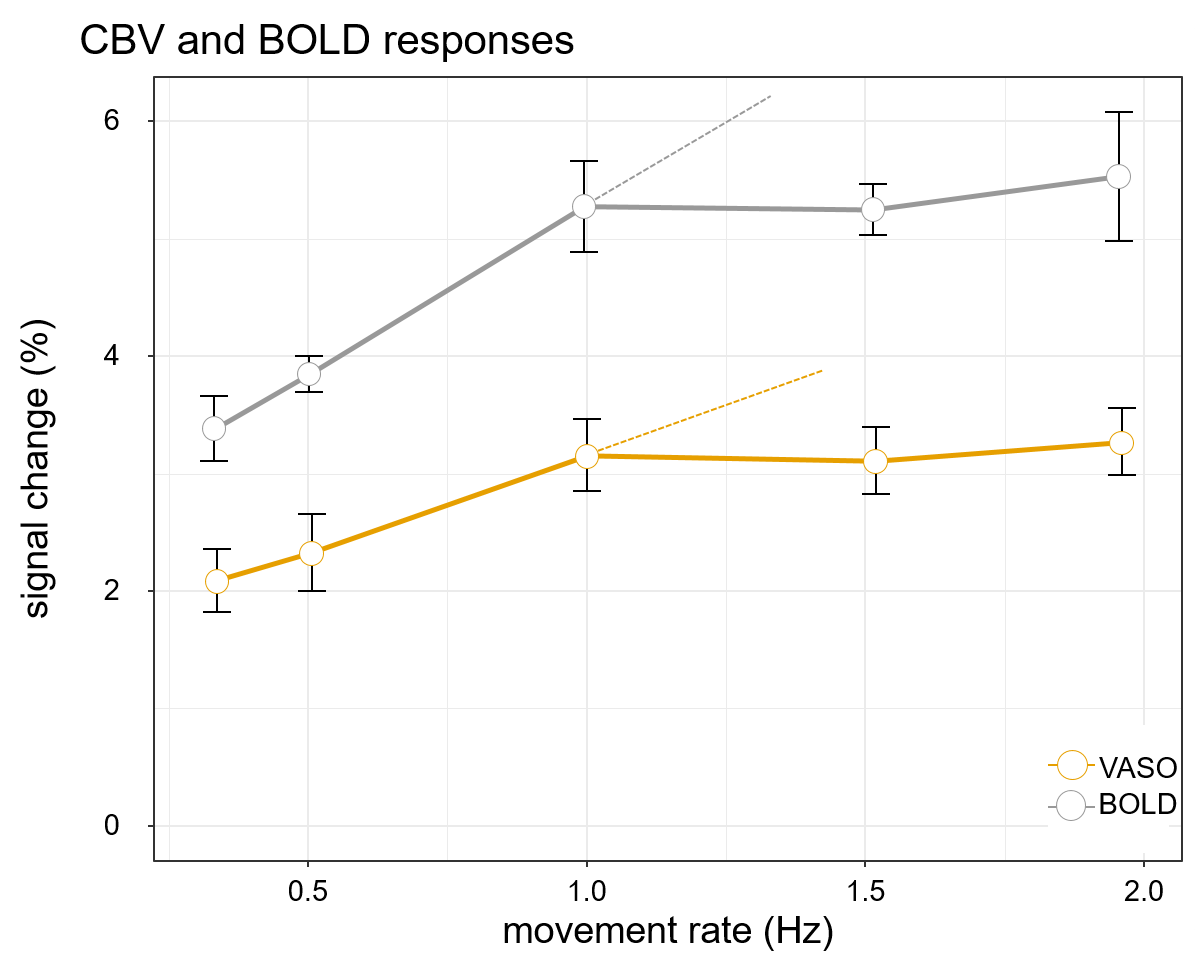
Figure 3: CBV and BOLD responses across different frequencies
Linear trend (dashed line) in both CBV and BOLD, shows the signal should behave in a linear system, and also shows that for higher movement rates(⩾ 1Hz) both response amplitudes saturate.
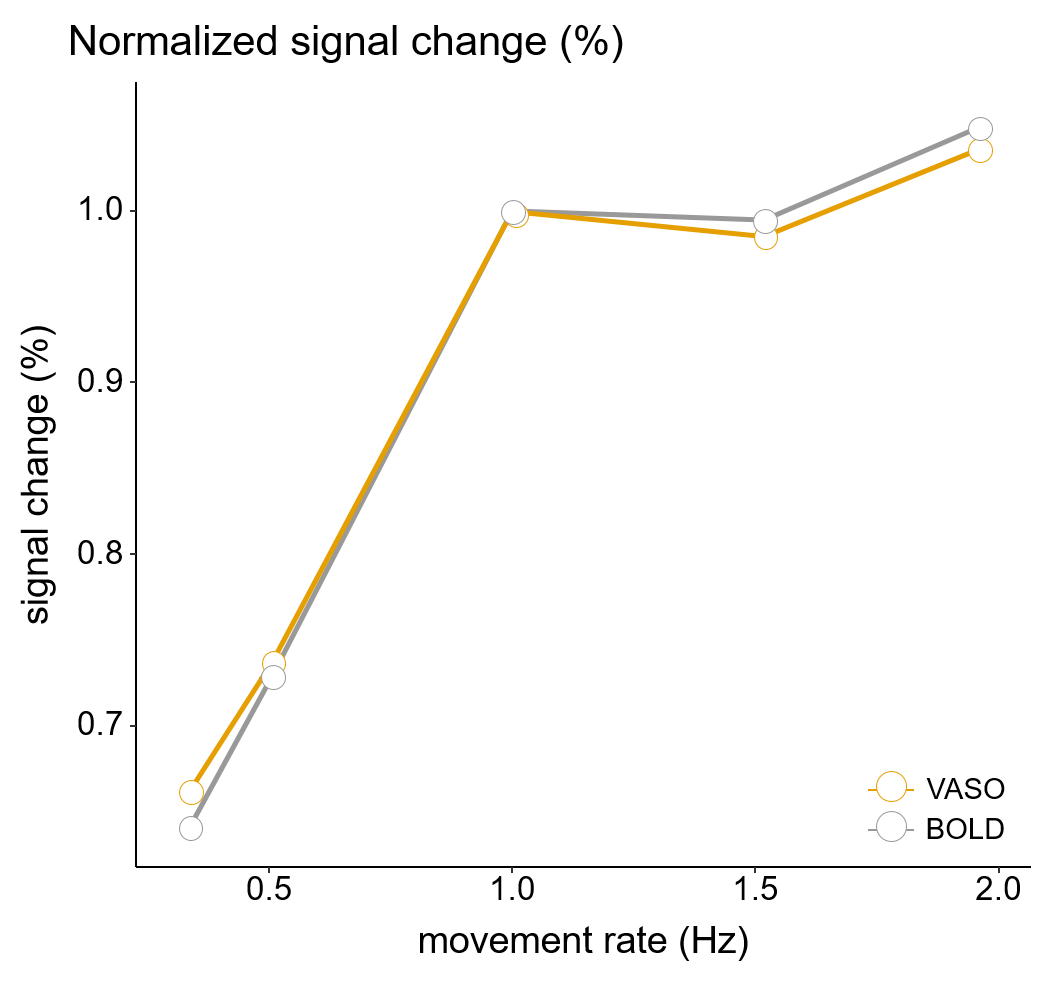
Figure 4: Normalized percentage signal change for BOLD and CBV
Normalizing the relative signal change with respect to 1 Hz highlights that both CBV and BOLD signals show a similar nonlinear response amplitude relationship.
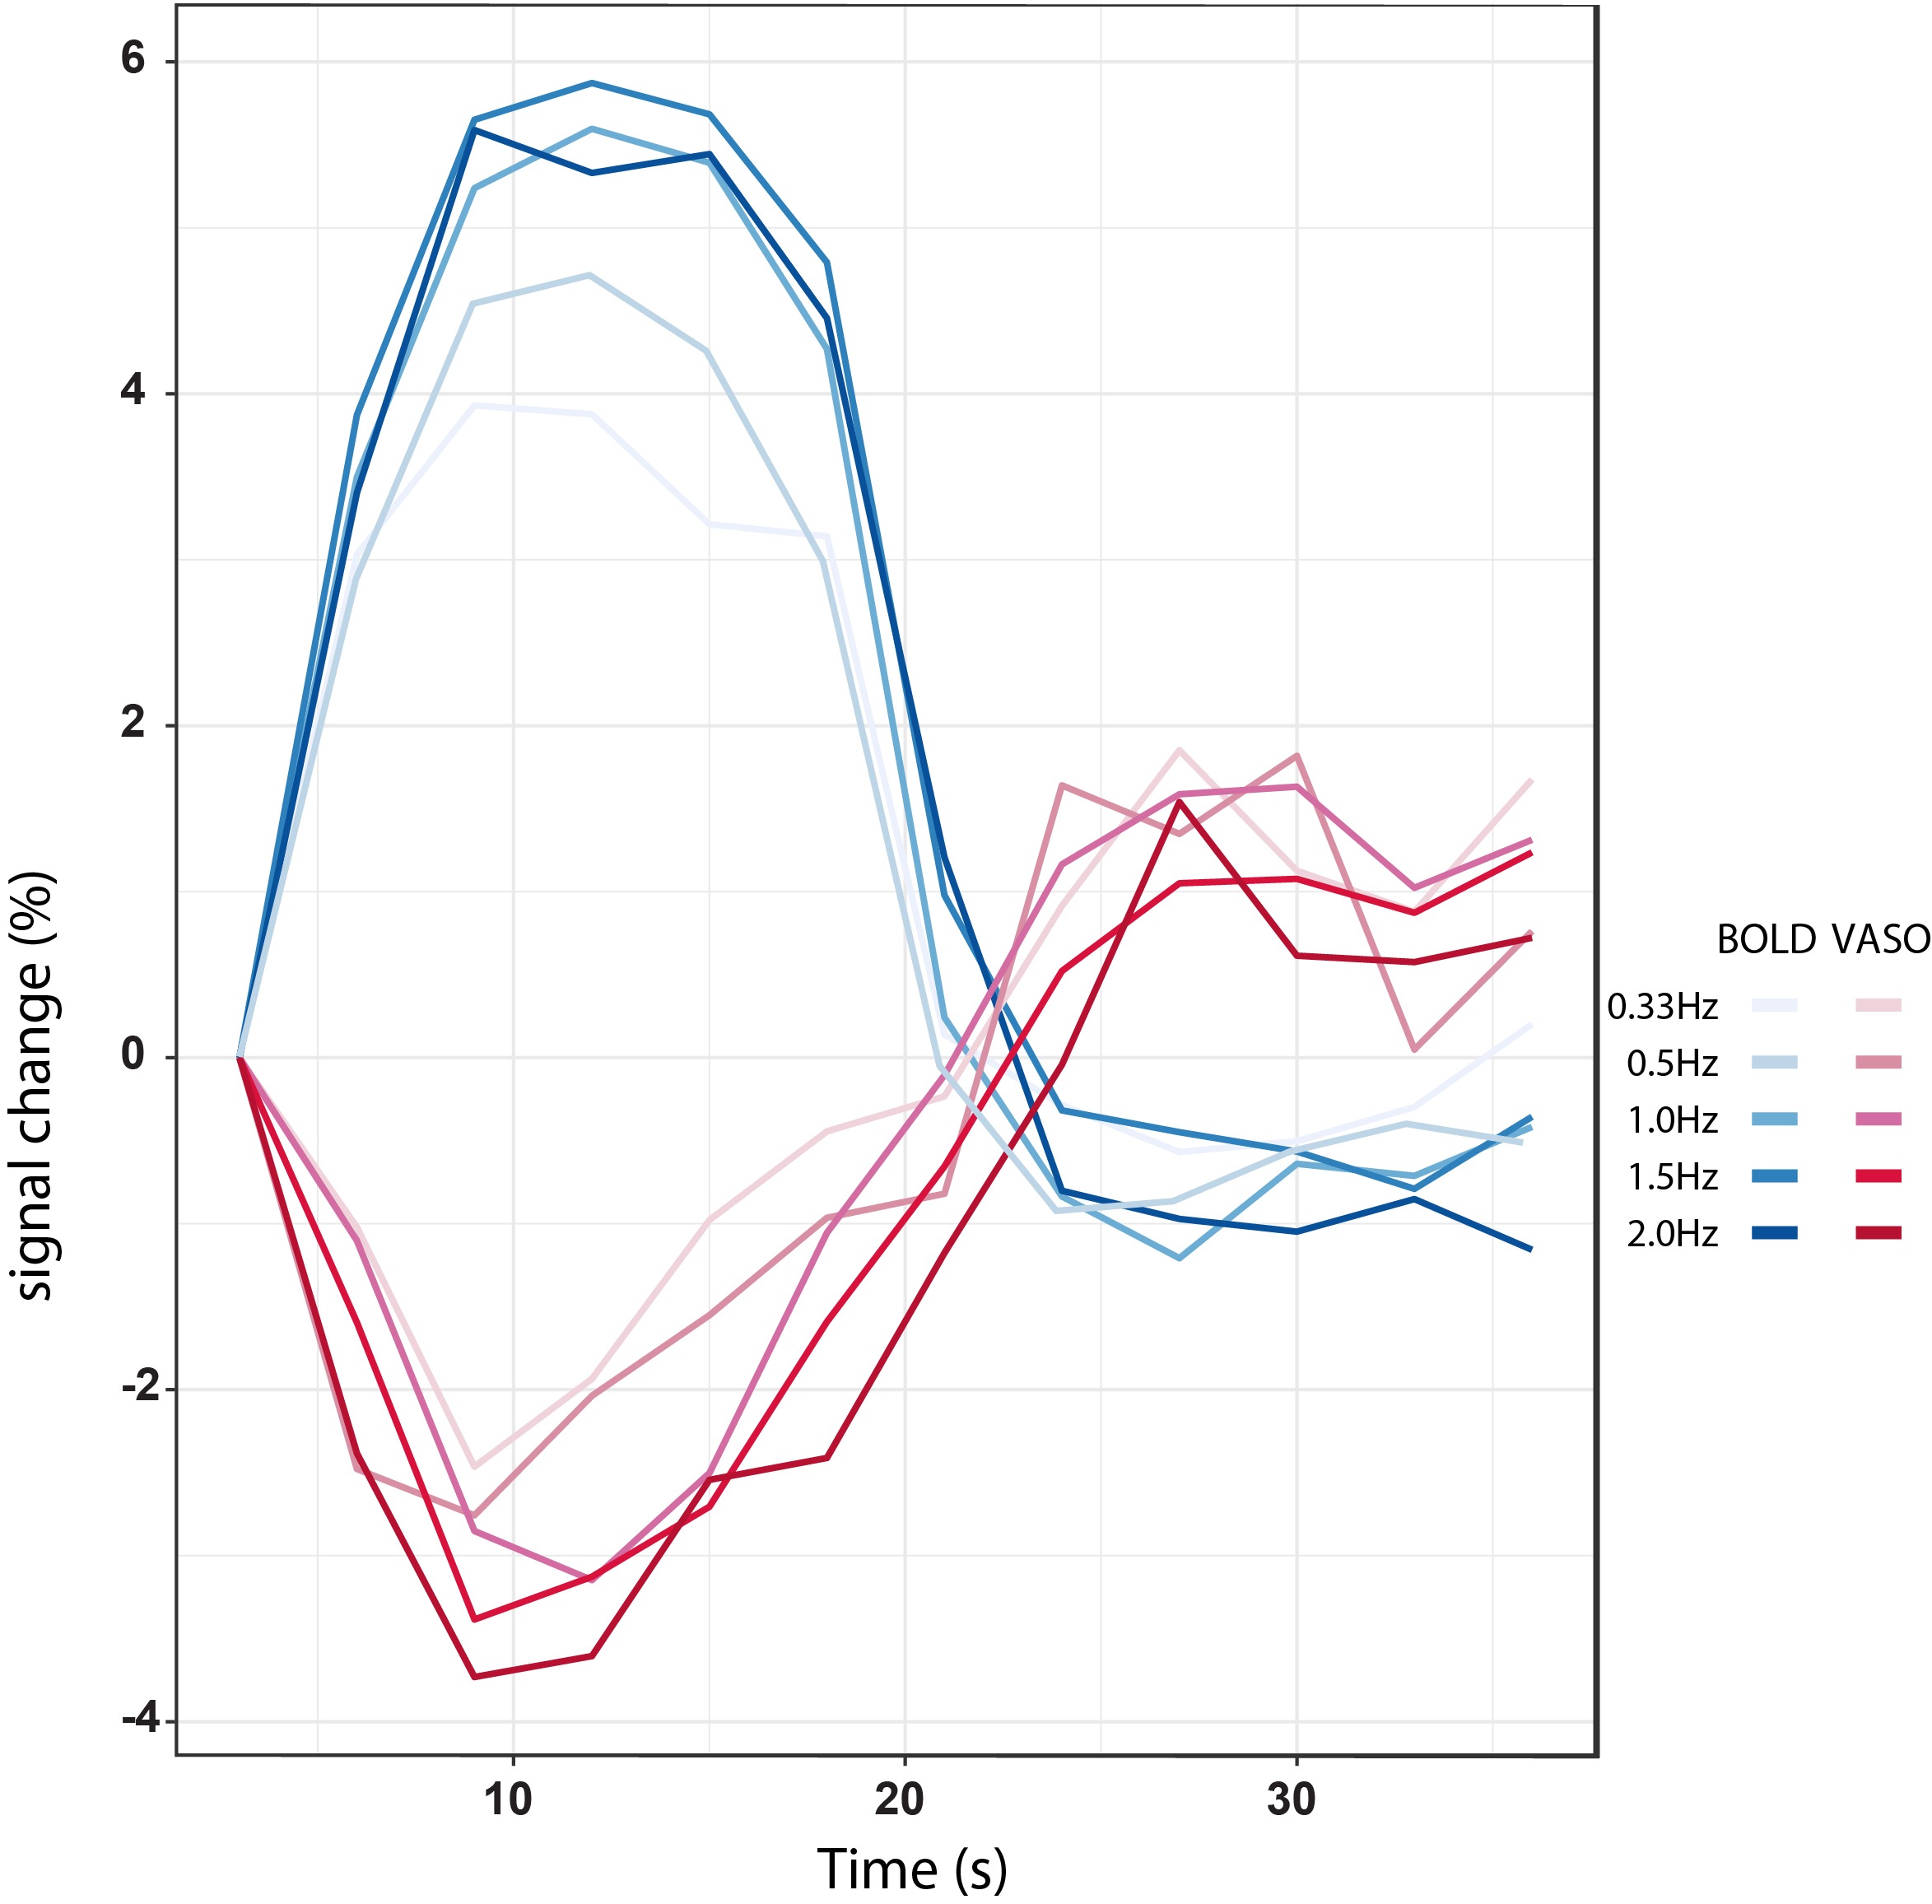
Figure 5: Averaged timecourse
BOLD and CBV-VASO signal response for all movement rates