3840
Comparing MRI and Doppler measures of resting Cerebral Blood Flow and Cerebrovascular Reactivity in the young and old1Centre for Human Brain Health, University of Birmingham, Birmingham, United Kingdom, 23Dementia Centre for Research Collaboration, University of New South Wales, Sydney, Australia, 3Sir Peter Mansfield Imaging Centre, School of Physics and Astronomy, University of Nottingham, Nottingham, United Kingdom, 4School of Physics and Astronomy, University of Nottingham, Nottingham, United Kingdom
Synopsis
Resting cerebral blood flow (CBF) and cerebrovasculature responsiveness (CVR) are becoming key measures of brain health. However, traditionally accepted CBF/CVR changes with age/fitness have been recently questioned using a variety of imaging modalities. Here we investigate the source of these discrepancies, performing Doppler and MRI measures on the same groups. We find similar changes in CBF but opposing changes in CVR measures between groups. There was no significant correlation of CBF MRI and Doppler measures across the cohort. Our work shows the necessity to further understand driving factors of CBF/CVR across modalities before use as a clinical research tool.
Introduction
Resting cerebral blood flow (CBF) and cerebrovasculature responsiveness (CVR) have emerged as a key outcome measure of brain health. Traditionally, lower resting CBF and CVR are associated with ageing, reduced aerobic fitness[1-4] and brain-related conditions including dementia[5-8] and stroke[9]. However, recent findings have found reverse associations between ageing or fitness effects and resting CBF[10, 11] or CVR[11, 12] measures. Inconsistent findings may be due to different neuroimaging modalities (e.g. MRI versus Doppler ultrasound) and techniques (e.g. large versus small vessel responses).Aims
To perform i) resting CBF and ii) CVR measures using MRI and Doppler measures in a single cohort. To identify (dis)associations between measures across the group and imaging modalities.Methods
Twenty participants (10 younger fit [22±2yrs, 3 female]; 10 older sedentary [74±4yrs, 2 female]) completed two sessions (Doppler/MRI) on separate days. Groups were chosen to maximise the expected variability in CBF and CVR[1, 2, 4]. During all experiments end tidal CO2 (PETCO2) was measured at 1kHz with a fast responding gas analyser (ML206 and Powerlab, ADInstruments), displayed in real time and stored for offline analysis using LabChart v7.3.5 (ADInstruments).MRI measures: Data were acquired on a 3T Philips Acheiva MR scanner.
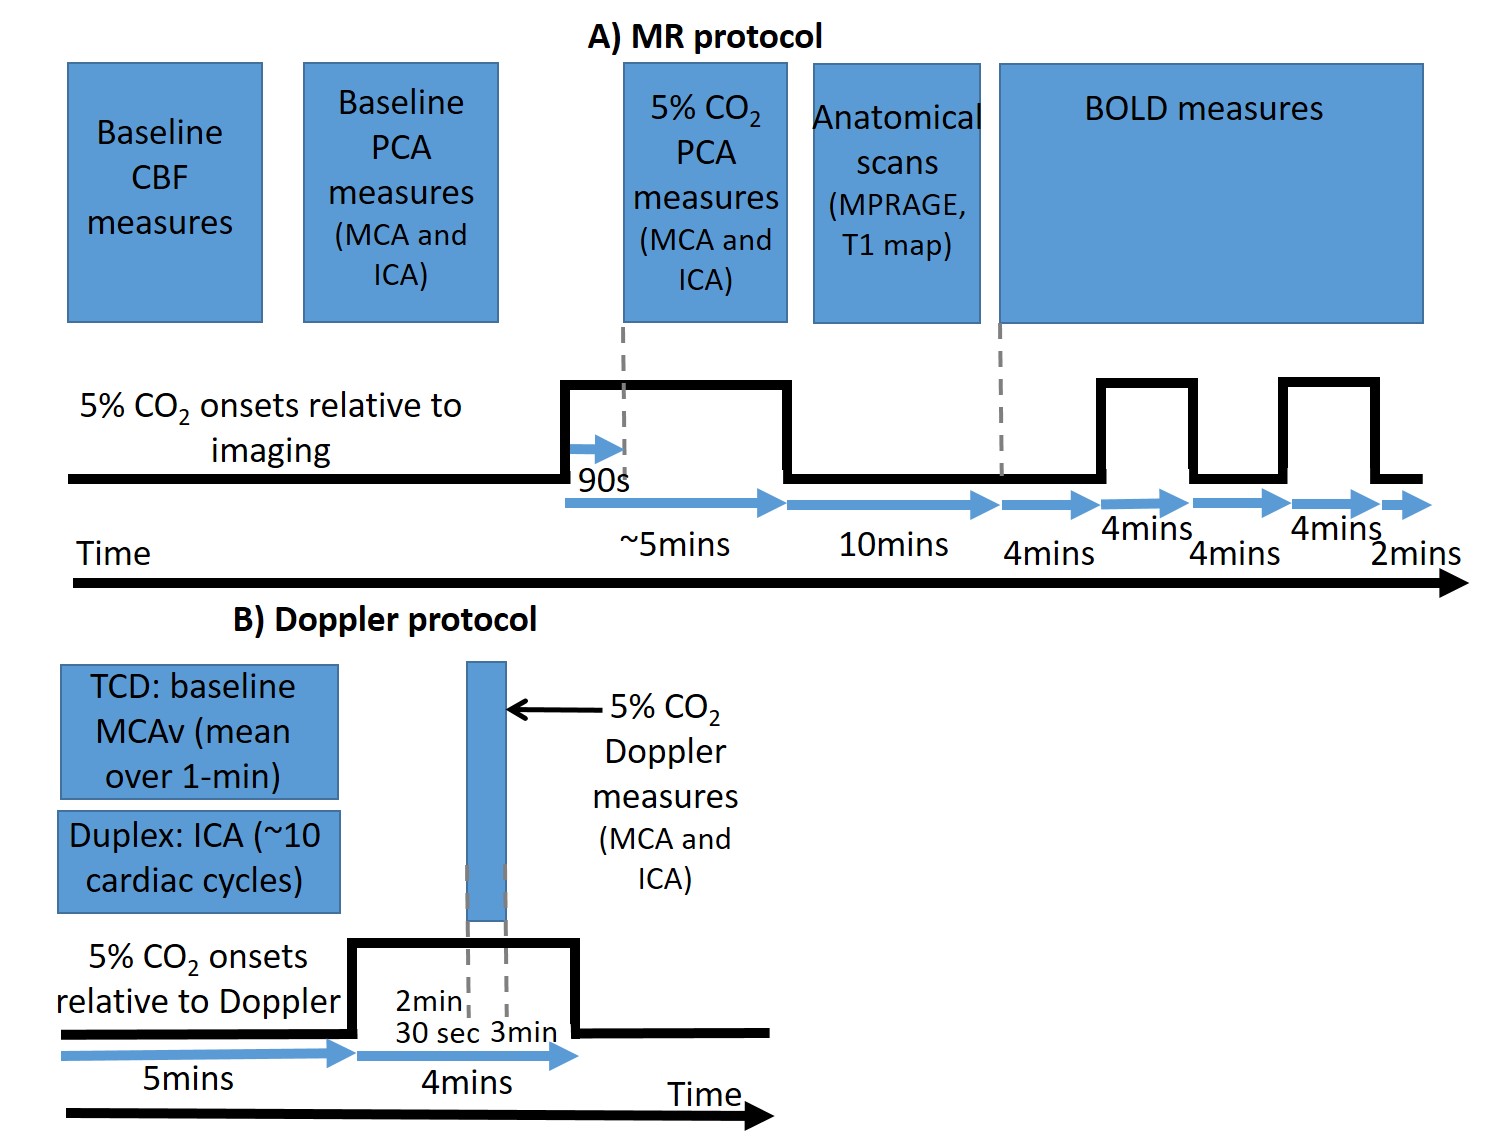
1) Resting CBF measures were acquired with: i) a FAIR pulsed ASL sequence (TR/TE=3000/9.6ms; inversion times=0.4-2s in 0.2s increments: voxel size=3×3×5mm; slices: 12); ii) Phase contrast angiography (PCA) measures of middle cerebral (MCA) and internal carotid (ICA) artery (Cardiac cycle phases=30, TR/TE=15/3ms, FA=10°, voxel size=1.21x1.21x6mm, Velocity encoding=150cm/s [allowing for increases during gas challenge – see below], SENSE factor 2).
2) CVR measures were derived from: BOLD fMRI data (2D-EPI: TR/TE1/TE2=3000/20/45ms, 3mm3 resolution, 38 slices, 345 volumes, SENSE factor 2) and PCA measures (as above) acquired during the CO2 gas challenge and rest periods (Figure 1A).
Doppler Measures: MCA velocity (MCAv) data were acquired using Transcranial Doppler [TCD] (Doppler Box, DWL, Compumedics), with a 2MHz probe placed over each temporal window on the right and left side of the head. ICA velocity, diameter and flow was measured with Duplex Doppler (15L4; Terason uSmart 3300, Teratech, USA). All Doppler measures were acquired simultaneously during rest and gas challenge (Figure 1B).
Analysis: PCA data were analysed using Q-Flow software (Philips Medical Systems) to determine mean blood flux and velocity through the MCA and ICA during rest and gas challenge. The mean PETCO2 in these time windows also found. Resting ASL data were preprocessed using standard pipelines in FSL. Resting perfusion and transit time measures over whole of grey matter were quantified using the FSL BASIL toolbox (https://fsl.fmrib.ox.ac.uk/fsl/fslwiki/BASIL). BOLD data were preprocessed in SPM8 and a GLM consisting of PETCO2 and motion parameters was used to determine the CVR from the resultant beta weights over grey matter[12].
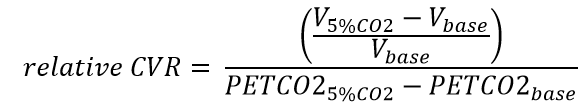
Resting MCAv measures from TCD data were found by taking the mean from 30s of baseline data. Similarly, the mean MCAv during the 5% CO2 stimulus was found at 3 minutes into the stimulus (Fig 1B). Likewise, the mean PETCO2 during rest and gas challenge were calculated. ICA measures of mean velocity, diameter and flow were calculated from ~10 cardiac cycles from the Duplex Doppler data. CVR from the PCA and Doppler measures were determined using Equation 1 (see Figures).
Independent t-tests examined for significant differences between groups. Between-modality approaches were compared via correlation (Pearson’s r).
Results
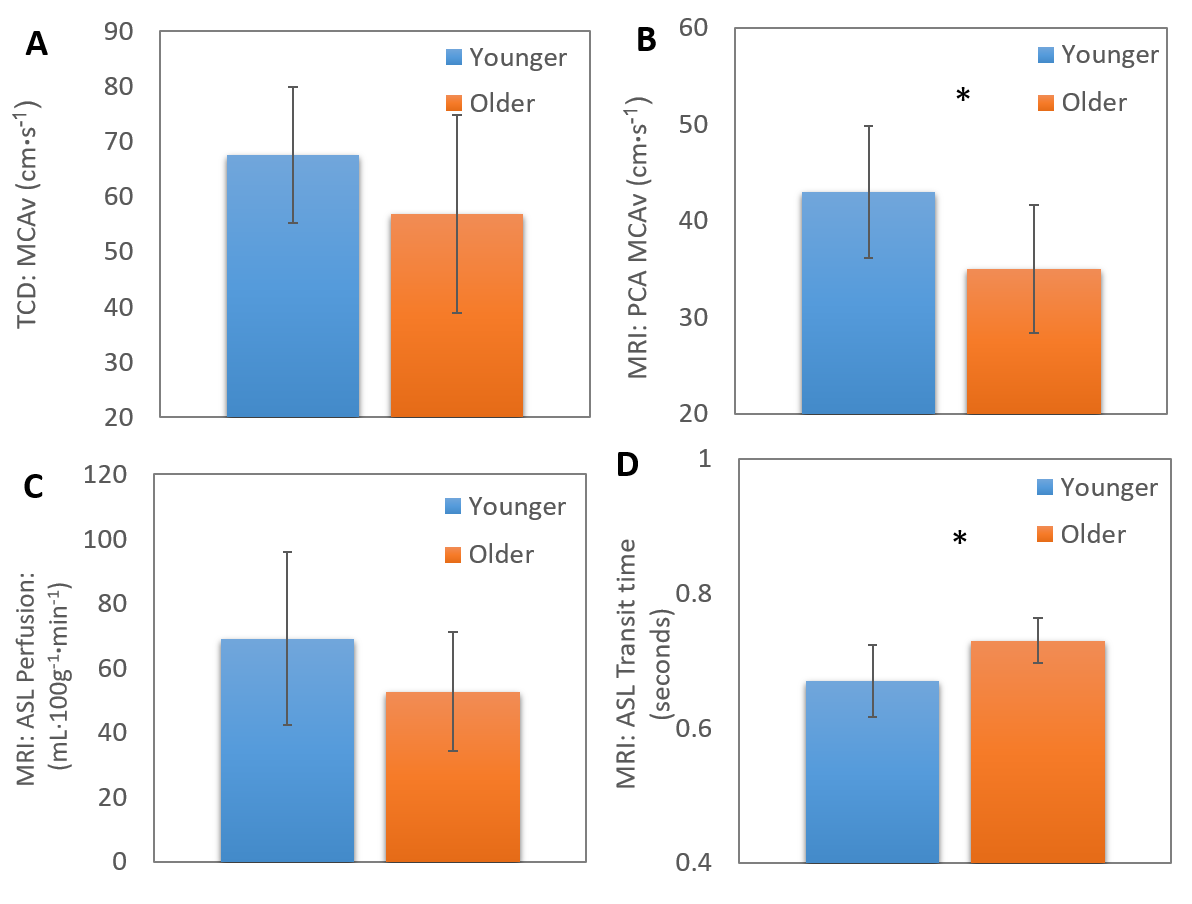
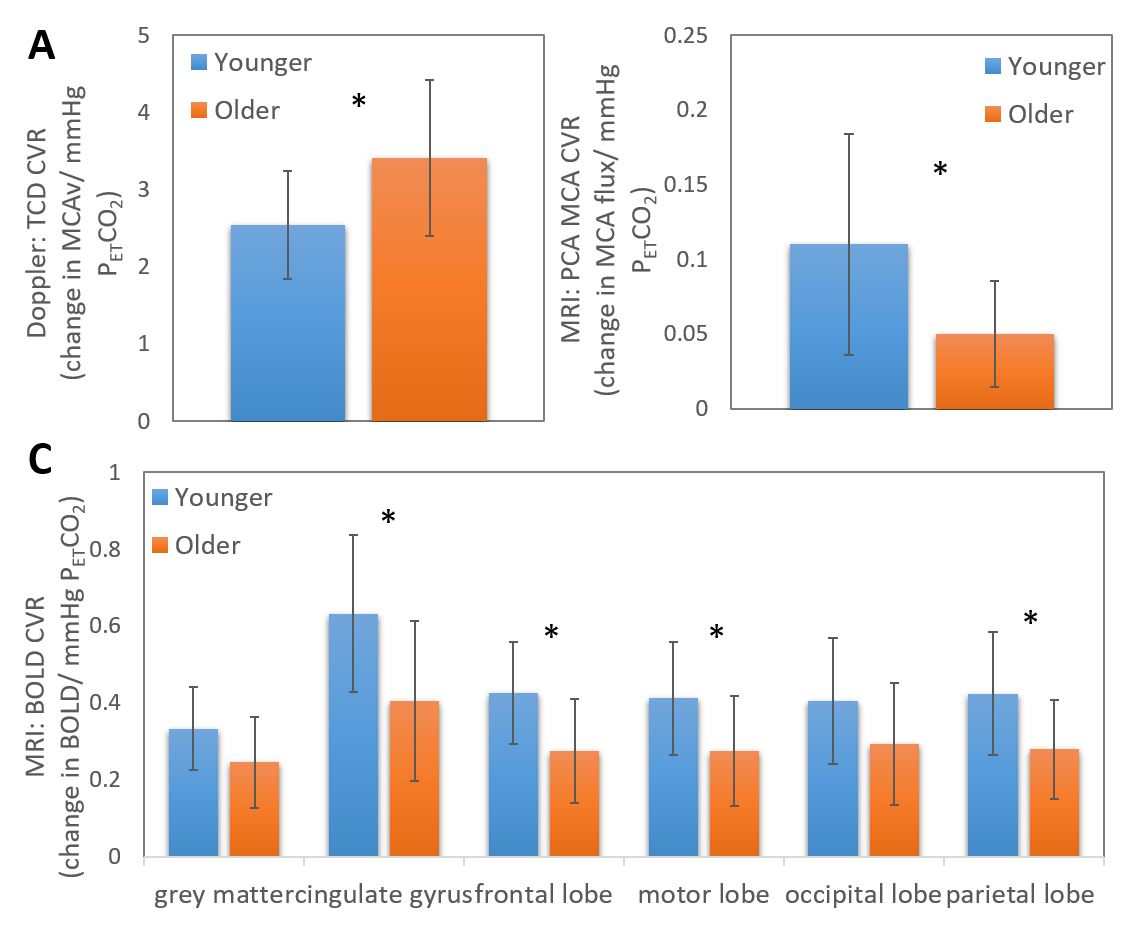
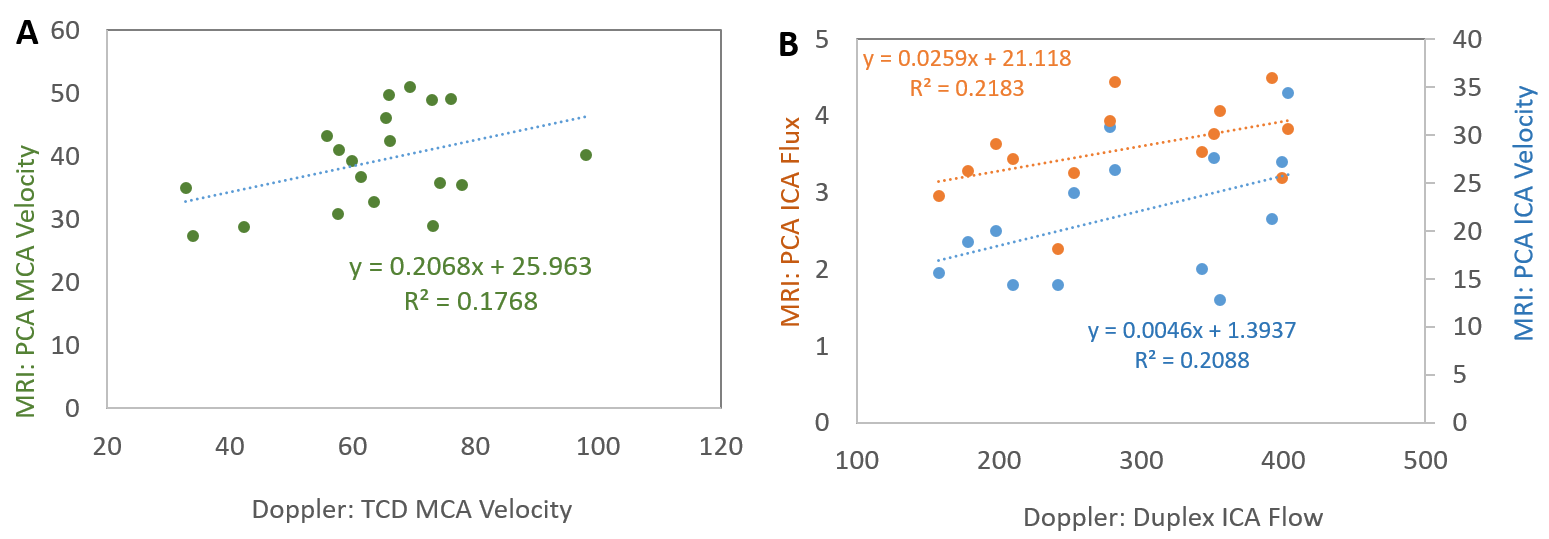
Differences in baseline CBF were seen between the two groups in all measures with lower CBF found in the older unfit group than the younger fit group. However, this only reached significance in the MCAv PCA (Fig 1B) and transit time (Fig 1D) measures. CVR measures gave conflicting results between TCD and MRI (PCA and BOLD) modalities, showing an increase and decrease in CVR with age, respectively (Fig 3). Across modalities no significant correlations were found between similar measures (Fig 4). However, the relationships did show an expected positive trend. No relationships were seen across modalities for CVR measures.Discussion and Conclusion
For CBF or CVR to become a predictor of brain health robust measures are required. The origin of discrepancies in CBF and CVR changes between studies and modalities in previous reports (e.g.[1, 2, 11, 12]) could have been due to different cohorts or measures used. Here we show that whilst similar trends are seen in baseline CBF measures across imaging modalities (Figs 2&4), this did not hold for CVR measures (Fig 3) despite the two groups selected to have the largest expected difference in CVR in a healthy population. Furthermore, we show for our CBF measures there is not a clear relationship between Doppler and MRI, even with comparative measures (i.e. MCAv or ICA flow). This is in contrast to previous findings[13] and may be due to measuring the mean, rather than peak, systolic response; the former typically used for Doppler measures. In conclusion, our results strongly indicate that further work (including test, re-test reliability) is needed to form a better understanding of the driving factors in CBF and CVR across modalities to explain our results and the recently presented data from other groups[10, 11].Acknowledgements
Thank you for funding support from The Physiological Society and The Nottingham-Birmingham Strategic Collaboration FundReferences
1. Ainslie, P.N., et al., Elevation in cerebral blood flow velocity with aerobic fitness throughout healthy human ageing. J Physiol, 2008. 586(16): p. 4005-10.
2. Bailey, D.M., et al., Elevated aerobic fitness sustained throughout the adult lifespan is associated with improved cerebral hemodynamics. Stroke, 2013. 44(11): p. 3235-8.
3. Bastos-Leite, A.J., et al., Cerebral blood flow by using pulsed arterial spin-labeling in elderly subjects with white matter hyperintensities. American Journal of Neuroradiology, 2008. 29(7): p. 1296-1301.
4. Zimmerman, B., et al., Cardiorespiratory fitness mediates the effects of aging on cerebral blood flow. Front Aging Neurosci, 2014. 6: p. 59.
5. Alsop, D.C., J.A. Detre, and M. Grossman, Assessment of cerebral blood flow in Alzheimer's disease by spin-labeled magnetic resonance imaging. Ann Neurol, 2000. 47(1): p. 93-100.
6. den Abeelen, A.S., et al., Impaired cerebral autoregulation and vasomotor reactivity in sporadic Alzheimer's disease. Curr Alzheimer Res, 2014. 11(1): p. 11-7.
7. Wolters, F.J., et al., Cerebral Perfusion and the Risk of Dementia A Population-Based Study. Circulation, 2017. 136(8): p. 719-+.
8. Zhang, N., M.L. Gordon, and T.E. Goldberg, Cerebral blood flow measured by arterial spin labeling MRI at resting state in normal aging and Alzheimer's disease. Neurosci Biobehav Rev, 2017. 72: p. 168-175.
9. Markus, H. and M. Cullinane, Severely impaired cerebrovascular reactivity predicts stroke and TIA risk in patients with carotid artery stenosis and occlusion. Brain, 2001. 124(Pt 3): p. 457-67.
10. Furby, H.V., et al., Cardiorespiratory fitness is associated with increased middle cerebral arterial compliance and decreased cerebral blood flow in young healthy adults: a pulsed ASL MRI study. JCBFM, 2019. Epub ahead of print.
11. Intzandt, B., et al., Higher cardiovascular fitness level is associated with lower cerebrovascular reactivity and perfusion in healthy older adults. JCBFM, 2019. Epub ahead of print.
12. Thomas, B.P., et al., Life-long aerobic exercise preserved baseline cerebral blood flow but reduced vascular reactivity to CO2. J Magn Reson Imaging, 2013. 38(5): p. 1177-83.
13. Lee, V.S., et al., Flow quantification using fast cine phase-contrast MR imaging, conventional cine phase-contrast MR imaging, and Doppler sonography: in vitro and in vivo validation. AJR Am J Roentgenol, 1997. 169(4): p. 1125-31.
Figures