3839
Attention field size alters patterns of population receptive field in the early visual cortex1College of Medical Imaging, Shanxi Medical University, Taiyuan 030001, Shanxi Province, China, 2Department of Radiology, First Clinical Medical College, Shanxi Medical University, Taiyuan 030001, Shanxi Province, China, 3MR Scientific Marketing, Diagnosis Imaging, Siemens Healthcare Ltd, Beijing 100102, China, 4College of Information and Computer, Taiyuan University of Technology, Taiyuan 030001, Shanxi Province, China
Synopsis
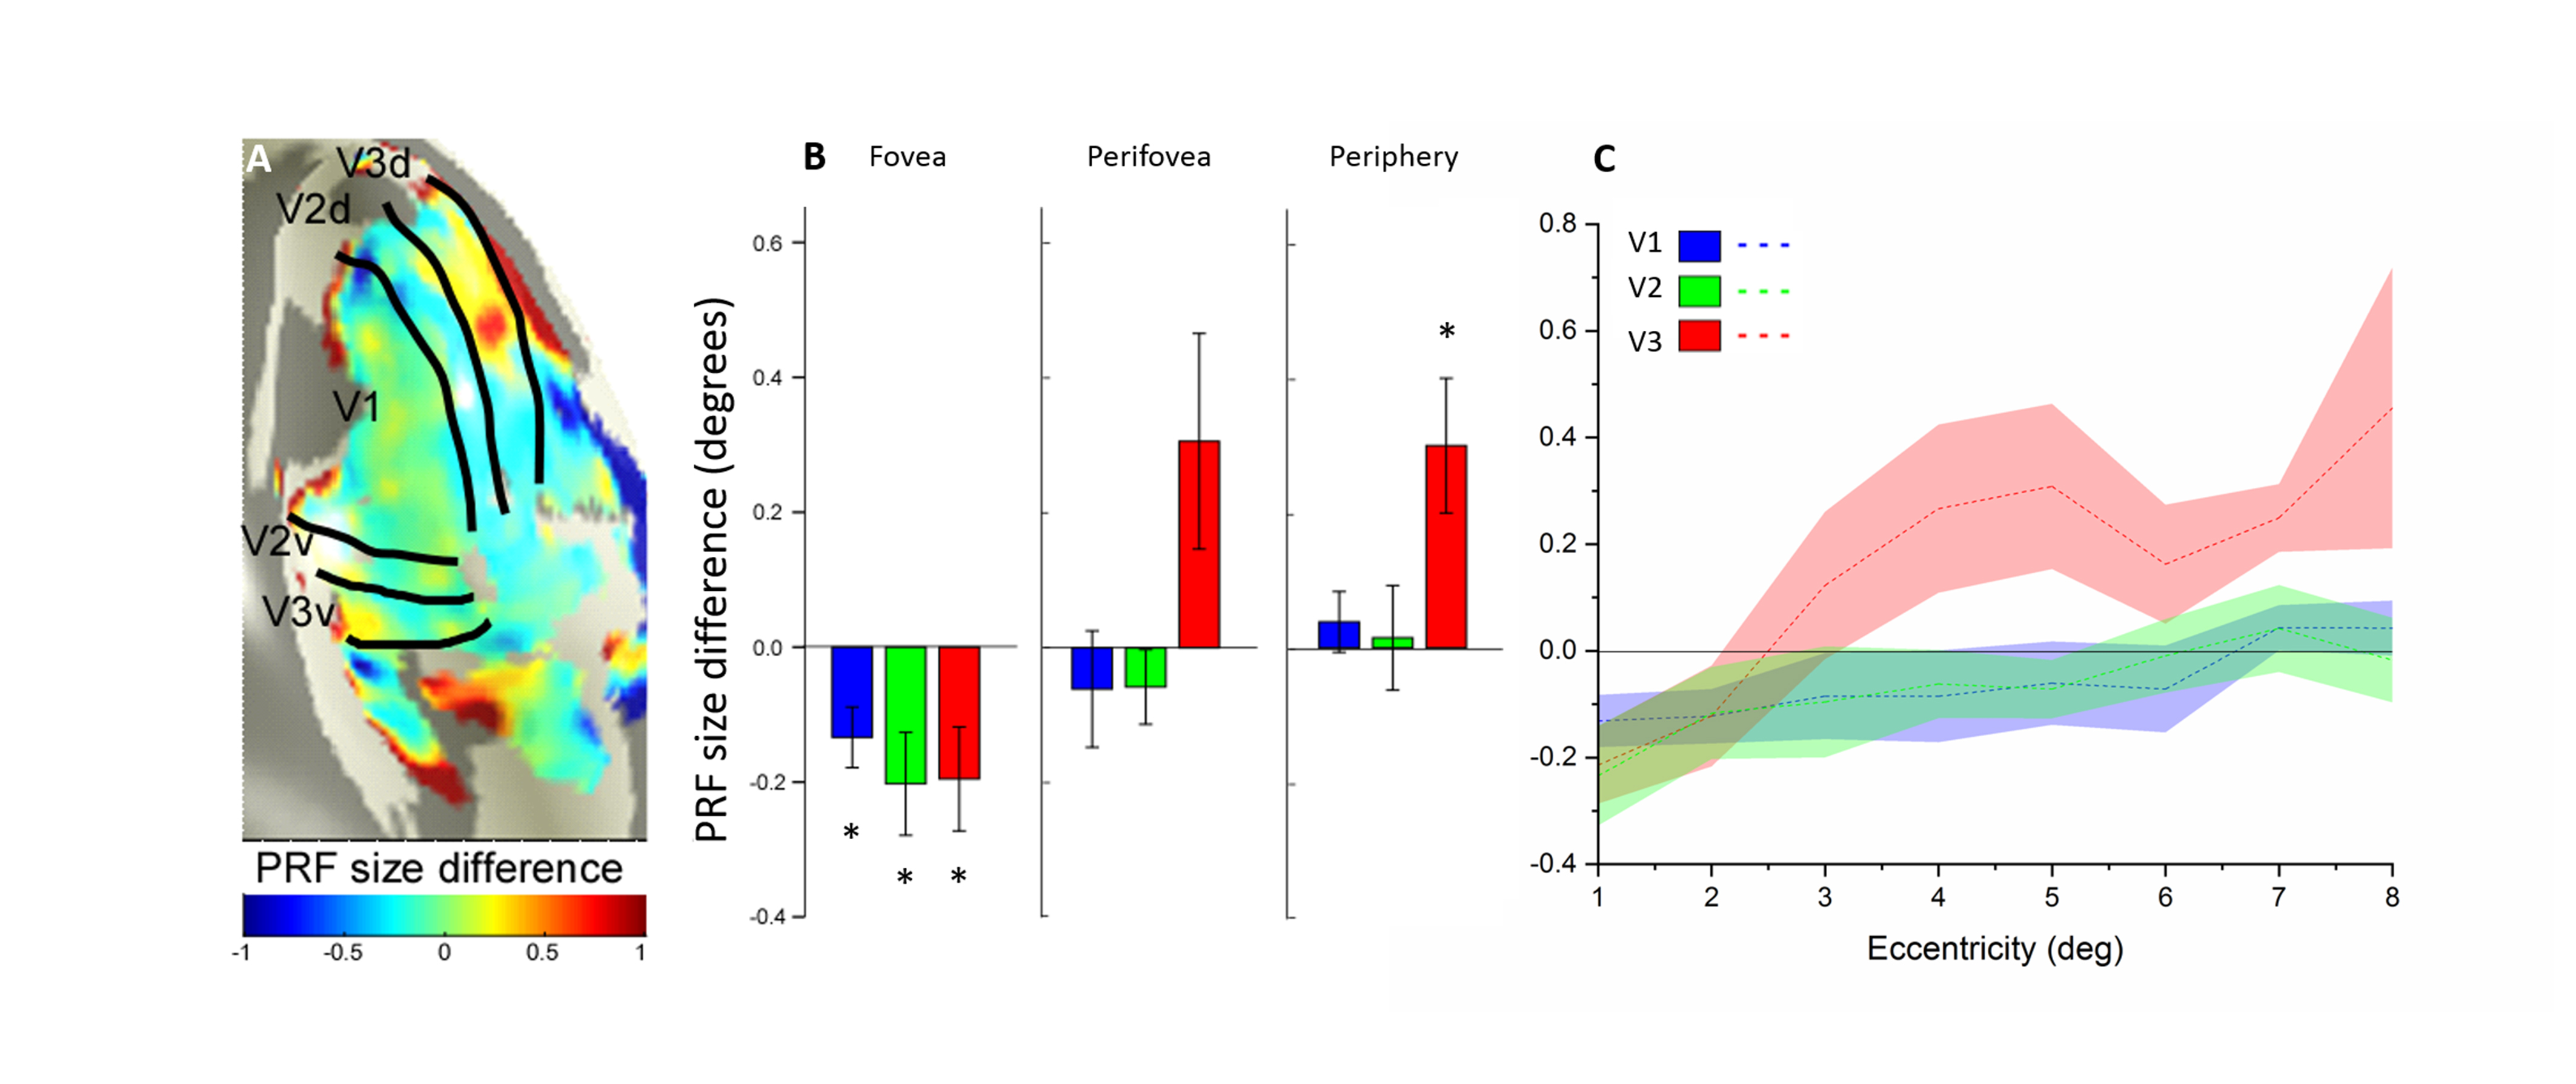
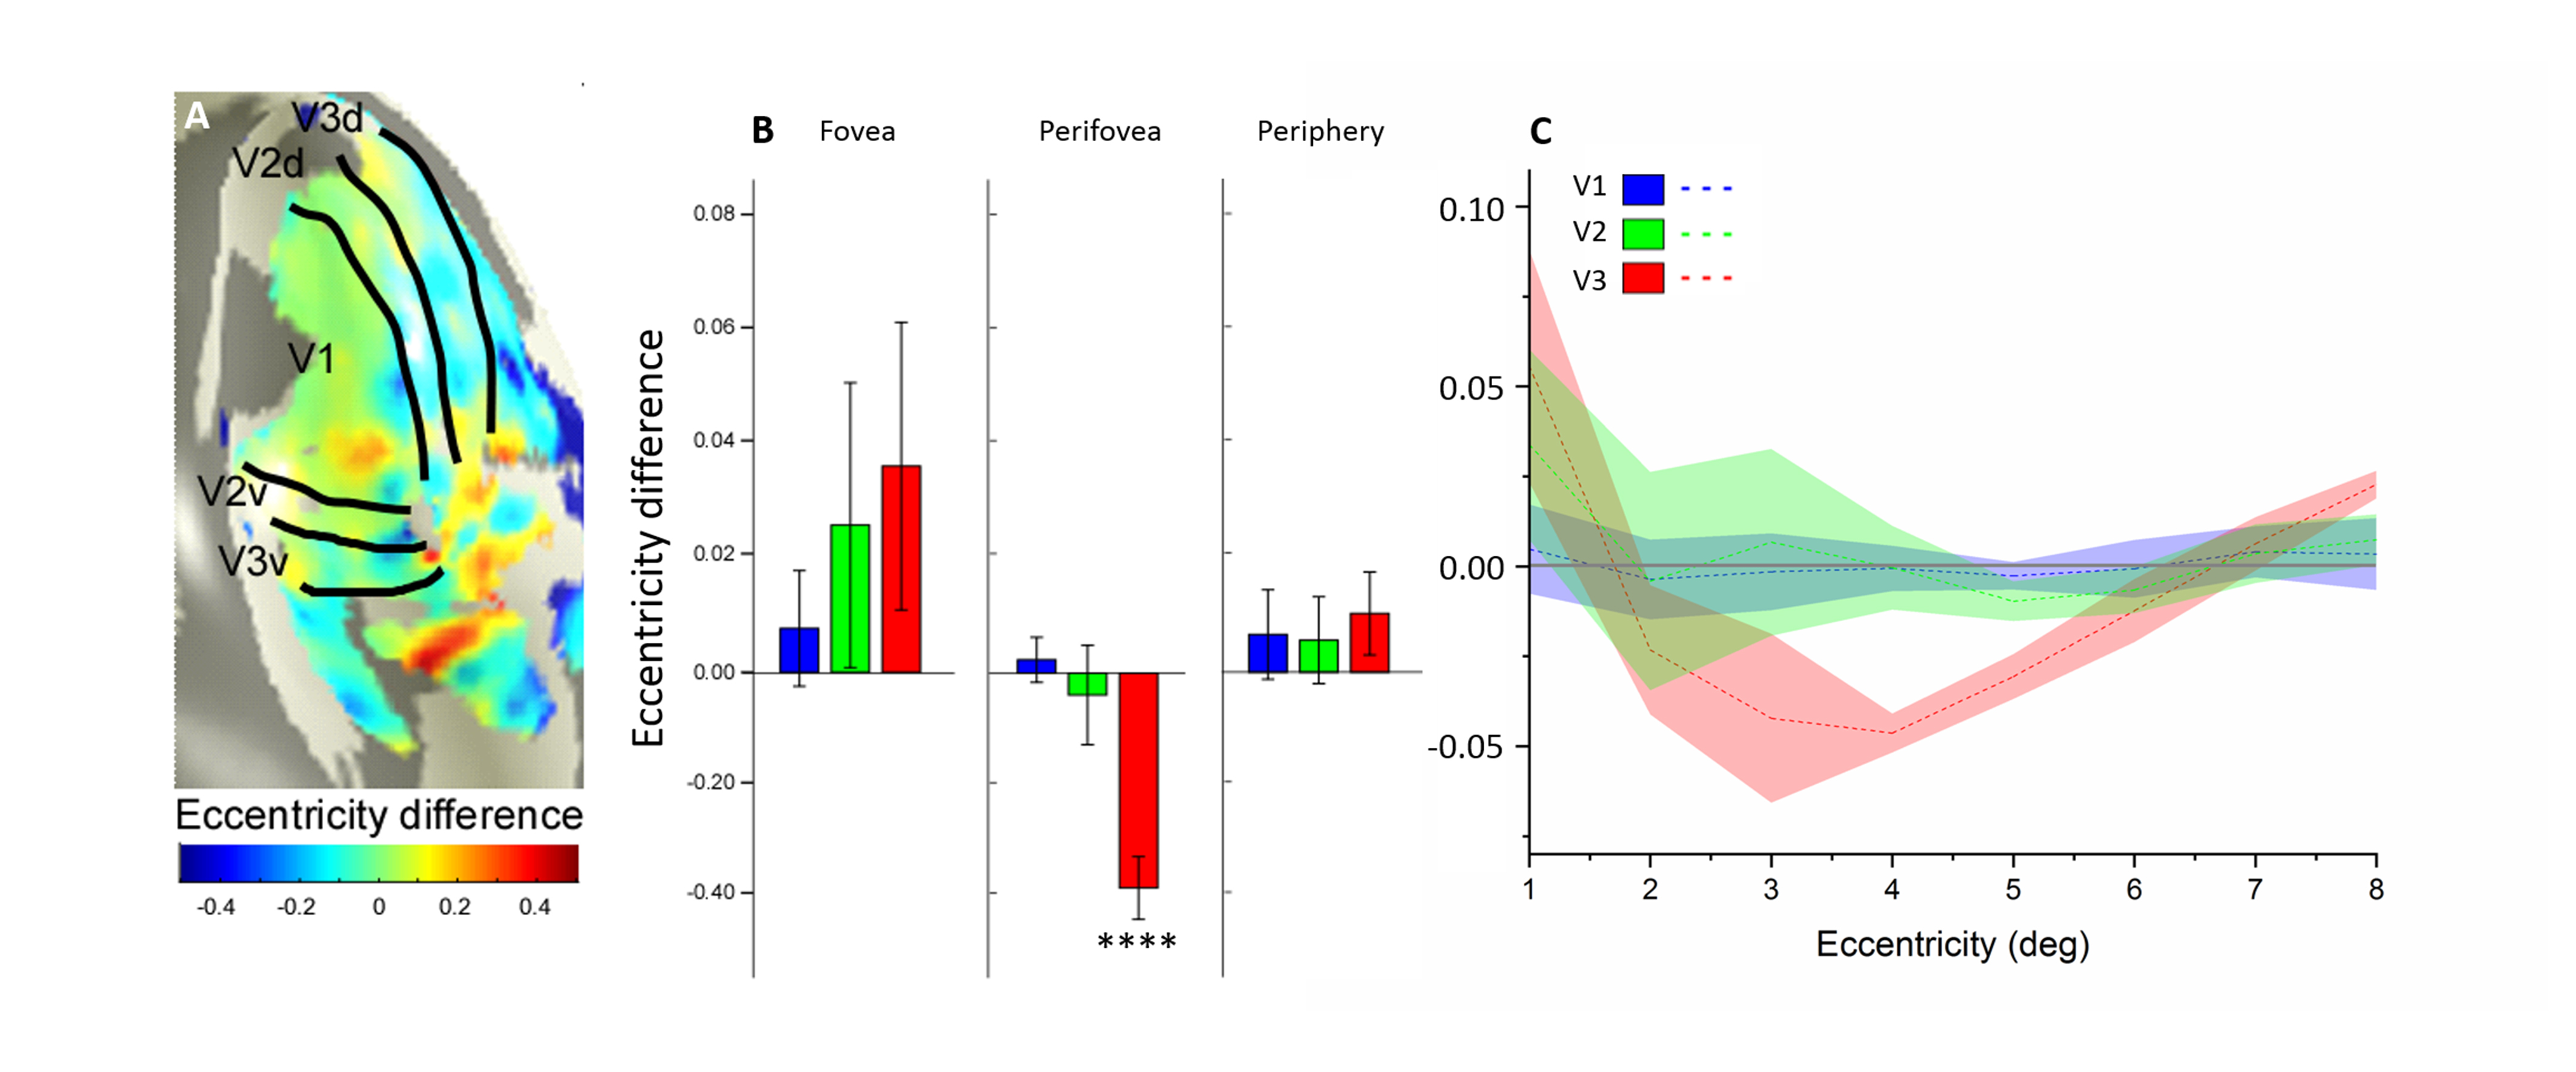
The effect of attention field (AF) is not only constrained to spatial positions of attention but also to size. However, the direct link of AF size to receptive field (RF) has not been well established. In our study, we demonstrated remarkable modulation of AF in the early visual cortex, with regard to size and location of population receptive field (pRF), emphatically. Specially, the differences in pRF size between focused and distributed attention conditions increase with eccentricity, especially in the V3 area. Considering pRF location, eccentricity is larger under distributed attention conditions than under focused attention conditions at the perifovea in the V3 area.
Introduction/Purpose
Visual spatial attention is a cognitive process, where prior information about the relevance of spatial locations is used to improve perceptual performance1,2. Visual attention spreads over a range of the visual space, known as the attention field (AF). AF reshapes the distribution of activities across the visual pathway, including the early visual cortex and all areas along the dorsal and ventral visual cortical pathways3. Importantly, the effect of attention is not only constrained to spatial positions of attention but also to the size4. It has been proposed that different AF size varies the patterns of neural gain elicited by stimuli5,6, but the direct link of AF size to receptive field (RF) has not been well established. In this study, we used the population receptive field (pRF) method7, which allows the functional magnetic resonance imaging (fMRI) response to be measured at many visual areas across the entire spatial map, to quantitatively analyze how AF size modulate spatial representations and whether modulation occur in the early visual cortex.Method
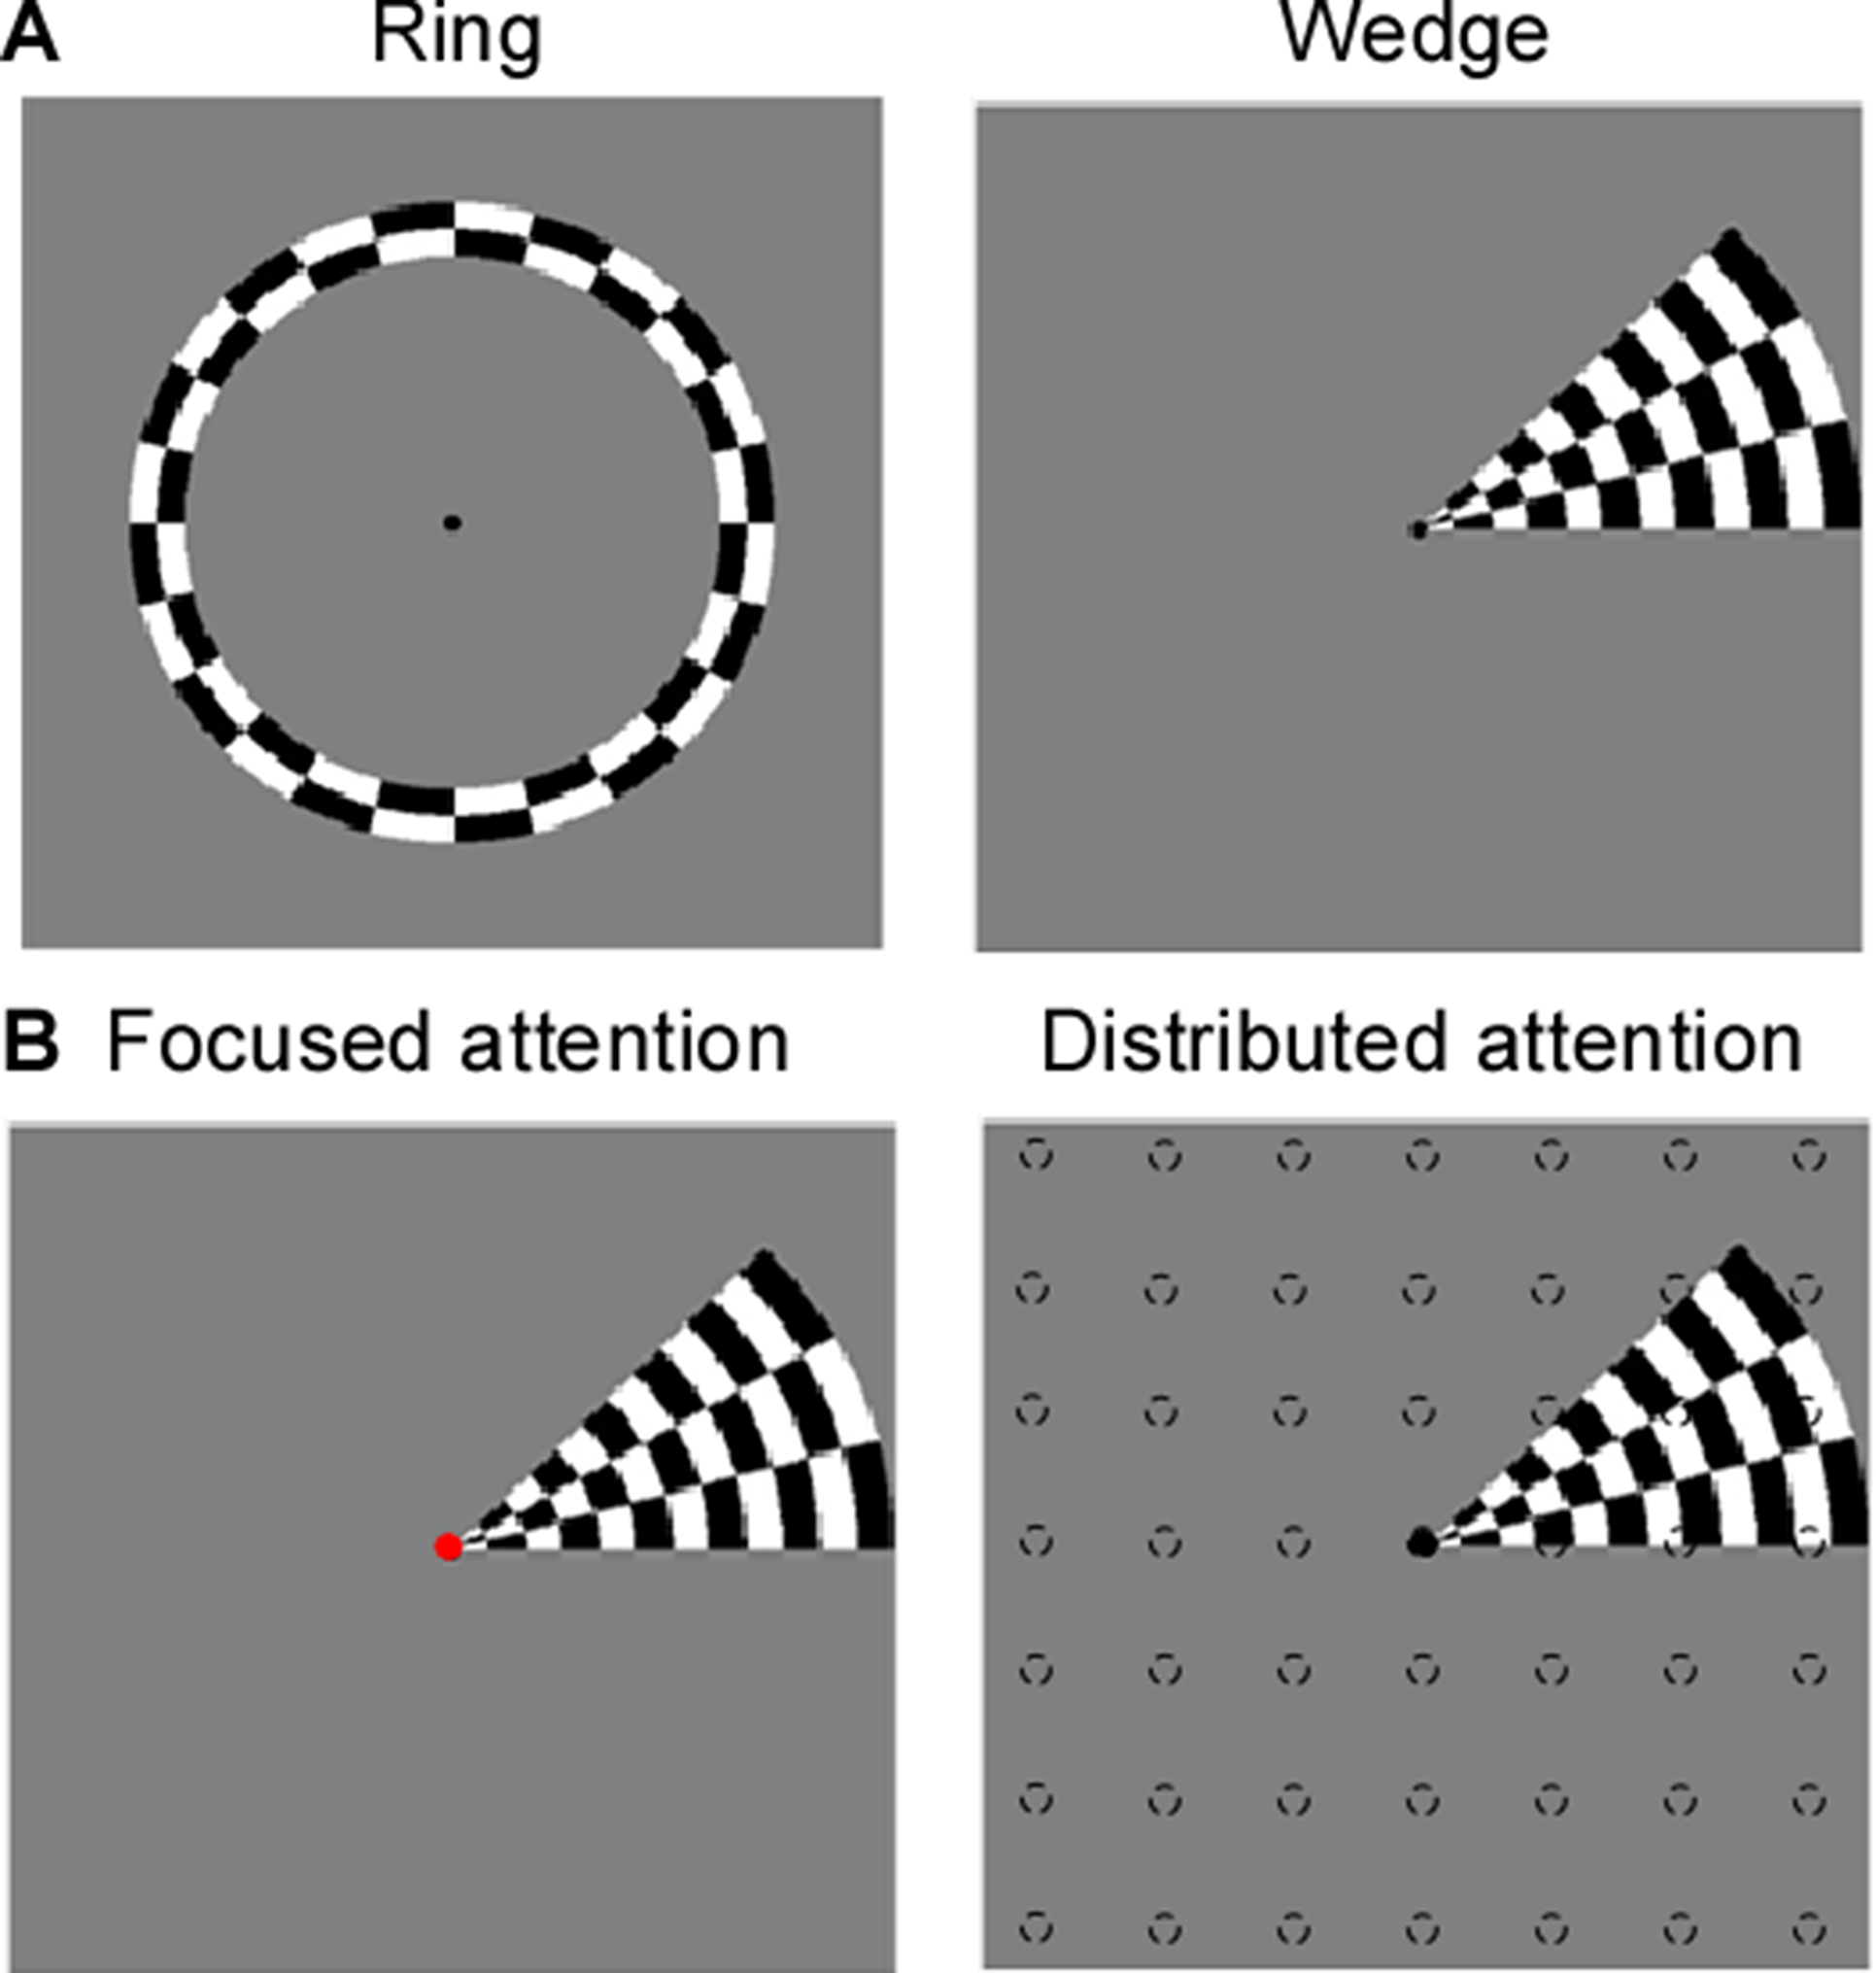
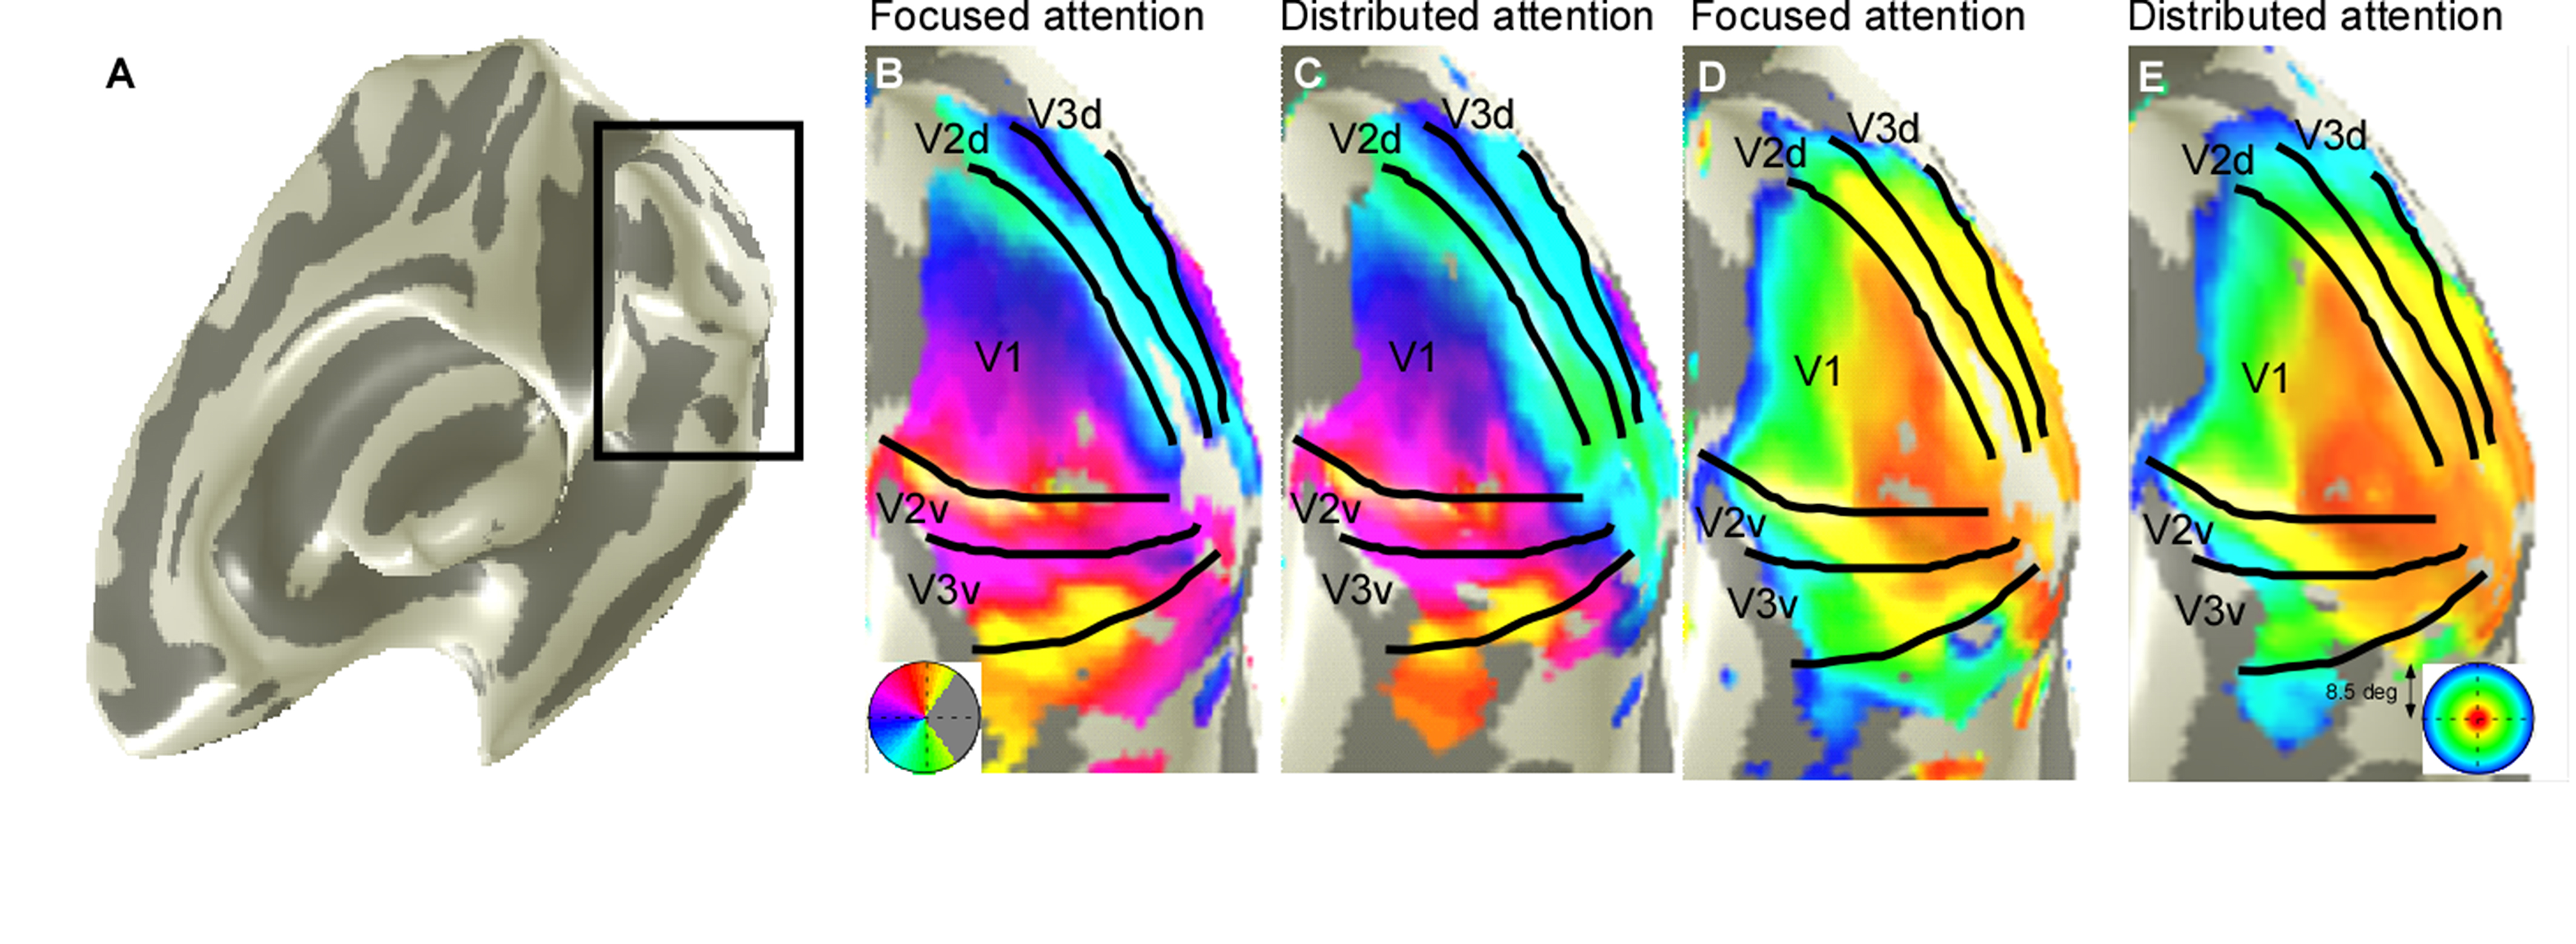
Eight right-handed neurologically healthy participants (five female; ages 23–31 years) were recruited in this study. The number of recruited subjects was within the typical range of other studies that employed similar approaches8-13. All subjects were scanned at a 3T whole-body MRI scanner (MAGNETOM Skyra, Siemens Healthcare, Erlangen, Germany) with a 32-channel head coil centered over the subject’s occipital pole. Functional MRI were acquired using a gradient-echo EPI sequence with the following parameters: TR/TE = 1500 ms/30 ms, flip angle 55°, FOV= 24×24 cm2, spatial resolution = 2.5×2.5×3 mm3, 20 slices oriented orthogonal to the Calcarine sulcus, no slice gap, total acquisition time = 2 min 39 sec. During fMRI scan, the subjects were required to perform one-back tasks on identical streams of stimuli (ring and wedge stimulus) presented at either central fixation (focused attention condition) or all-around vision (distributed attention condition) while task-irrelevant mapping stimuli traversed the visual field (Fig.1). The two types of tasks were presented in an interleaved order, counterbalanced across participants and repeated four times to increase the signal-to-noise ratio of the BOLD signal. High-resolution anatomical MR images were acquired using a T1-weighted MP-RAGE sequence with the following parameters: TR/TE = 11 ms/3.3 ms, TI = 1100 ms, 172 slices, flip angle=18°, 1 mm3 resolution, acquisition time = 6 min 3 sec. T1-weighted images were used to reconstruct the cortical surface for each subject in mrVista software (http://vistalab.stanford.edu/software). For fMRI data analysis, size and location of pRF and amplitude were estimated for each voxel using a 2D Gaussian pRF model described by Dumoulin et al7 and implemented with the mrVista software. Voxels with at least 10% of the variance explained by the model fit were included in the final pRF estimates. Then, pRF polar angle and eccentricity maps of the focused attention condition trials were used to estimate the boundaries of the early visual cortical areas (V1-V3). These regions of interest (ROIs) were manually drawn on an inflated representation of the cortical surface using for all conditions for a given subject. After that, we divided the voxels into bins by their eccentricity, with each bin covering an eccentricity range of 1° and defining 0.5°-2.5° eccentricity as the fovea, 3.5°-5.5° eccentricity as the perifovea and 6.5°-8.5° eccentricity as the periphery, according to previous studies14-16. Finally, two-tailed paired t-tests and linear function were used to determine whether the group of differences including all subjects and the relationships between the difference in bins and each bin's corresponding eccentricity were significant. P<0.05 were considered statistically significant.Results
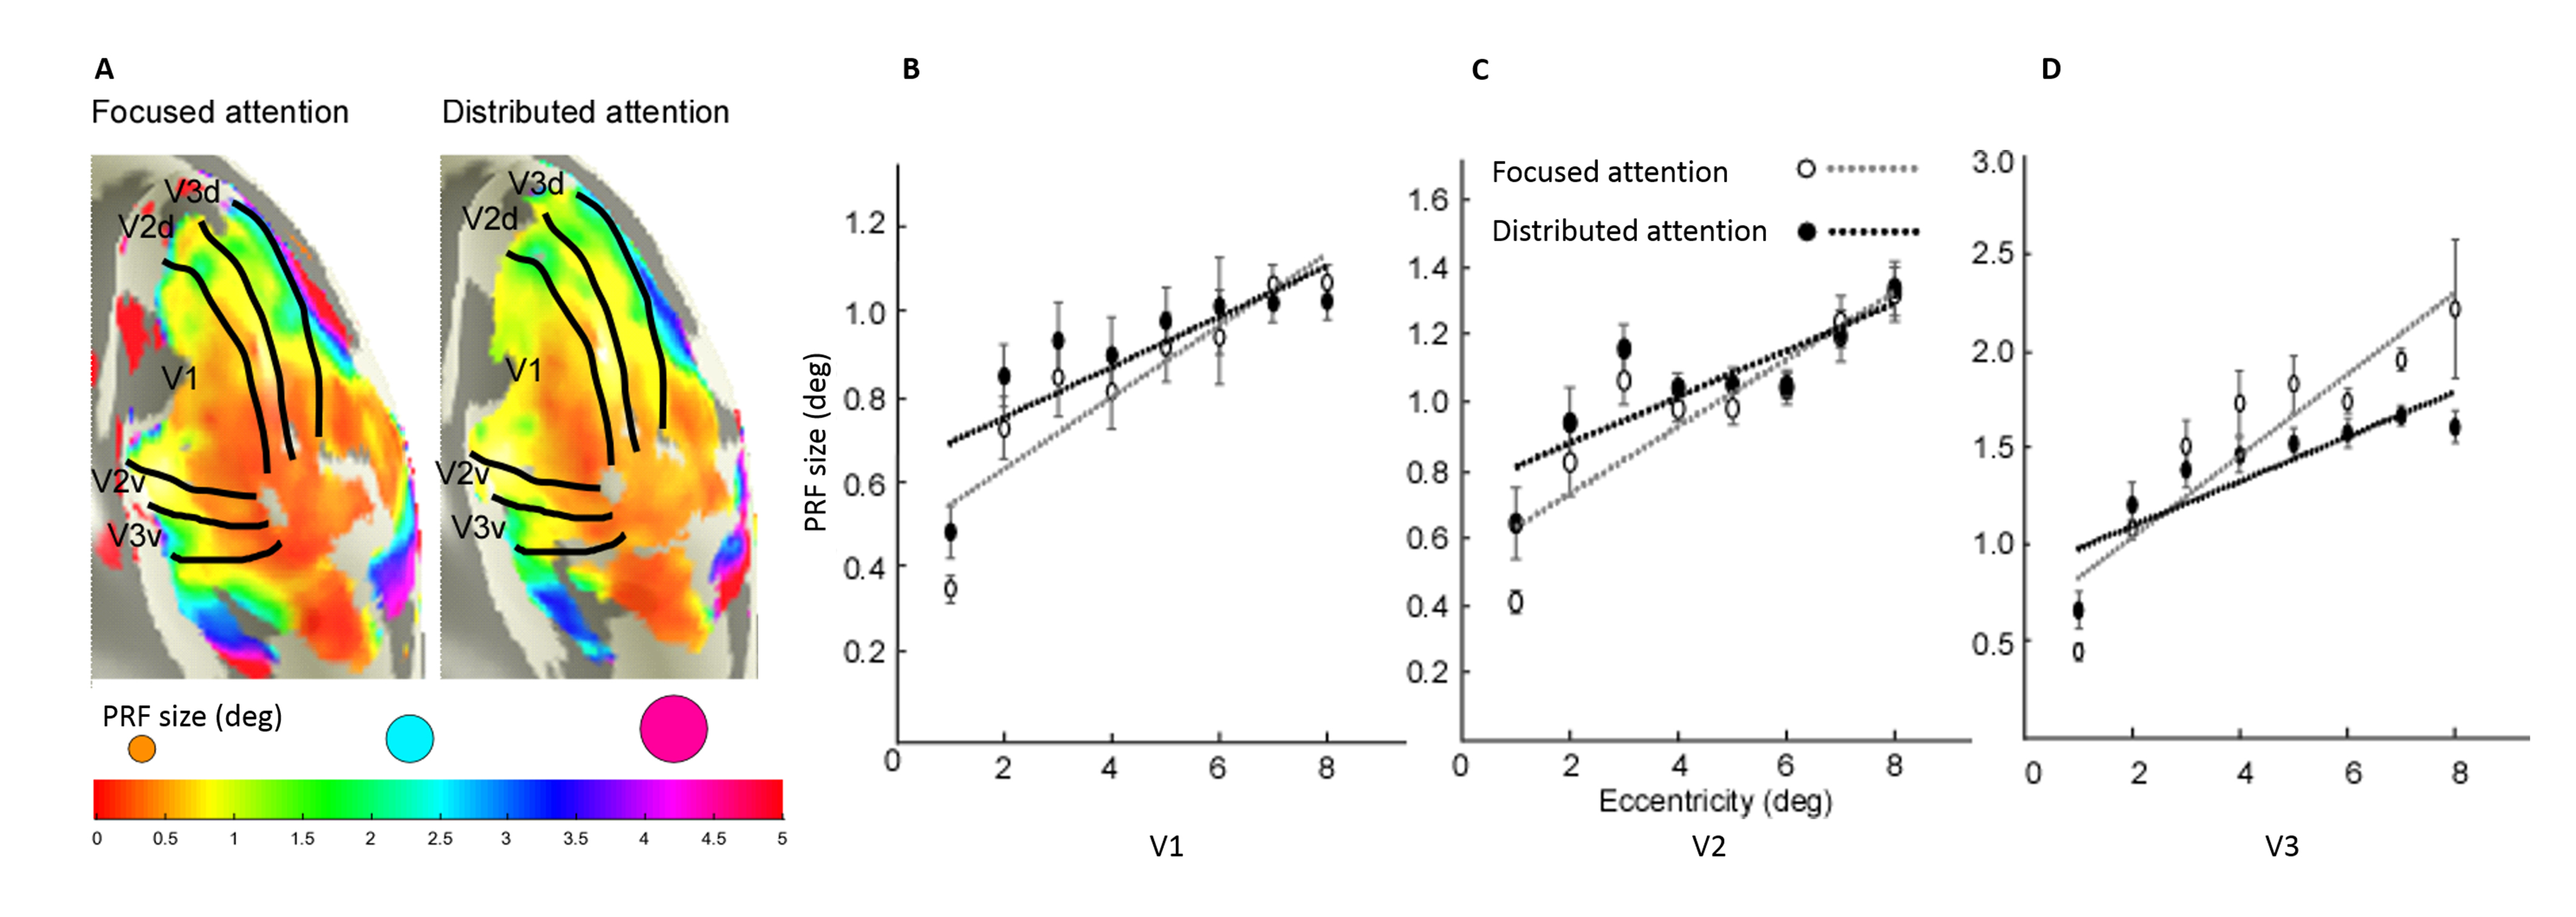
We reconstructed robust spatial representations across a range of eccentricities and for both attention conditions (Fig. 2). Our results demonstrated a remarkable attentional modulation of early visual cortex on size, location of pRF and amplitude. The pRF sizes increased more strongly with eccentricity under focused attention condition (V1: slope=0.025, CI=-0.172, R2=0.766, F=19.658, p=0.004; V2: slope=0.030, CI=-0.208, R2=0.799, F=23.911, p=0.003; V3: slope=0.080, CI=-0.206, R2=0.875, F=31.653, p=0.001). Furthermore, the focused attention condition showed a smaller pRF size at foveal eccentricity in early visual area (V1: t(7) = -2.979, p=0.021; V2: t(7) = -2.650, p=0.033; V3: t(7) = -2.536, p=0.039) and a larger pRF size at peripheral eccentricity in V3 than distributed attention condition (V3: t(7) = 3.015, p= 0.020), shown as Fig. 3 and Fig. 4. In addition, AF size also affected pRF locations in V3 area, with more eccentric at perifoveal visual degree under distributed vs. focused attention condition (t(7)=6.853, p<0.001), shown as Fig. 5. In comparison with distributed attention condition, the amplitudes in early visual areas were significantly higher in the focused attention condition (V1: t(7) = 10.089, p<0.001; V2: t(7) = 20.163, p<0.001; V3: t(7) = 9.749, p<0.001).Discussion and Conclusion
We explored how different AF sizes with constant mapping stimuli selectively alter the patterns of pRF characteristics in the early visual cortex. Attention was restricted to a narrower field in the focused attention condition than in the distributed attention condition. Our results demonstrate that early visual cortexes are modulated by AF size with regard to pRF size, location and amplitude and provide important insights into how human early visual field representations are affected by attention.Acknowledgements
This work was supported by the National Natural Science Foundation (81971593, 81971592, 81771824, 81702449, 61873178); the Precision Medicine Key Innovation Team Project (YT1601).References
1 Desimone, R. Visual attention mediated by biased competition in extrastriate visual cortex. Philosophical Transactions of the Royal Society of London. Series B: Biological Sciences 353, 1245-1255 (1998).
2 Desimone, R. & Duncan, J. Neural mechanisms of selective visual attention. Annual review of neuroscience 18, 193-222 (1995).
3 Gilbert, C. D. & Wu, L. Top-down influences on visual processing. Nature Reviews Neuroscience 14, 350-363 (2013).
4 Reynolds, J. H. & Heeger, D. J. The normalization model of attention. Neuron 61, 168-185 (2009).
5 Itthipuripat, S., Garcia, J. O., Rungratsameetaweemana, N., Sprague, T. C. & Serences, J. T. Changing the spatial scope of attention alters patterns of neural gain in human cortex. Journal of Neuroscience 34, 112-123 (2014).
6 Herrmann, K., Montaser-Kouhsari, L., Carrasco, M. & Heeger, D. J. When size matters: attention affects performance by contrast or response gain. Nature neuroscience 13, 1554 (2010).
7 Dumoulin, S. O. & Wandell, B. A. Population receptive field estimates in human visual cortex. Neuroimage 39, 647-660 (2008).
8 Beltrán, J., García-Vázquez, M. S., Benois-Pineau, J., Gutierrez-Robledo, L. M. & Dartigues, J.-F. Computational techniques for eye movements analysis towards supporting early diagnosis of alzheimer’s disease: a review. Computational and mathematical methods in medicine 2018 (2018).
9 Klein, B. P., Harvey, B. M. & Dumoulin, S. O. Attraction of position preference by spatial attention throughout human visual cortex. Neuron 84, 227-237 (2014).
10 Sheremata, S. L. & Silver, M. A. Hemisphere-dependent attentional modulation of human parietal visual field representations. Journal of Neuroscience 35, 508-517 (2015).
11 Sprague, T. C. & Serences, J. T. Attention modulates spatial priority maps in the human occipital, parietal and frontal cortices. Nature neuroscience 16, 1879 (2013).
12 Vo, V. A., Sprague, T. C. & Serences, J. T. Spatial Tuning Shifts Increase the Discriminability and Fidelity of Population Codes in Visual Cortex. Journal of Neuroscience 37, 3386 (2017).
13 Welbourne, L. E., Morland, A. B. & Wade, A. R. Population receptive field (pRF) measurements of chromatic responses in human visual cortex using fMRI. NeuroImage 167, 84-94 (2018).
14 Stephenson, C. M. E., Knapp, A. J. & Braddick, O. J. Discrimination of spatial phase shows a qualitative difference between foveal and peripheral processing. Vision Research 31, 1315-1326 (1991).
15 Bao, Y. & Pöppel, E. Two spatially separated attention systems in the visual field: evidence from inhibition of return. Cognitive Processing 8, 37 (2007).
16 Yang, T., Strasburger, H., Pöppel, E. & Bao, Y. Attentional modulation of speed-change perception in the perifoveal and near-peripheral visual field. PloS one 13, e0203024 (2018).
Figures