3837
Voluntary action rhythmically modulates 7T BOLD visual responses in primary visual cortex1Department of Translational Research on New Technologies in Medicine and Surgery, University of Pisa, Pisa, Italy, 2IRCCS Stella Maris, Calambrone, Pisa, Italy
Synopsis
Behavioral visual sensitivity modulates rhythmically in synchrony with the onset of a voluntary action. Using 7T fMRI, we demonstrate similar oscillations of primary visual cortex (V1) BOLD responses to brief visual stimuli presented at different delays from the onset of an action. The oscillations are limited to the stimulated V1 region and not to peripheral V1 (which responds to the motor action). The peak responses of V1 BOLD activity are functionally connected to primary motor cortex, suggesting that motor cortex drives the rhythmic oscillation of V1. These results support the suggestion of a possible role of oscillations for visuo-motor coordination.
Introduction
Behavioral visual sensitivity varies rhythmically over time when synchronized by an attention cue1, with another strong sensory stimulus2,3 or with the onset of a voluntary action4–6. These rhythms may emerge from phase-resetting of endogenous neuronal oscillations by motor preparation7, implicating them in sensory-motor coordination. Here we investigate the BOLD correlates of this effect using 7T fMRI, which enabled us to measure responses to brief visual events in early visual cortex and simultaneously monitor activity over the motor cortex.Methods
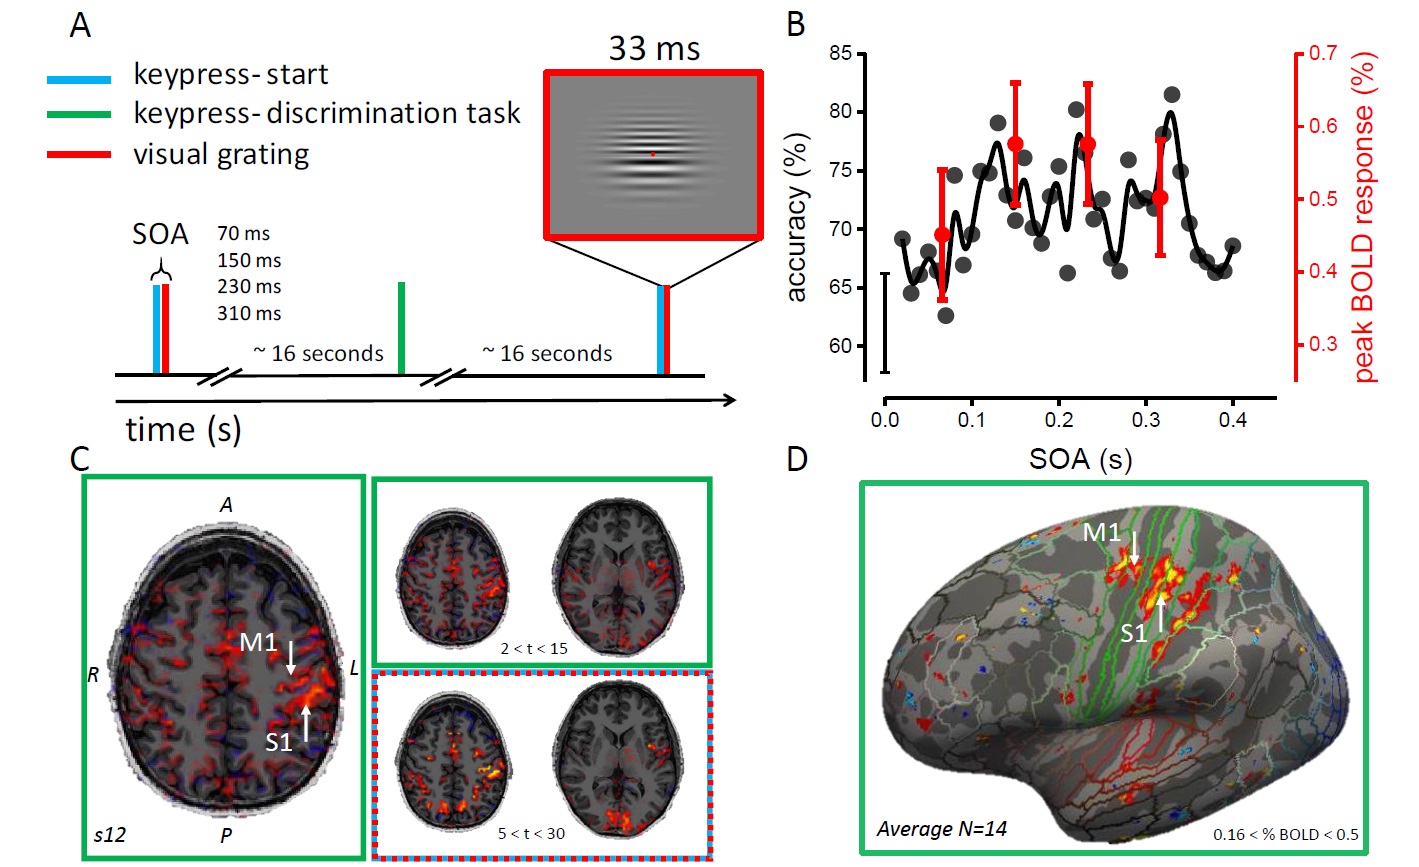
In an event-related design (Figure 1A), we measured in 14 participants the V1 BOLD responses to a 33ms visual stimulus presented at 4 delays (70, 150, 230, 310ms) from the onset of a voluntary action (keypress). The stimulus comprised two half-gratings differing slightly in spatial frequencies; subjects were instructed to report which grating had the higher spatial frequency, by means of a second keypress (different keys). The delay between stimulus presentation and the discrimination-keypress was 16.6±4.6s; the delay between this and the next keypress (which started the following trial) was 16.1±3.8s. In a GE MR950 7T research system, we used a T2*-weighted GE-EPI sequence with TR = 3s, to measure BOLD modulations to discrimination task keypress (keypresses-only) and trial (keypress+visual) events. Functional data were corrected for EPI distortion, motion and slice-time acquisition, and aligned to 3D anatomies with FSL/Freesurfer; for illustration purposes (Figure 1D), fMRI data were further projected to the cortical surfaces of the individual subject and to the average template (Freesurfer “fsaverage”).Results
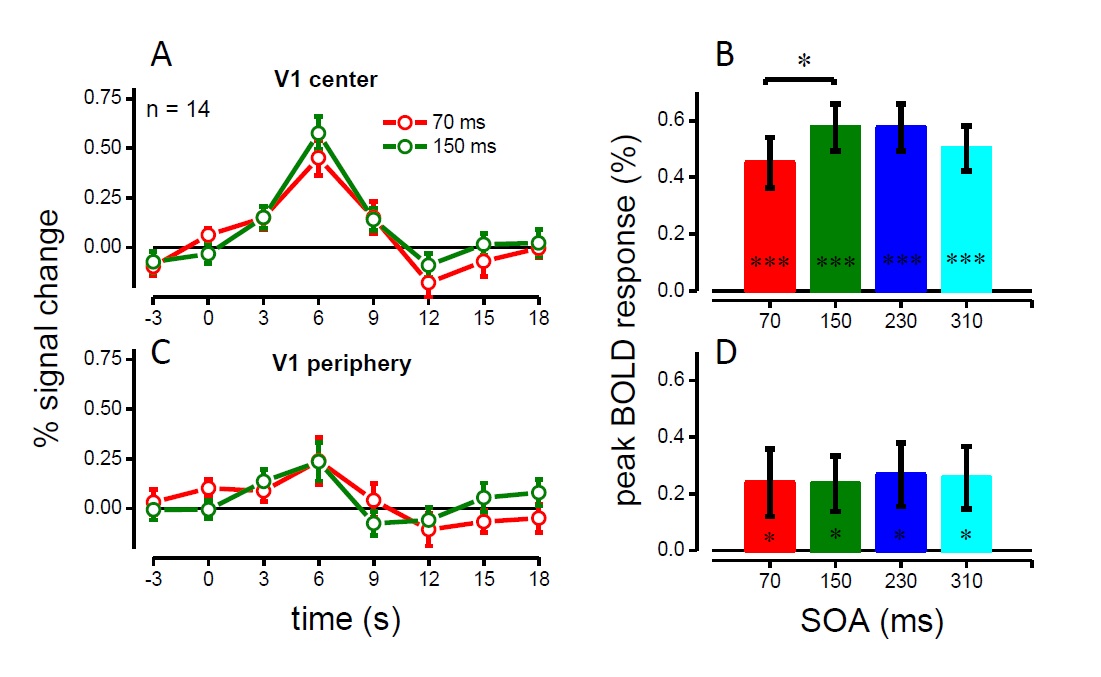
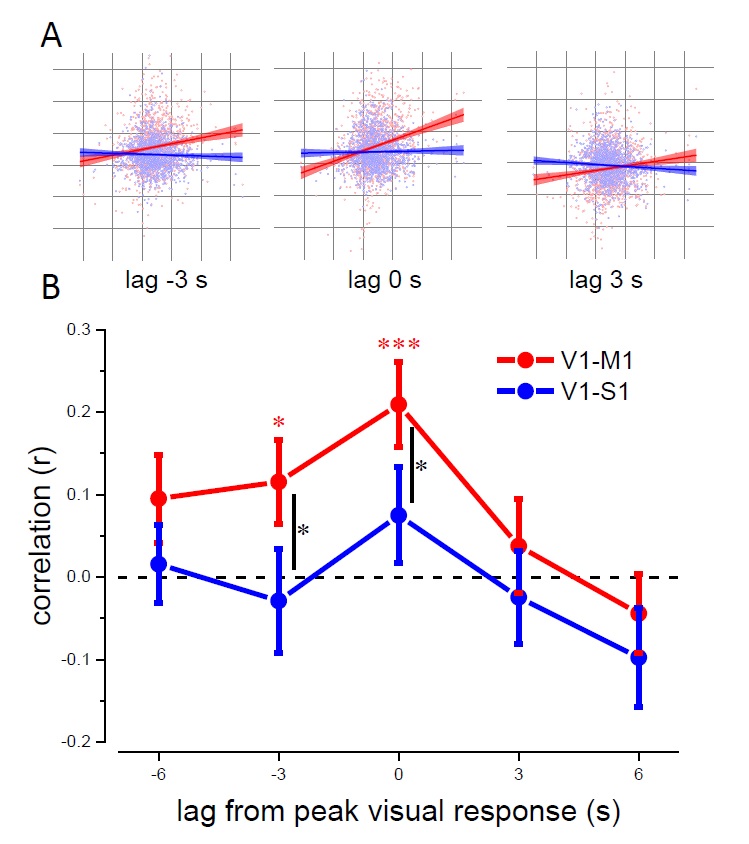
Behavioral visual sensitivity, measured outside the scanner, varied rhythmically over time after the keypress (Figure 1B), with minimum and maximum performance at 70ms and 150ms delay, consistent with Benedetto et al (2016). BOLD responses to keypress-only events (discrimination task) were observed in two separate foci around the Rolandic sulcus, systematically sparing area 3a (Figure 1C-D); we used these activation maps to define the M1 and S1 ROIs. BOLD responses to keypress+visual events were observed in both M1/S1 and in V1 (defined by retinotopic mapping to include the stimulus cortical representation). Crucially, V1 activity was modulated by the visual-to-keypress delay (Figure 2A) – although subjects were unable to distinguish some of these temporal intervals (70 vs 150ms). Activity was lower for stimuli delivered 70ms after the keypress, higher for stimuli at 150ms, and then again lower for longer delay (310ms), echoing the oscillations of perceptual sensitivity (Figure 1B, red: BOLD, black: psychophysics). A second V1 sub-region, defined to include only the periphery beyond our stimulus eccentricity, still showed a small BOLD response to the keypress+visual events (similar to the response to keypress-only events) but no modulation by the visual-to-keypress delay, suggesting that the delay effect is multiplicative on visual responses and probably mediated by a signal of motor origin. To investigate the coupling between visual and motor responses mediating the delay effect, we measured the cross-correlation between V1 activity at the peak of the hemodynamic visual response (6s after the event) and the activity in M1 and S1 (Figure 2). S1 activity was never significantly correlated with V1, but there was a significant correlation between V1 and M1, both at the peak of the visual response, and at preceding TRs, suggesting a functional coupling between V1 and M1.Discussion and Conclusion
Reliable BOLD responses to very brief visual events were measured in V1. V1 responses (within the area representing our stimulus eccentricities) were modulated by the delay between the stimulus and the motor action, consistent with the rhythmical modulation of visual sensitivity measured outside the scanner. The modulation strongly suggests that V1 contributes to the behavioral oscillations, and that these may support motor-visual coordination. We found a strong and selective correlation between BOLD signals in M1 and V1, specifically between the V1 signal at the peak visual evoked response and the M1 signal at the preceding time-points. This further suggests a predictive role of M1 activity in generating the V1 modulation. Our findings, consistent with EEG and behavioral studies, suggest that motor cortex might boost the output signals of early visual cortex to prioritize the processing of information relevant for visuo-motor coordination, and that this mechanism may rely on synchronization of endogenous rhythms.Acknowledgements
This project has received funding from the European Research Council (ERC) under the European Union’s Horizon 2020 research and innovation programme (Grant Agreement No 832813-GenPercept), and from the project "Temporal context in perception: serial dependence and rhythmic oscillations" funded by the MIUR Progetti di Ricerca di Rilevante Interesse Nazionale (PRIN) 2017 - grant 2017SBCPZY_02.References
1. Landau, A. N. & Fries, P. Attention Samples Stimuli Rhythmically. Curr. Biol. 22, 1000–1004 (2012).
2. Romei, V., Gross, J. & Thut, G. Sounds Reset Rhythms of Visual Cortex and Corresponding Human Visual Perception. Current Biology 22, (2012).
3. Fiebelkorn, I. C. et al. Ready, set, reset: stimulus-locked periodicity in behavioral performance demonstrates the consequences of cross-sensory phase reset. J. Neurosci. 31, 9971–81 (2011).
4. Tomassini, A., Spinelli, D., Jacono, M., Sandini, G. & Morrone, M. C. Rhythmic Oscillations of Visual Contrast Sensitivity Synchronized with Action. J. Neurosci. 35, 7019–7029 (2015).
5. Benedetto, A., Spinelli, D. & Morrone, M. C. Rhythmic modulation of visual contrast discrimination triggered by action. Proc. R. Soc. B Biol. Sci. 283, 3536–3544 (2016).
6. Benedetto, A. & Morrone, M. C. Saccadic Suppression Is Embedded Within Extended Oscillatory Modulation of Sensitivity. J. Neurosci. 37, 3661–3670 (2017).
7. Tomassini, A., Ambrogioni, L., Medendorp, W. P. & Maris, E. Theta oscillations locked to intended actions rhythmically modulate perception. Elife 6, e25618 (2017).
Figures