3836
Regional effects of caffeine on BOLD fMRI calibration constant M1University of Calgary, Calgary, AB, Canada, 2National Institute on Aging, National Institutes of Health, Baltimore, MD, United States
Synopsis
Estimating M value using a gas challenge is an essential component of calibrated fMRI. M is the maximal possible BOLD response and reflects baseline physiology such as CBF, CBV and CMRO2. Despite its common use, it is unknown how caffeine ingestion affects M. Here it is demonstrated that caffeine increases M regionally, with frontal brain regions including the paracingulate and anterior cingulate gyrus particularly affected. M increases were found in the context of decreased baseline CBF. These results indicate that caffeine may be implicated in regional uncoupling between CBF and CMRO2 which causes an increase in M.
Introduction
Calibrated fMRI methods improve specificity to neural energetics by quantifying cerebral metabolic rate of oxygen (CMRO2).1, 2 These techniques can be applied to estimate both relative task-induced3, 4 and absolute CMRO25-7.An essential component of calculating CMRO2 is the estimation of the calibration constant M. This constant denotes the maximal possible BOLD signal should all deoxyhemoglobin be removed, and can be calculated from a hypercapnia challenge. The vasodilatory response to increasing partial pressure of carbon dioxide (CO2) increases cerebral blood flow (CBF) and volume. It is generally assumed that mild to moderate hypercapnia does not alter CMRO2, although small decreases may occur8.
Caffeine, a widely used stimulant, is a vasoconstrictor that reduces baseline CMRO2 and increases oxygen extraction fraction (OEF)9. BOLD modulations due to caffeine appear to be region and task-specific10. The present study aimed to characterise region-specific effects of caffeine on M calculations using a hypercapnia challenge. To improve interpretation of caffeine-induced changes, regional baseline CBF measurements were also performed.
Methods
Twenty-three volunteers participated in this repeated-measures study, completing two scans held 48 hours apart. Before each scan, each participant consumed one pill containing either caffeine or placebo, and were blind to the pill manipulation. Caffeine dose was 200mg, consumed 30 minutes before scanning. Participants were asked to abstain from caffeine for a minimum of 12 hours before participation.Imaging was performed on a 3T scanner (Discovery 750, General Electric Healthcare, Waukesha, WI) with a 32-channel head coil, and included a 3D T1-weighted BRAVO (TR/TE = 6.65/2.92 ms, 1mm3). A 6-minute hypercapnia scan using a dual-echo pseudo-continuous arterial spin labelling (pCASL) sequence was implemented for the acquisition of perfusion and BOLD-weighted images (TR/TE1/TE2 = 3700/9.5/30 ms, 3.75x3.75x6mm). A 3D pCASL sequence was acquired to calculate resting CBF (TR/TE = 4844/10.5 ms, 1.875x1.875x4mm).
A fixed-concentration gas mixture consisting of 5% CO2 and 95% medical air was delivered to the participant for two minutes, interleaved with two minutes of medical air, through an MR-compatible breathing circuit11. The gas system included a Digital FloBox model 954 (Sierra Instruments, Monterey, CA, USA) and SideTrak® 840 Analog Gas Mass Flow Controllers (MFCs; Sierra Instruments, Monterey, CA, USA). Biopac MP 150 modules (Biopac Systems Inc., Goleta, CA, USA) and Acqknowledge (v4.4) recorded CO2 and O2 breathing traces.
Data were separated into echoes 1 and 2, and motion corrected using ASLtbx12. In SPM12, all images were coregistered to each subject’s T1, normalised to MNI space and smoothed using a 4mm FWHM kernel. For the first echo, the first-level modelling included 3 regressors:
1) BOLD signal change to the CO2 stimulus, using the timings and durations from end-tidal CO2 values from the end-tidal tracings, convolved with the canonical HRF.
2) ASL tag-control differences, and
3) Perfusion signal change to the CO2 stimulus (the interaction between the first two regressors).
The third regressor was not included in the modelling of echo 2. The resultant beta maps were used to calculate percent signal change13. M maps were then calculated for each subject using the Davis model1-3:
$$ ΔBOLD/ΔBOLD0 = M(1 - (CBF/CBF0)α-β (CMRO2/CMRO2|0)β) $$
with the assumption that CMRO2 remains unchanged during hypercapnia14,15. The coefficient α was set to 0.216 and β was 1.317. The Harvard-Oxford cortical and subcortical atlases18 were used to obtain regional grey matter values. Paired-samples t-tests were performed for each region-of-interest (ROI) to statistically compare regional M values and resting CBF between caffeine and placebo conditions. A Bonferroni-corrected P threshold for 53 tests (i.e. number of ROIs) is 0.0009, however this correction is overly conservative; all P values are therefore reported uncorrected.
Results
The group averaged M maps for the placebo and caffeine conditions are shown in Figure 1. Eleven atlas regions were excluded from the analyses due to signal loss or inadequate signal changes to CO2. Mean M values and resting CBF were obtained for 53 ROIs. For M values, the region showing the largest difference between caffeine and placebo was the paracingulate gyrus (P = 0.00089), with M values higher in the caffeine condition (see Figure 2). Overall, the highest mean M value was found for the cuneal cortex for both the caffeine and placebo conditions (see Table 1). The mean M values for caffeine and placebo conditions are shown in Figure 3. Resting CBF was significantly reduced in the caffeine relative to placebo condition in all assessed ROIs (Table 1).Discussion
Caffeine increased M in the paracingulate and anterior cingulate gyrus, and significantly reduced baseline CBF in all ROIs. M is dependent on numerous baseline physiological parameters including CBF, CBV, CMRO2 and OEF19. These observed M increases with caffeine can be explained by numerous different interactions between these parameters. For instance, CMRO2 modulations with uncoupled CBF changes can increase M. The pertinence of the cingulate regions requires further investigation. However, these regions are known to be highly implicated in networks associated with attention.20 It can be speculated that caffeine-induced changes in arousal may have altered CMRO2, while vasocontrictive effects reduced concomitant CBF changes.Conclusions
Caffeine ingestion significantly increases M values in the cingulate regions, in the context of decreased resting CBF across the cortex. This should be considered when using calibrated BOLD to estimate CMRO2.Acknowledgements
No acknowledgement found.References
1. Hoge RD, Atkinson J, Gill B, Crelier GR, Marrett S, Pike GB. Investigation of BOLD signal dependence on cerebral blood flow and oxygen consumption: the deoxyhemoglobin dilution model. Magnetic resonance in medicine : official journal of the Society of Magnetic Resonance in Medicine / Society of Magnetic Resonance in Medicine 1999; 42(5): 849-863.
2. Davis TL, Kwong KK, Weisskoff RM, Rosen BR. Calibrated functional MRI: mapping the dynamics of oxidative metabolism. Proceedings of the National Academy of Sciences of the United States of America 1998; 95(4): 1834-1839.
3. Hoge RD, Atkinson J, Gill B, Crelier GR, Marrett S, Pike GB. Linear coupling between cerebral blood flow and oxygen consumption in activated human cortex. Proceedings of the National Academy of Sciences of the United States of America 1999; 96(16): 9403-9408.
4. Blockley NP, Griffeth VE, Simon AB, Buxton RB. A review of calibrated blood oxygenation level-dependent (BOLD) methods for the measurement of task-induced changes in brain oxygen metabolism. NMR Biomed 2013; 26(8): 987-1003.
5. Bulte DP, Kelly M, Germuska M, Xie J, Chappell MA, Okell TW et al. Quantitative measurement of cerebral physiology using respiratory-calibrated MRI. Neuroimage 2012; 60(1): 582-91.
6. Gauthier CJ, Desjardins-Crépeau L, Madjar C, Bherer L, Hoge RD. Absolute quantification of resting oxygen metabolism and metabolic reactivity during functional activation using QUO2 MRI. Neuroimage 2012; 63(3): 1353-63.
7. Wise RG, Harris AD, Stone AJ, Murphy K. Measurement of OEF and absolute CMRO2: MRI-based methods using interleaved and combined hypercapnia and hyperoxia. Neuroimage 2013; 83: 135-47.
8. Driver ID, Wise RG, Murphy K. Graded Hypercapnia-Calibrated BOLD: Beyond the Iso-metabolic Hypercapnic Assumption. Front Neurosci 2017; 11: 276.
9. Merola A, Germuska MA, Warnert EA, Richmond L, Helme D, Khot S et al. Mapping the pharmacological modulation of brain oxygen metabolism: The effects of caffeine on absolute CMRO. Neuroimage 2017; 155: 331-343.
10. Diukova A, Ware J, Smith JE, Evans CJ, Murphy K, Rogers PJ et al. Separating neural and vascular effects of caffeine using simultaneous EEG-FMRI: differential effects of caffeine on cognitive and sensorimotor brain responses. Neuroimage 2012; 62(1): 239-49.
11. Tancredi FB, Lajoie I, Hoge RD. A simple breathing circuit allowing precise control of inspiratory gases for experimental respiratory manipulations. BMC Res Notes 2014; 7: 235.
12. Wang Z, Aguirre GK, Rao H, Wang J, Fernandez-Seara MA, Childress AR et al. Empirical optimization of ASL data analysis using an ASL data processing toolbox: ASLtbx. Magnetic resonance imaging 2008; 26(2): 261-269.
13. Pernet CR. Misconceptions in the use of the General Linear Model applied to functional MRI: a tutorial for junior neuro-imagers. Front Neurosci 2014; 8: 1.
14. Chen JJ, Pike GB. Global cerebral oxidative metabolism during hypercapnia and hypocapnia in humans: implications for BOLD fMRI. Journal of cerebral blood flow and metabolism : official journal of the International Society of Cerebral Blood Flow and Metabolism 2010; 30(6): 1094-1099.
15. Chen JJ, Pike GB. MRI measurement of the BOLD-specific flow-volume relationship during hypercapnia and hypocapnia in humans. NeuroImage 2010; 53(2): 383-391.
16. Chen JJ, Pike GB. BOLD-specific cerebral blood volume and blood flow changes during neuronal activation in humans. NMR in biomedicine 2009; 22(10): 1054-1062.
17. Mark CI, Fisher JA, Pike GB. Improved fMRI calibration: precisely controlled hyperoxic versus hypercapnic stimuli. NeuroImage 2011; 54(2): 1102-1111.
18. Desikan RS, Ségonne F, Fischl B, Quinn BT, Dickerson BC, Blacker D et al. An automated labeling system for subdividing the human cerebral cortex on MRI scans into gyral based regions of interest. Neuroimage 2006; 31(3): 968-80.
19. Lu H, Hutchison J, Xu F, Rypma B. The Relationship Between M in "Calibrated fMRI" and the Physiologic Modulators of fMRI. Open Neuroimag J 2011; 5: 112-9.
20. Petersen SE, Posner MI. The attention system of the human brain: 20 years after. Annual Review of Neuroscience 2012; 35: 73-89.
Figures
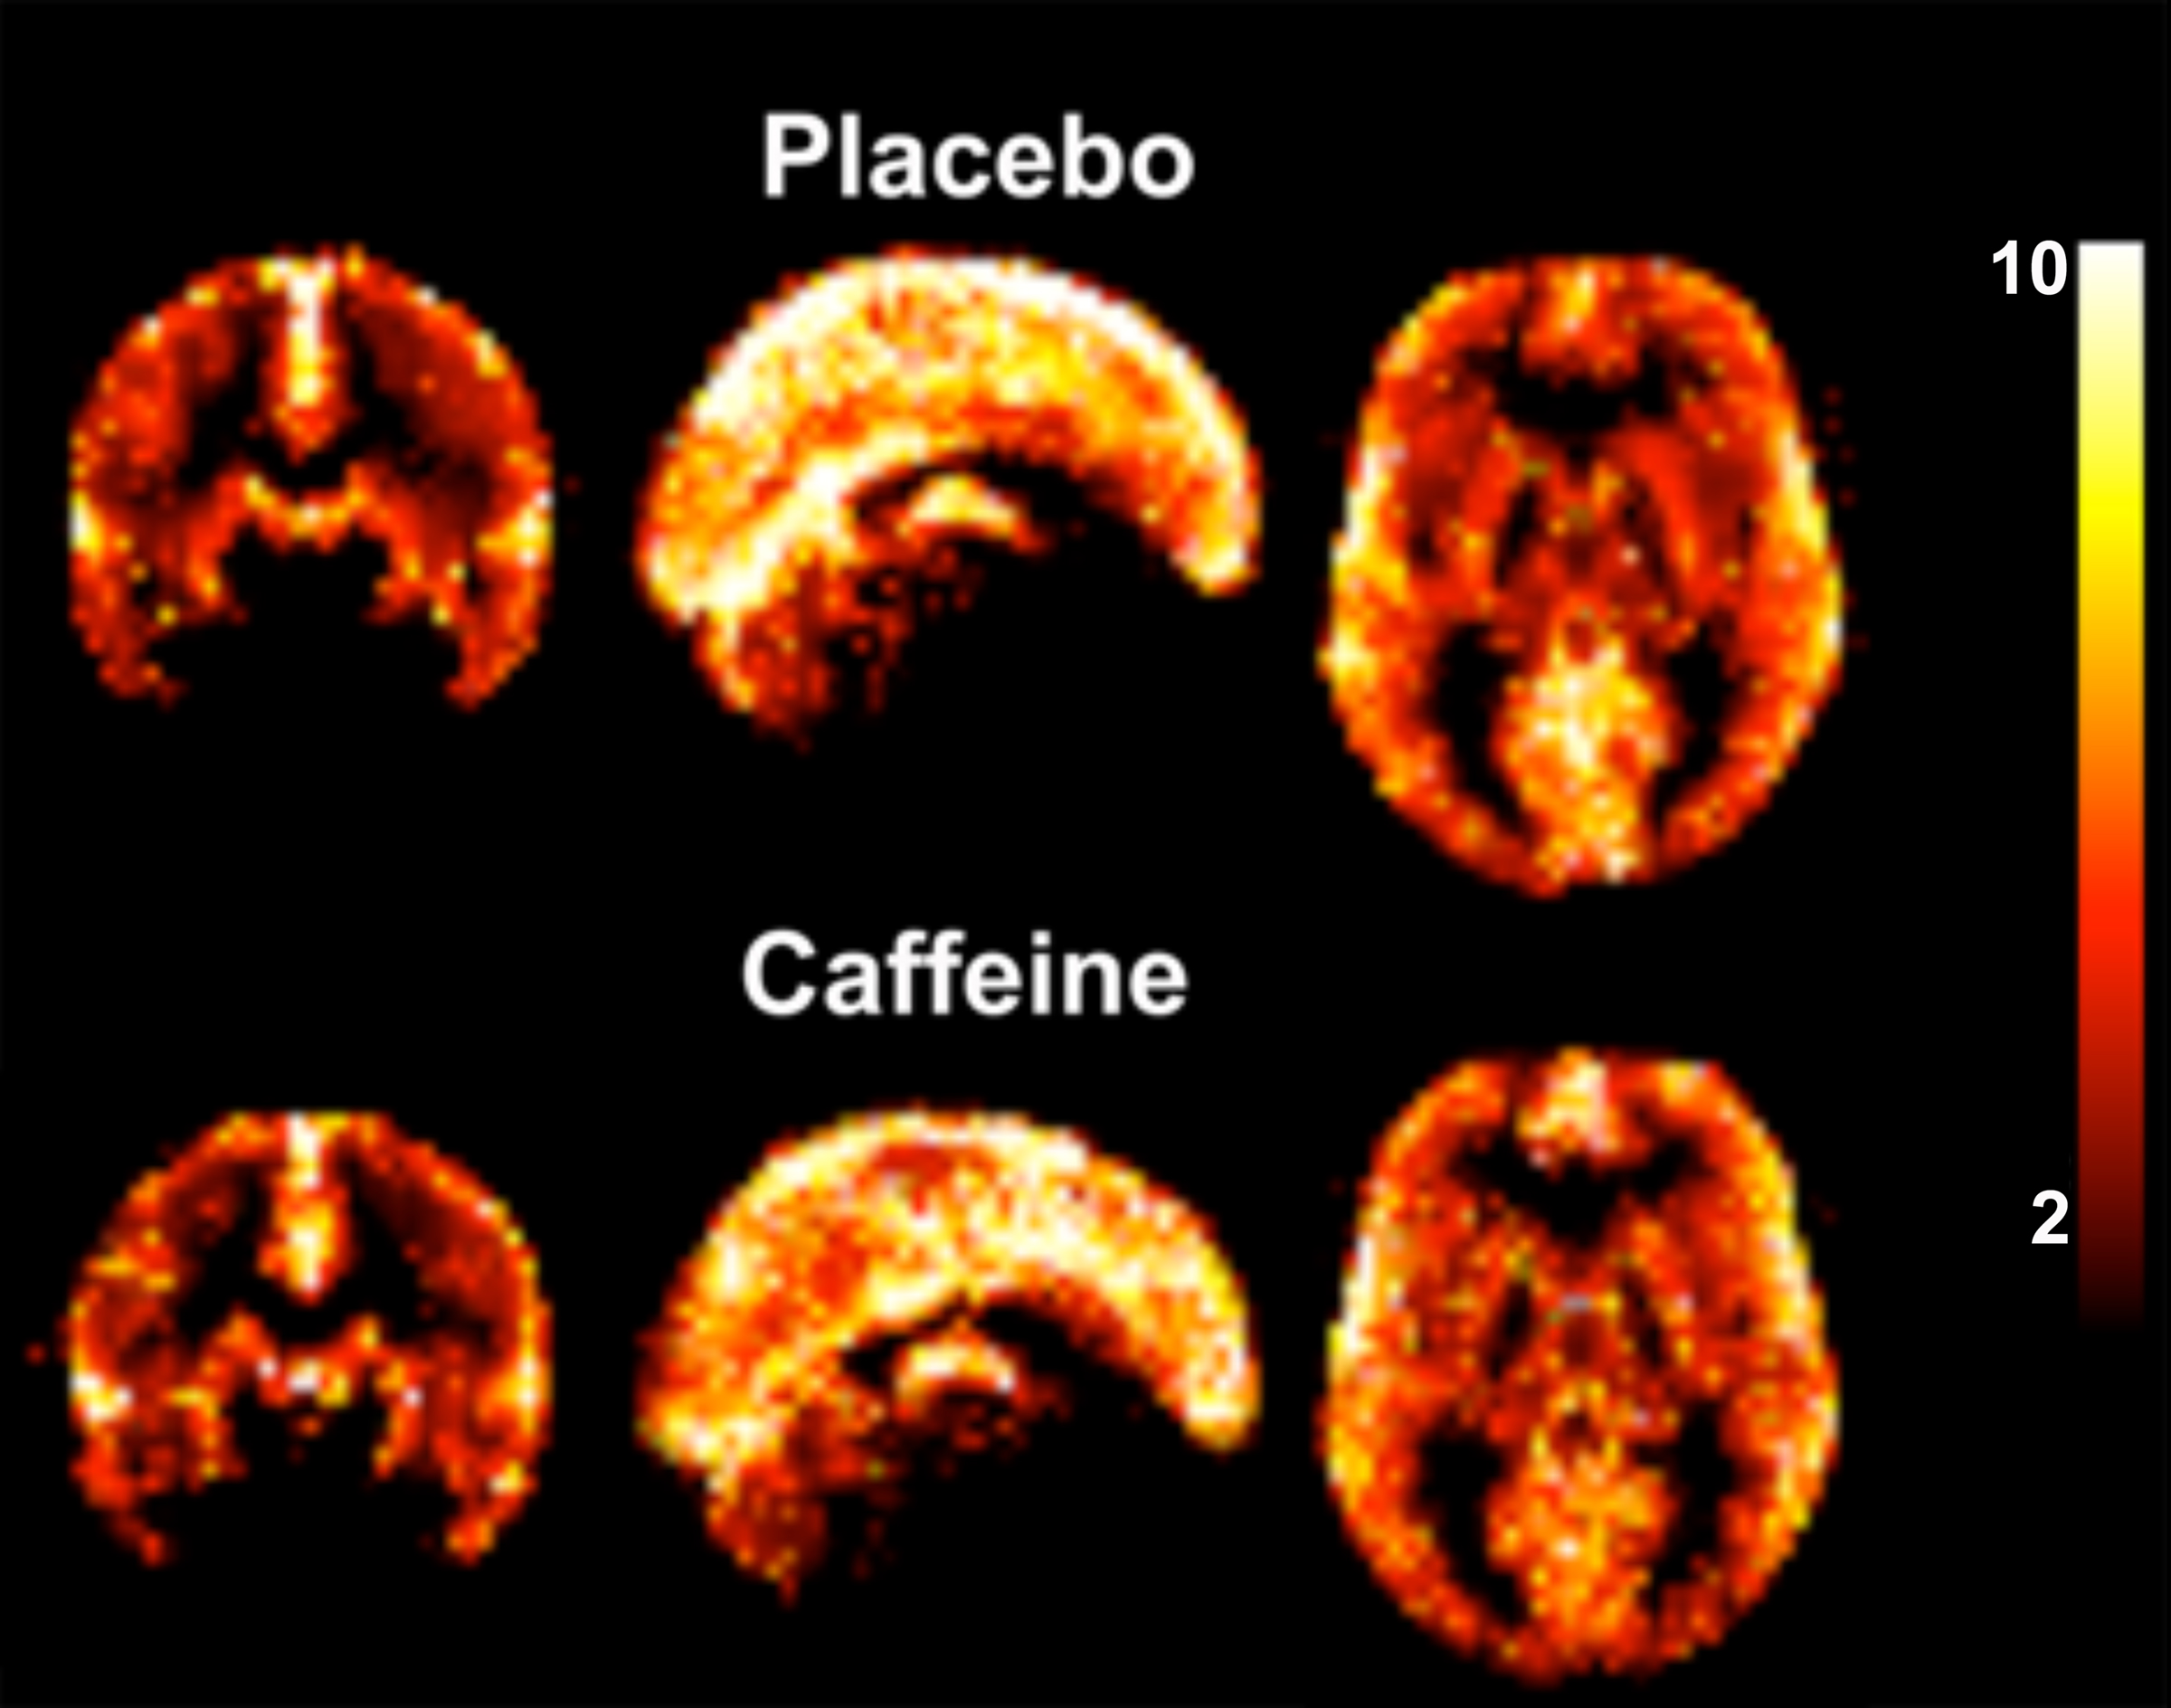
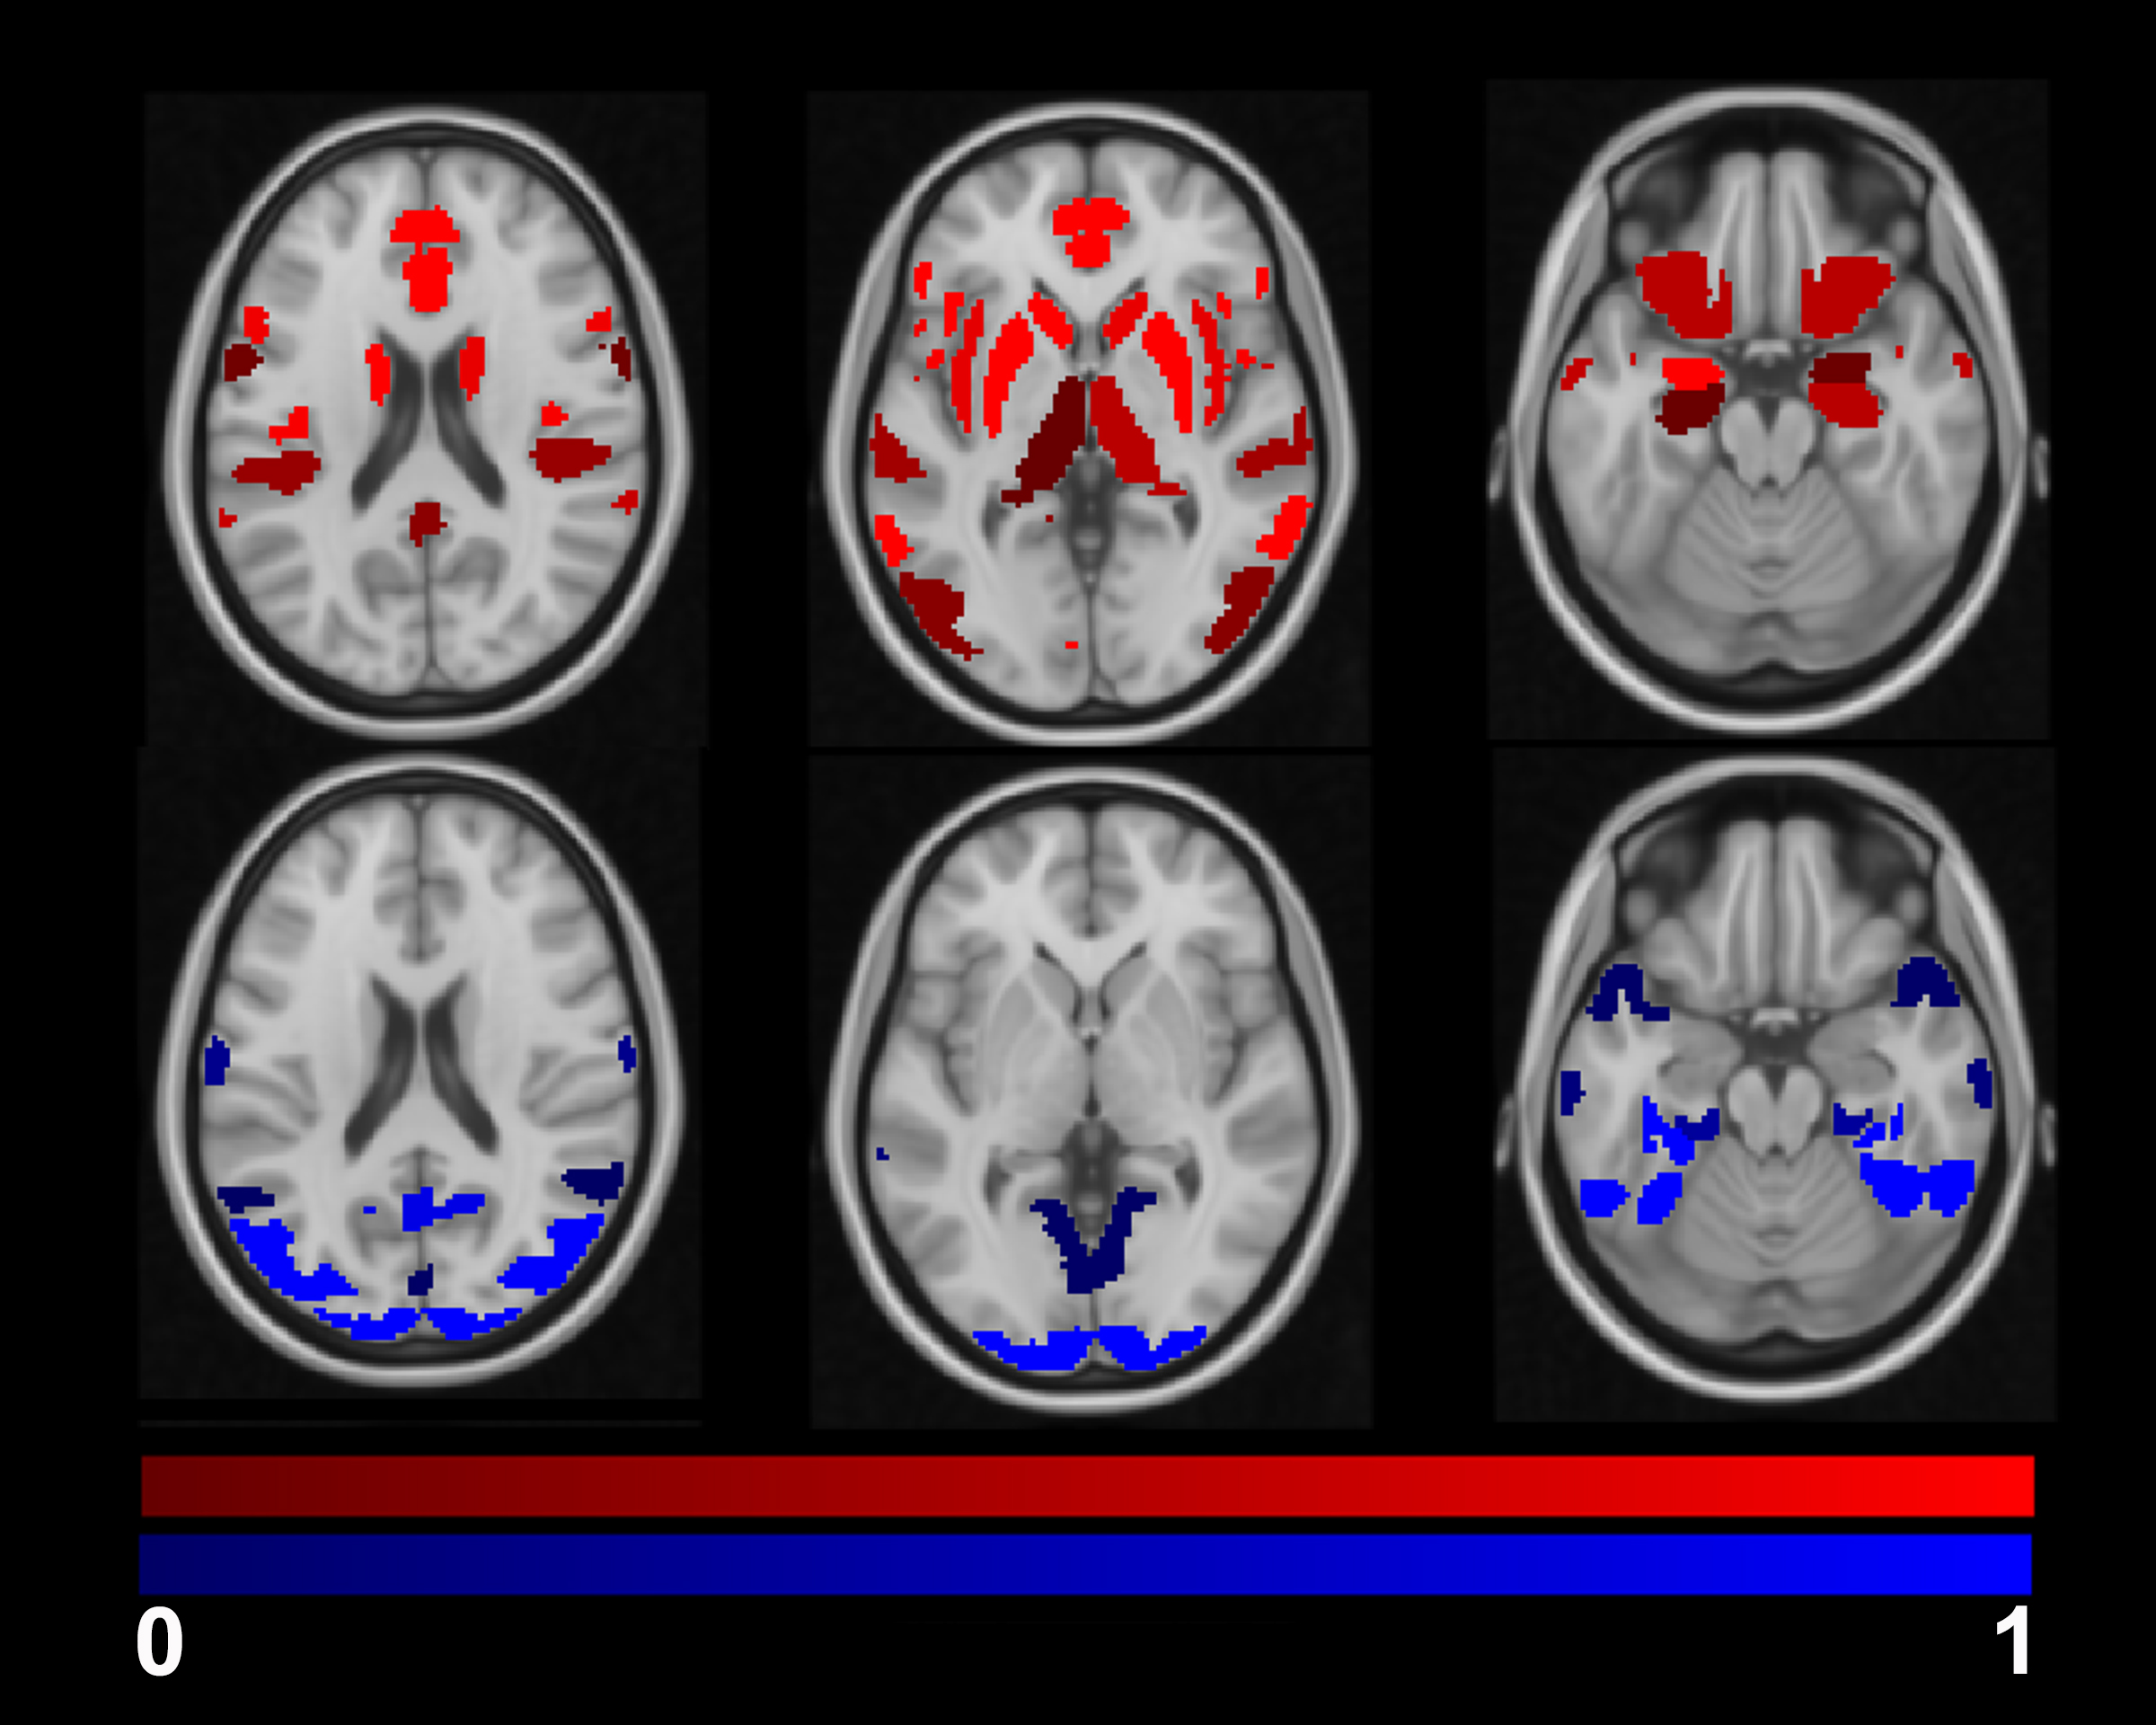
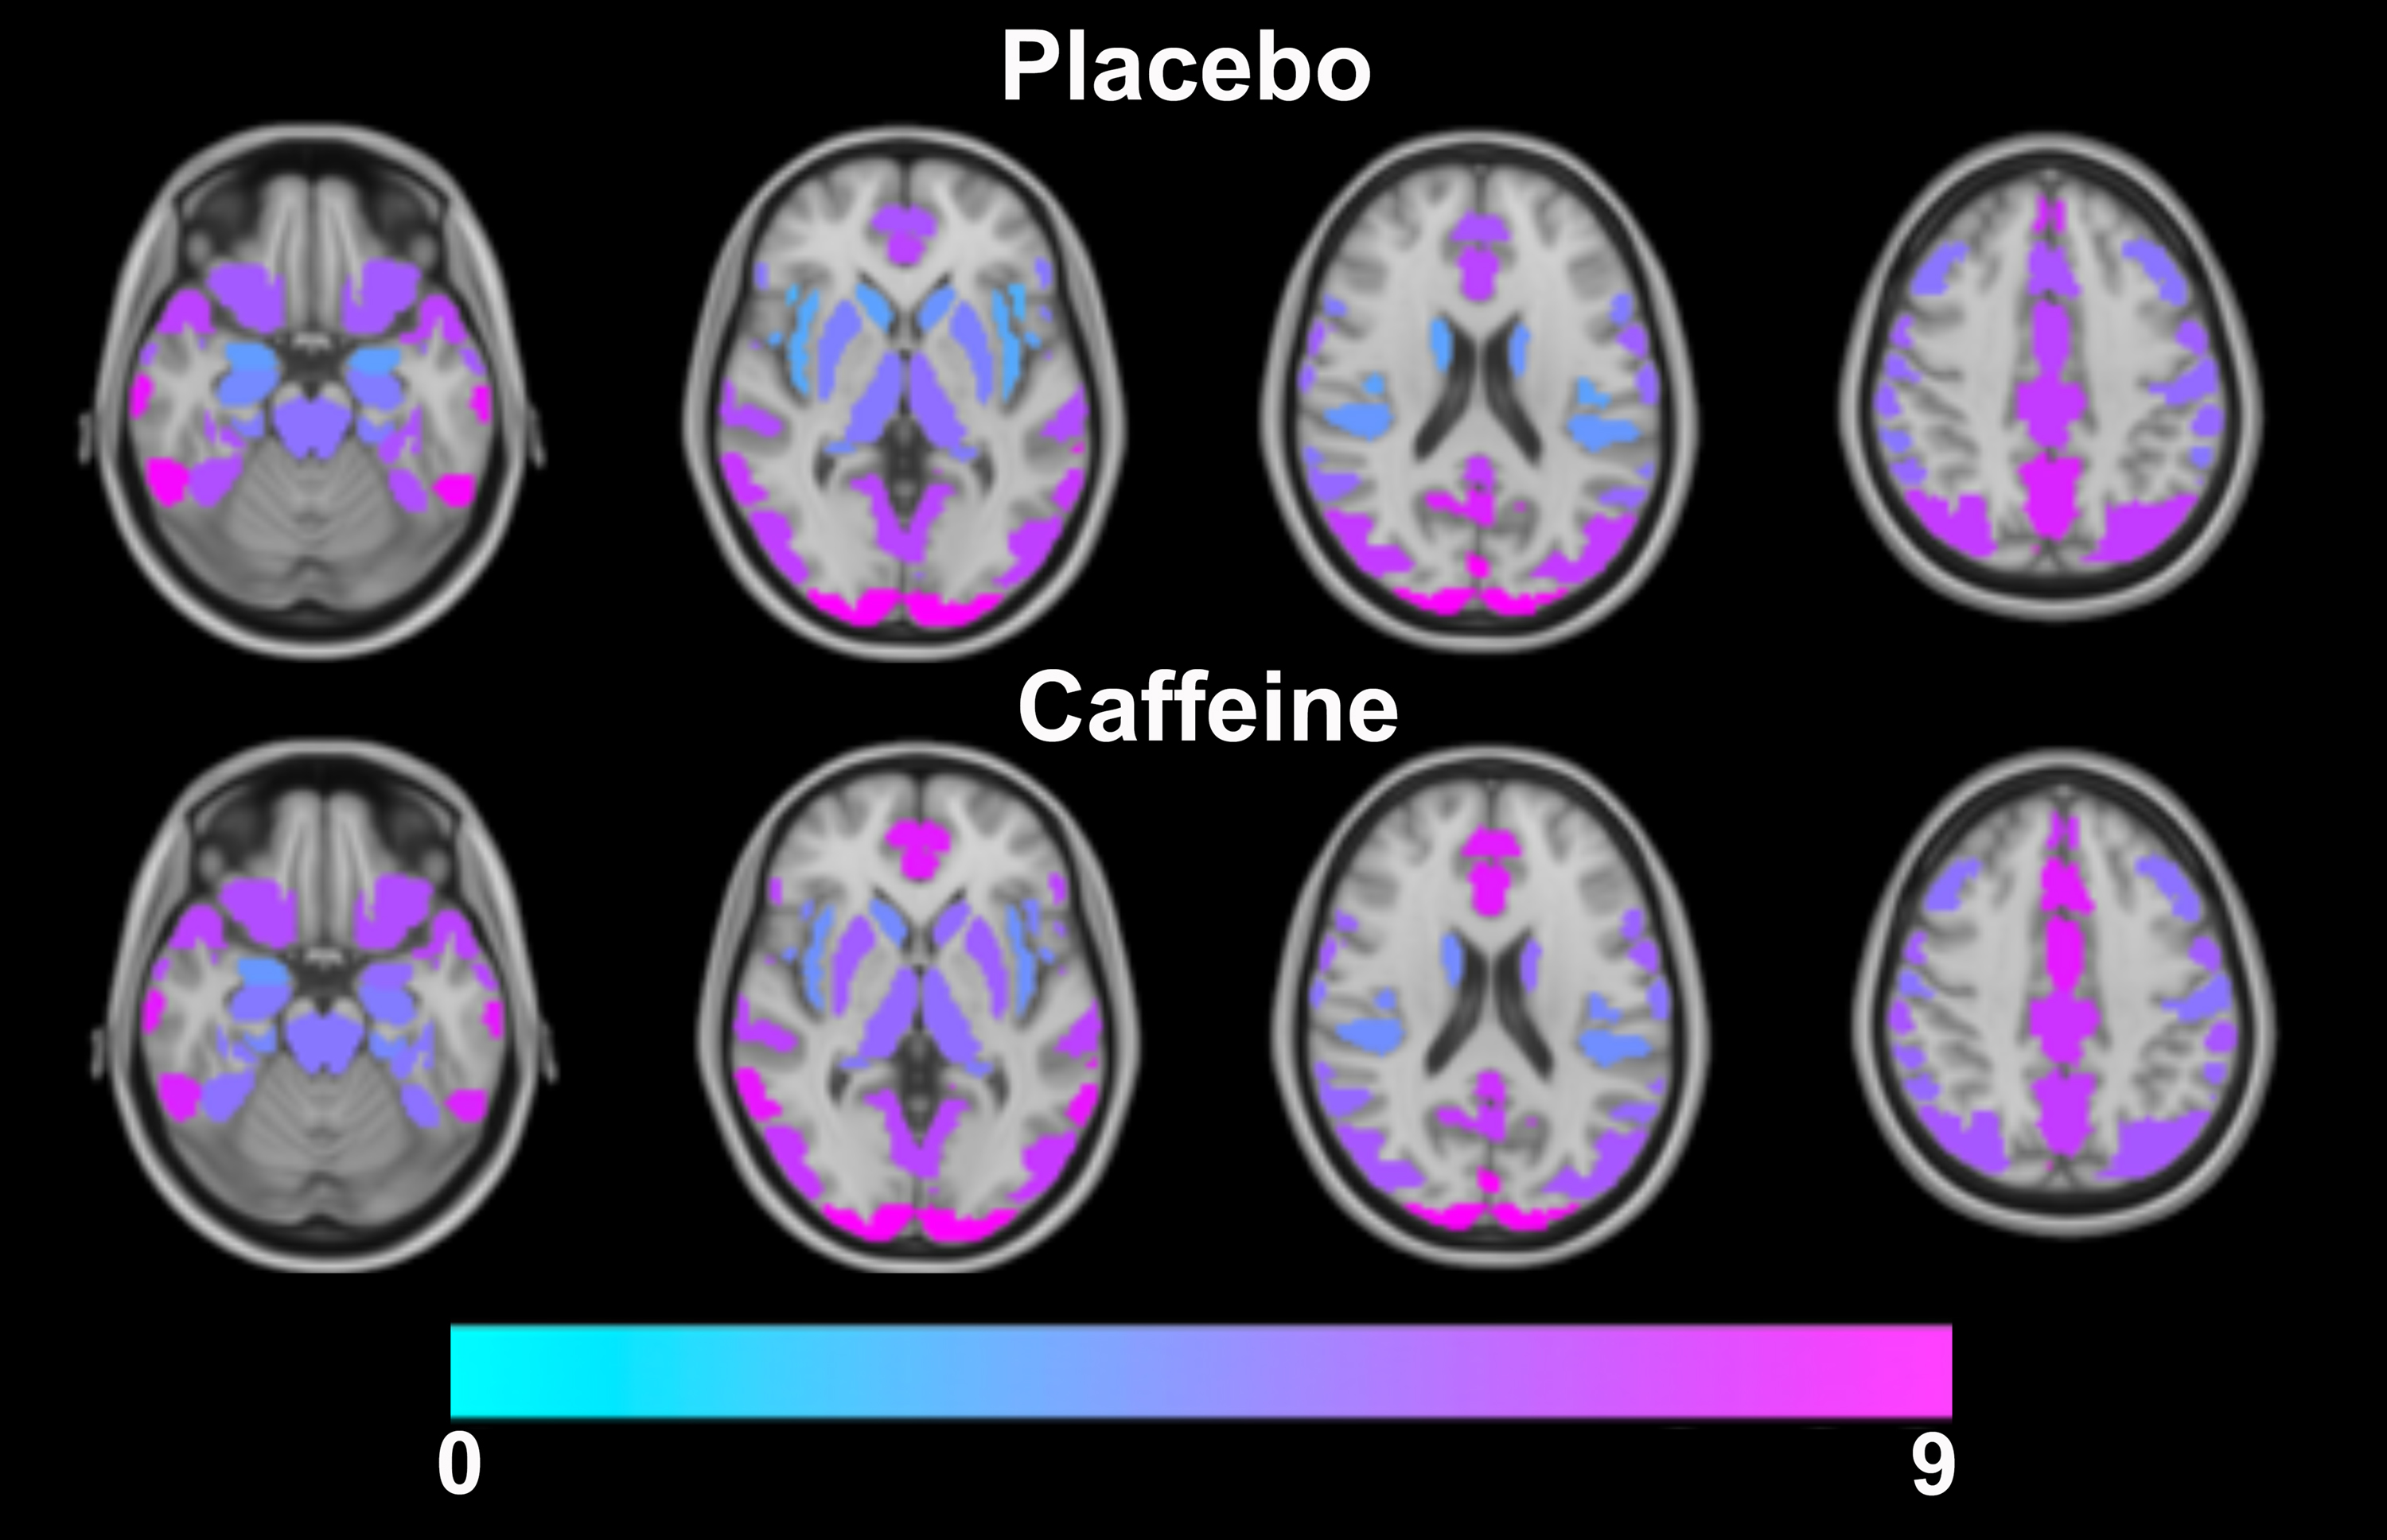
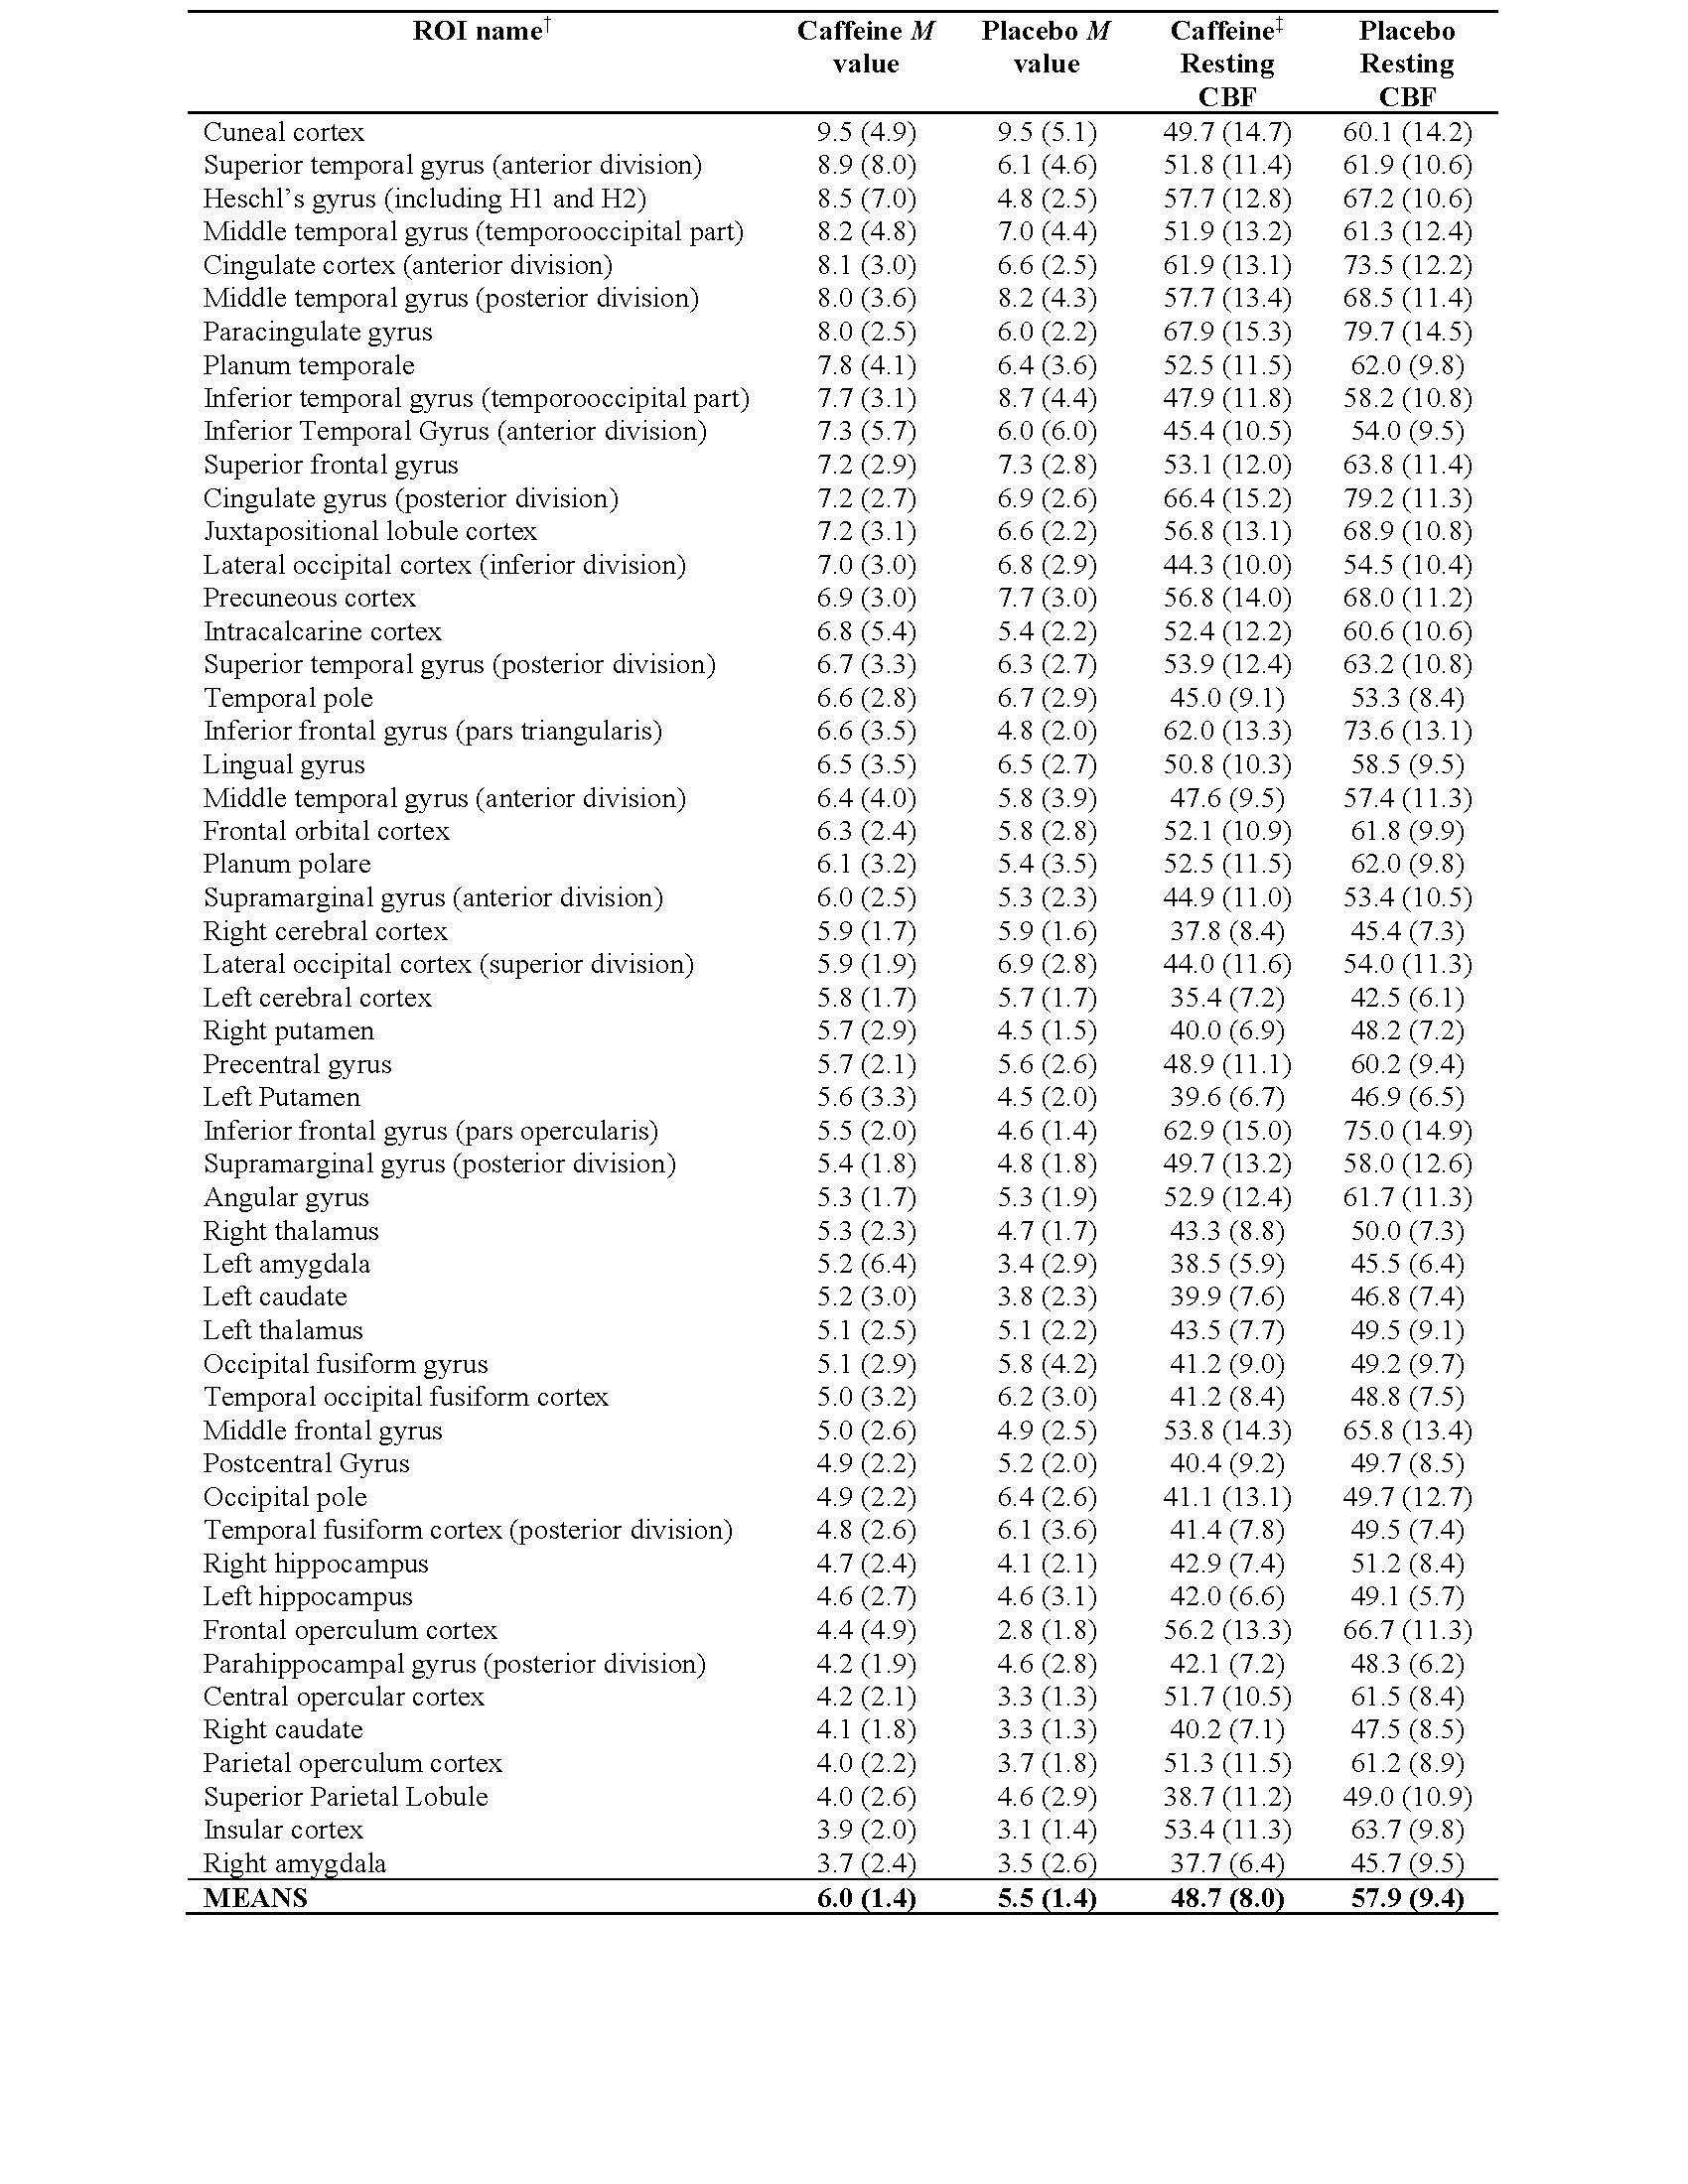
Table 1. Group means for M value (%) and resting CBF (mL/100g/min) with standard deviations in parentheses. All assessed regions-of-interest (ROIs) are shown for the caffeine and placebo conditions.
†The ROIs are from the Harvard-Oxford cortical and sub-cortical atlases, and are sorted by mean (largest to smallest) according to M value of caffeine condition.
‡For comparisons of CBF, all ROIs showed significantly reduced CBF for the caffeine (vs. placebo) condition at a Bonferroni-corrected threshold (P < 0.0009).