3835
Respiratory related brain pulsations are disturbed in epilepsy1Medicine, Radiology, OFNI, University of Oulu, Oulu, Finland, 2University of Oulu, Oulu, Finland, 3Oulu University Hospital, Oulu, Finland, 4University of Freiburg, Freiburg, Germany
Synopsis
Fast-fMRI has become a potent tool in researching brain physiology more accurately than before and it can detect changes in the blood oxygen level‐dependent signal, even if there is no epileptiform activity present. These detectable changes suggest that in epilepsy there are alterations in the brain physiology. With utilization of coefficient of variation (CV) method for patients with epilepsy (PWE), we detected a robust increase of CV in patients with in white matter, brainstem and temporal lobes in PWE at group level. Importantly, individual mapping of possible epileptic abnormality is also possible.
Introduction
Epilepsies are a diverse group of chronic brain diseases and usual diagnostic measures fall often short in the absence of detectable epileptiform activity in EEG or visible cause in anatomical MRI. Utilizing whole brain 10Hz fast-fMRI sequence (Magnetic Resonance Encephalography, MREG) enables precise detection of epileptic spike activity1. With MREG it is also possible to evaluate the propagation of cardiorespiratory pulsations in their own sub-bands2. We have shown before, that patients with epilepsy (PWE) have altered coefficient of signal variation (CV) in fast-fMRI, especially in respiratory band3. Now, we further estimated physiological sources of altered signal stability in fast-fMRI with bigger group sizes.Methods
After informed consent 102 healthy controls (HC, age 37.5 ± 15.4 years, 51 females) and 33 PWE subjects (age 34.6 ± 10.2 years, 21 females), were imaged using Siemens 3T MRI with fast-fMRI (MREG, TR = 100ms, TE = 36 ms, FA = 25º, 3 mm3 voxel), sequence similar as our previous study3. MREG is a 3D single shot stack of spirals sequence that under-samples k-space to reach a sampling rate of 10 Hz allowing critical imaging of physiological pulsations4. Subjects were imaged both in University of Oulu and University of Freiburg for 5-minute scanning (2861 volumes). Standard FSL pre-processing5 with FIX-ICA, was used6. The patients were diagnosed with focal epilepsy and were on ongoing use of anti-epileptic drugs.The data was band-pass filtered to very low frequency (VLF = 0.01-0.1 Hz), respiratory (0.11-0.51 Hz) and cardiac (0.8-1.76 Hz) for CV and FFT power calculations. Voxel-wise CV was calculated as CV = σ /μ, where μ = signal mean and σ = standard deviation. Sum of spectral power density (SPD) was calculated for specific band, if CV group differences were significant in that band. FSL randomise (TFCE corrected, 50 000 non-parametric perm., age and relative motion as covariates) was used to evaluate group differences. The standard score of SPD maps were calculated over healthy control population and were compared to PWE group. Spectrogram was calculated for 62 blocks over time and frequency band was divided for 1024 sections.
Results
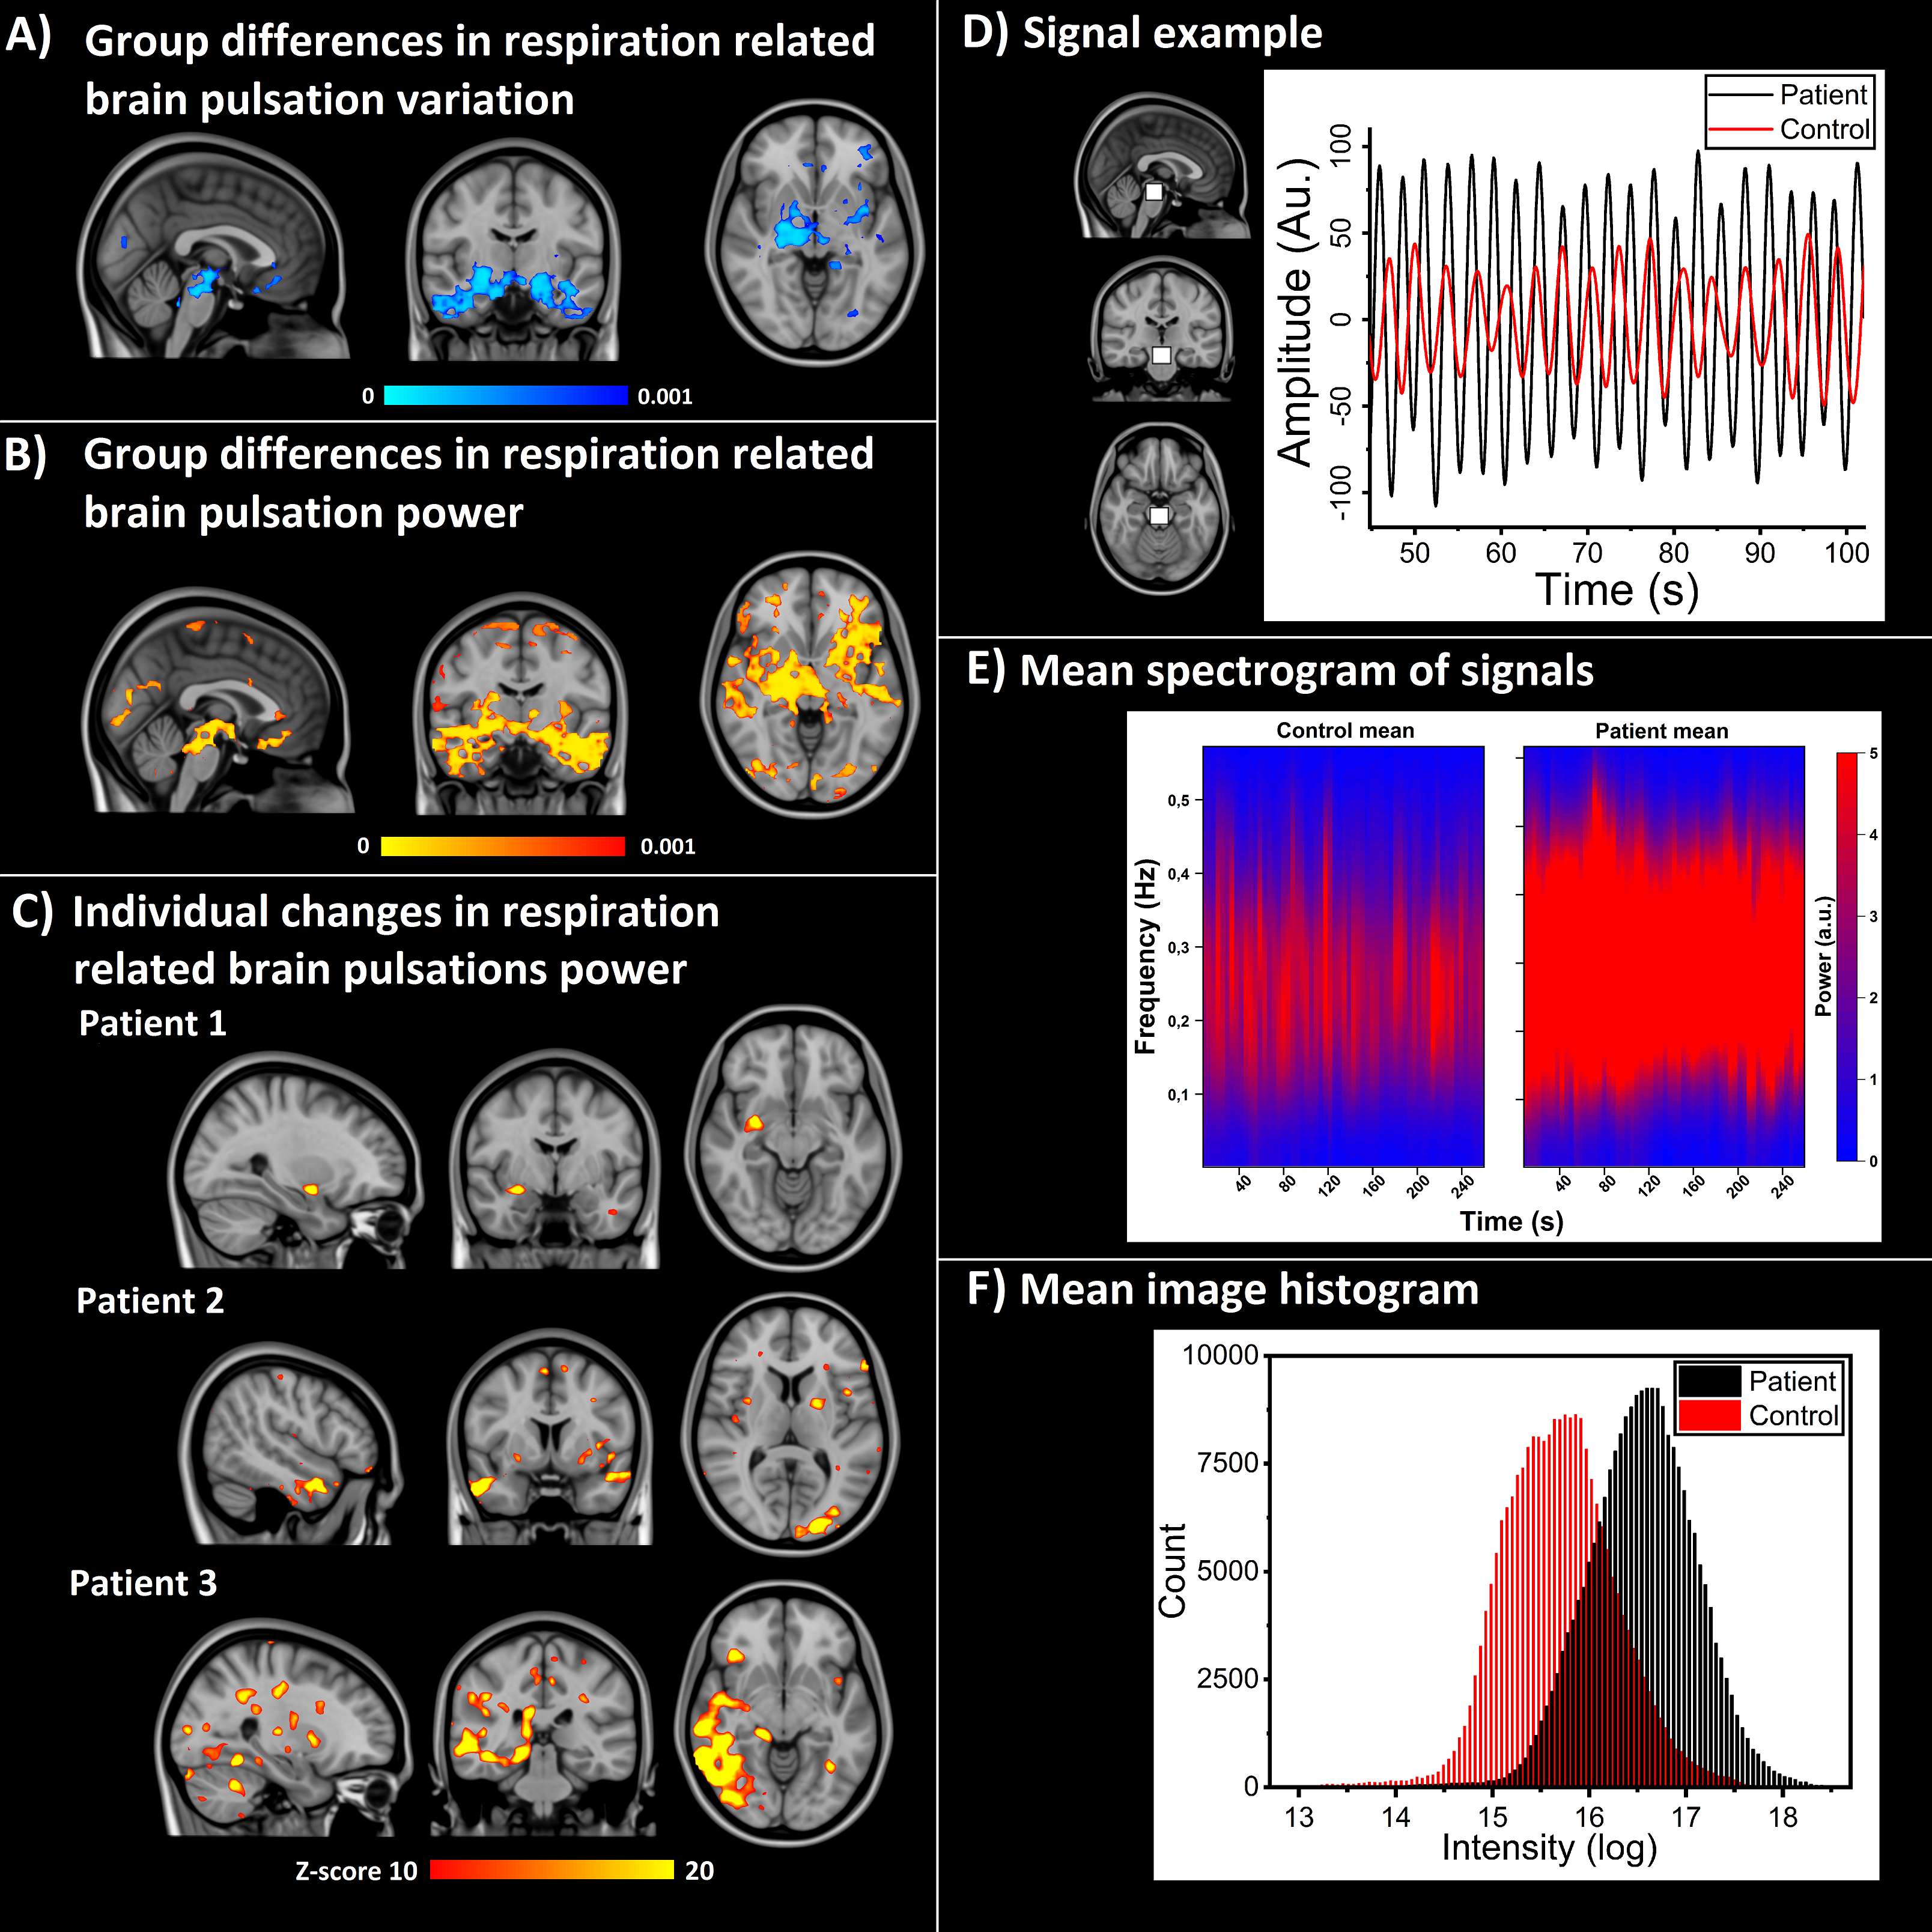
Only respiratory band signal showed elevated CV (p < 0.001, Fig.1A) and even more distinctively elevated SPD (p < 0.001, Fig.1B) in basal and temporal brain areas. Individually PWE had SPD power over 10 standard deviations above control mean in 25/33 cases, while healthy controls had zero voxels above the same threshold. Patient examples is seen in Fig. 1C. An example of signal difference from brainstem region of interest between subjects is shown in Fig.1D. Mean spectrogram and mean SPD histograms from both groups, can be seen in Fig.1E, F respectively. VLF and cardiac bands did not show any statistical differences in CV and thus SPD maps were not calculated. There were no statistical differences in motion or physiological parameters.Conclusion
These results show that the power of respiratory related pulsations of the epileptic brain was distinctly and significantly bigger than controls, specifically in brain areas that control respiration. Especially in individual level, PWE had markedly elevated SPD power, which indicates that focal physiological brain pulsation abnormality could be influencing epileptiform activity. Furthermore, it has been shown before that in intractable epilepsy, respiration drives intracranially measured EEG7.Acknowledgements
This work was supported by grants from Finnish Academy grants 275352, 123772 (VKi), Jane and Aatos Erkkos Foundation (VKi), KEVO grants from Oulu University Hospital (VKi), The University of Oulu Scholarship Foundation (JK), Medical Research Center (MRC) -Oulu (JK). We thank all the study subjects for participating in the study and all people who have collected the these datasets in both Finland and Germany. We also thank Jussi Kantola for computational administration and CSC – IT Center for Science Ltd. Finland for providing computational services.References
1. Jacobs, J. et al., 2014, Neuroimage. 88, 282-294.
2. Kiviniemi V. et al., 2016, JCBFM, 36(6):1033-45
3. Kananen J. et al., 2018, Brain and Behavior, 8(9): e01090
4. Asslaender et al., 2013, NeuroImage 73, 59-70.
5. Jenkinson M. et al., 2012, NeuroImage 62, 782-790.
6. Griffanti, L. et al., 2014. Neuroimage 95, 232-247.
7. Zelano C. et al., 2016, J Neurosci 36(49),12448-12467.
Figures