3834
CBF alteration in human obesity: An arterial spin labeling study1Department of Biomedical Imaging and Radiological Science, China Medical University, Taichung, Taiwan, 2Department of Radiology, China Medical University Hospital, Taichung, Taiwan
Synopsis
Obesity is accompanied with damage to several organs including the brain. Although an extensive body of neuroimaging literature indicates that brain structure deteriorates with obesity, little information related to the relationship between CBF and obesity is available. In this study, we investigated the potential influence of body mass index (BMI) on brain abnormalities in young adults by combining functional and structural MRI studies. Results show CBF measured with the noninvasive MRI technique decreased as the BMI increased, as manifested by altered CBF in thalamus and visual-associated areas, including Brodmann areas (BA)7, BA18, and BA19
Introduction
Obesity causes damage to several organs, including the brain. Recent studies have been focusing on understanding the mechanisms through which obesity affects brain structure and function using neuroimaging techniques. Morphological MRI studies have showed that obese subjects have abnormal density1 and thickness2 of gray matter (GM), specifically in areas involved in behavioral control and reward processing. Functional biomarker, such as cerebral blood flow (CBF), is a powerful tool to probe neural dysfunction. However, till date, there is little information available regarding the relationship between CBF and obesity. Another overlooked aspect in the earlier studies is that majority of studies on obesity have covered life stages from adolescence to old age,1, 2 whereas only a few studies has specifically focused on an early adulthood sample. Therefore, the central goal of this study was to investigate the potential effect of obesity on brain perfusion in a young cohort aged 20–30 years in terms of both global and regional analyses. This narrow age range has a favorable effect on removing the age-related pathology and therefore truly reflects the obesity-related alterations in CBF in mature brains.Methods
Study design: Twenty-one obese [body mass index (BMI) > 26 kg/m2] and 21 lean (BMI < 24 kg/m2) right-handed volunteers were recruited in this study. All subjects were aged between 20 to 30 years old. There were 19 males and 2 females in both groups. Informed consent was obtained using IRB-approved protocol. MRI measurement: Magnetic resonance imaging was performed at a 3T GE scanner (GE, Signa, Excite HDxt, Wisconsin, USA). The MRI protocol consisted of a T1-weighted (T1W) fast spoiled gradient echo (FSPGR) and a pseudo-continuous arterial spin labeling (pCASL) sequence. The scan parameters of the FSPGR sequence were as follows: TR/ TE/flip angle=8.02 ms/2.99ms/12°, TI = 450ms, spatial resolution = 1 × 1 × 1 mm3, and number of slices = 170. Scan parameters of the pCASL sequence were as follows: TR/ TE/ flip angle=4600 ms/9.8ms/12°, post labeling delay = 1.8 s, labeling duration = 1.5 s, single-shot echo planar imaging, and 30 pairs of label and control images. Data analysis: To quantify the perfusion-weighted maps of the pCASL sequence as CBF maps, a single-compartment model was used.3 All the CBF maps were co-registered to the subject’s structural images and the MNI space. The region of interest of whole brain GM from the T1W image was delineated by FSL software for each subject. The generated GM mask was also applied to the CBF map to obtain the subject-specific whole brain GM CBF (CBFGM). A multiple regression analysis was performed to examine the difference in global CBFGM between the groups. CBFGM was assigned as the dependent variable, whereas age, sex and weight status category (obese or lean) were used as the independent variables. To assess regional-specific differences between the groups, the voxel-by-voxel analysis was performed by the second-level analysis from SPM, with age, sex, and weight status category (obese or lean) used as the independent variables.Results and Discussion
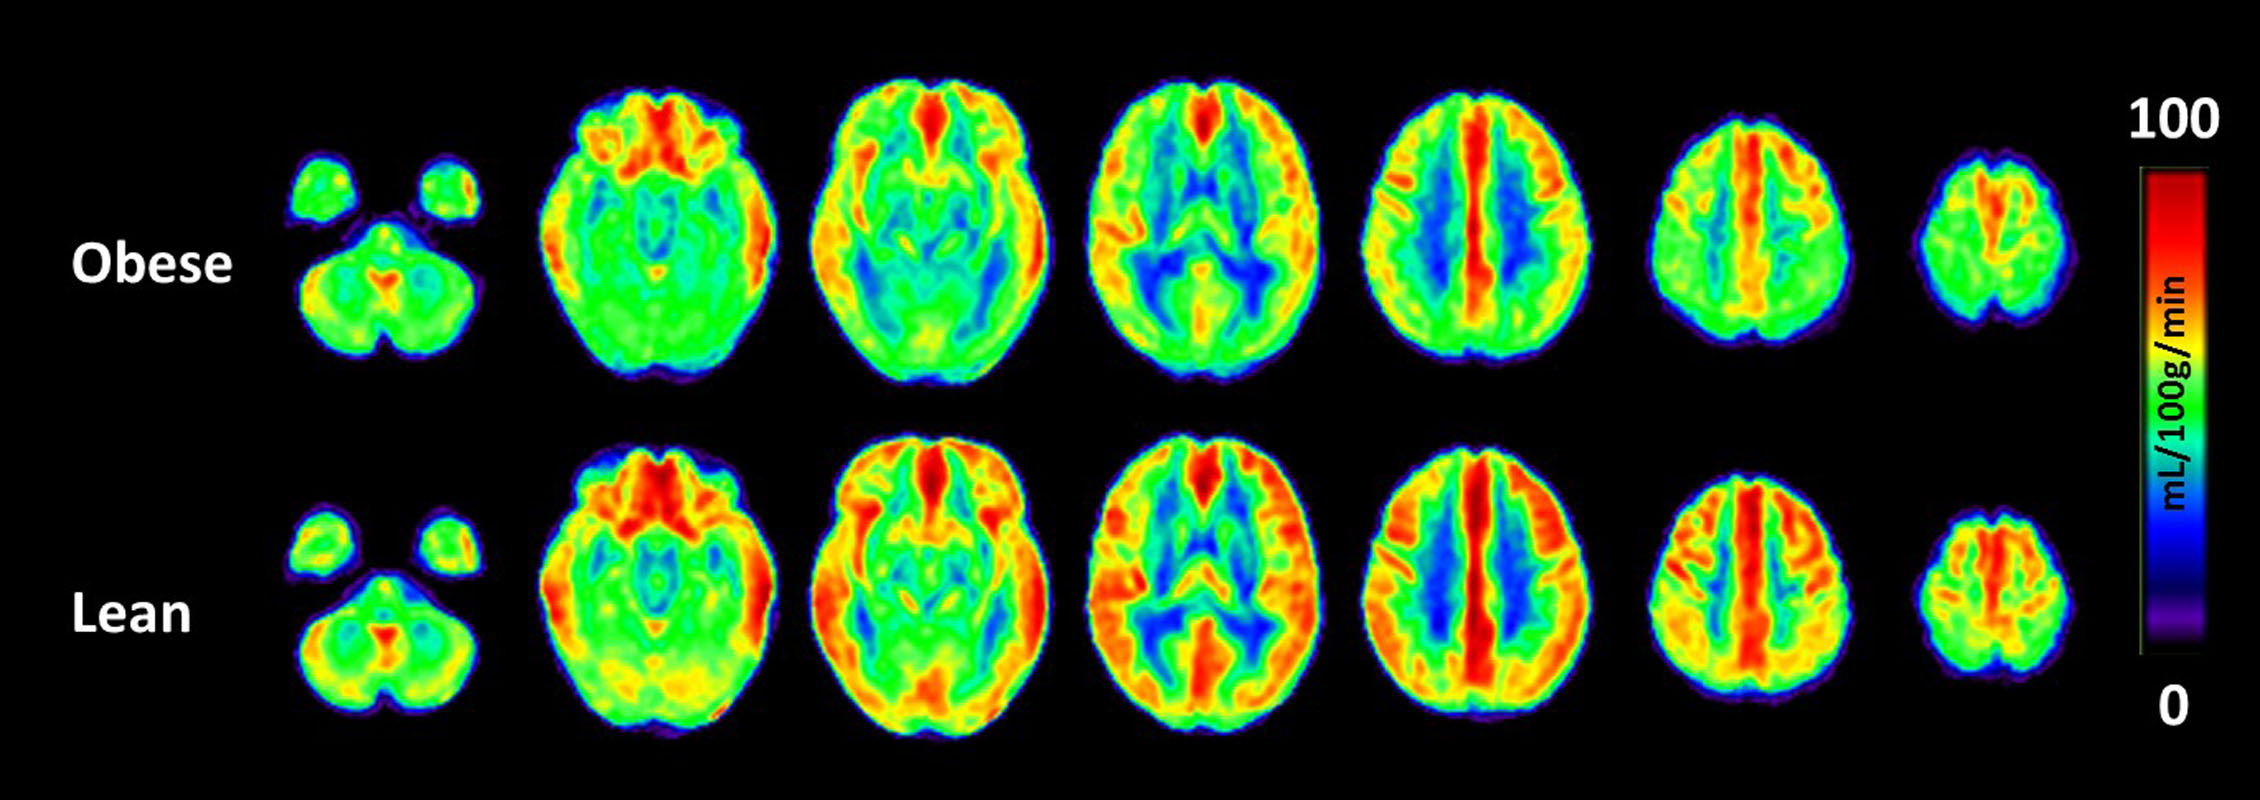
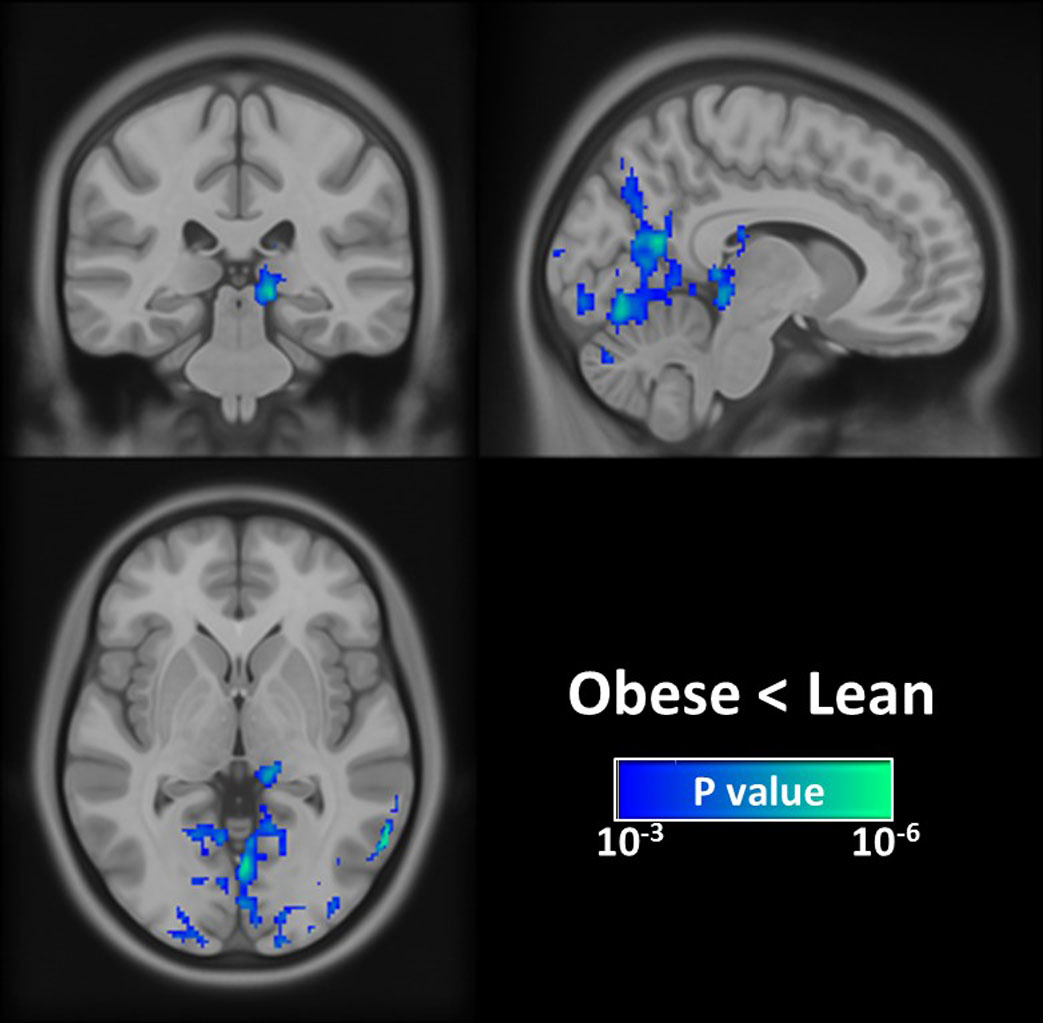
Global CBF differences between groups: Quantitative mean CBF maps stratified by each group are displayed in Fig. 1. The group-related differences in CBF were homogeneous across brain regions, and the quantitative analysis revealed that the obese group had a significantly lower global CBFGM than the lean control group (P < 0.05). Voxelwise analyses: Compared with lean subjects, obese individuals had the significantly lower CBF in the left pulvinar of the thalamus and visual-associated areas, including Brodmann areas (BA)7, BA18, and BA19 (Fig. 2). The pulvinar has been implicated in eating behaviors and obesity,4 and the impaired pulvinar function has been linked to the obesity-related diseases such as depression.5 The lower CBF in visual-associated regions was not surprised as the pulvinar is well known to be strongly associated with the visual cortex.6 The deficit CBF in visual-associated areas found in this study may partly explain the reduced functional connectivity of the extrastriate cortex during visual processing of both food and non-food rewards in obesity.7Conclusion
This exploratory study investigated the effect of obesity on CBF using the noninvasive ASL technique. Results demonstrated that obese subjects exhibit global CBF loss and regional alterations in CBF, especially in regions of the pulvinar of the thalamus and its synchronously related areas such as visual-associated areas. These findings suggest that ASL can provide a useful tool to further investigate obesity-related diseases.Acknowledgements
No acknowledgement found.References
1. Pannacciulli N, Del Parigi A, Chen K, Le DS, Reiman EM, Tataranni PA. Brain abnormalities in human obesity: a voxel-based morphometric study. NeuroImage 2006; 31(4): 1419-25.
2. Medic N, Ziauddeen H, Ersche KD, Farooqi IS, Bullmore ET, Nathan PJ et al. Increased body mass index is associated with specific regional alterations in brain structure. International journal of obesity 2016; 40(7): 1177-82.
3. Thomas BP, Yezhuvath US, Tseng BY, Liu P, Levine BD, Zhang R et al. Life-long aerobic exercise preserved baseline cerebral blood flow but reduced vascular reactivity to CO2. Journal of magnetic resonance imaging : JMRI 2013; 38(5): 1177-83.
4. Li CS, Potenza MN, Lee DE, Planeta B, Gallezot JD, Labaree D et al. Decreased norepinephrine transporter availability in obesity: Positron Emission Tomography imaging with (S,S)-[(11)C]O-methylreboxetine. NeuroImage 2014; 86: 306-10.
5. Luppino FS, de Wit LM, Bouvy PF, Stijnen T, Cuijpers P, Penninx BW et al. Overweight, obesity, and depression: a systematic review and meta-analysis of longitudinal studies. Archives of general psychiatry 2010; 67(3): 220-9.
6. Benarroch EE. Pulvinar: associative role in cortical function and clinical correlations. Neurology 2015; 84(7): 738-47.
7. Garcia-Garcia I, Jurado MA, Garolera M, Segura B, Marques-Iturria I, Pueyo R et al. Functional connectivity in obesity during reward processing. NeuroImage 2013; 66: 232-9.
Figures