3832
Characterization of regional differences in cerebral vascular response to breath holding using BOLD fMRI1Institute of Brain Science, National Yang-Ming University, Taipei, Taiwan, 2School of Medicine, China Medical University, Taichung, Taiwan, 3Department of Biomedical Imaging and Radiological Science, China Medical University, Taichung, Taiwan, 4Department of Radiology, China Medical University Hospital, Taichung, Taiwan
Synopsis
Previous studies have demonstrated that cerebrovascular reactivity (CVR) depends on the baseline vascular dilation status between groups. Within the brain, there also exist spatial variations in resting cerebral blood flow (CBF) and CVR across different cerebral regions; however, the relationship between regional CBF and CVR remains unclear. We found the frontal lobe had the maximal resting CBF but the minimal vascular response to hypercapnia, whereas the occipital lobe had the lowest rest CBF but the maximal reactivity to hypercapnia, suggesting that there is a small and a large autoregulatory efficiency at high and low resting CBF in the brain, respectively.
Introduction
Cerebrovascular reactivity (CVR) has been considered as a specific indicator of autoregulatory efficiency. Previous research reported that CVR can be altered during a predilated baseline and CVR comparisons between groups depended on the baseline vascular dilation status.1, 2 Within the brain, there is also a regional heterogeneity in CVR even in healthy volunteers.3 However, there is limited information on whether the baseline vascular dilation status affects the regional CVR quantification within the brain. Therefore, the primary goal of this study was to investigate the relationship between resting cerebral blood flow (CBF) and CVR across different cerebral regions. This study was also aimed to extend previous CVR studies to verify the possible existence of sexual hemodynamic differences using the breath-holding (BH) task.Methods
Study design: Eleven males (23.82 ± 3.49 years) and 14 females (22.71 ± 1.98 years) volunteers were recruited in this study. Informed consent was obtained using IRB-approved protocol. MRI measurement: MRI was performed at 3T GE scanner. The MRI protocol consisted of a T1-weighted fast spoiled gradient echo (FSPGR), a pseudo-continuous arterial spin labeling (pCASL), and the blood oxygenation level-dependent (BOLD) sequences. The scan parameters of the FSPGR sequence were as follows: TR/TE/FA=8.02 ms/2.99ms/12°, TI = 450ms, and spatial resolution = 1 × 1 × 1 mm3. Scan parameters of the pCASL sequence were as follows: TR/TE/FA=4600 ms/9.8ms/12°, post labeling delay = 1.8 s, and labeling duration = 1.5 s. For the BH task, subjects were asked to breath normally for 40 s followed by 20 s BH, repeated four times with additional 40 s self-paced breathing at the end. BOLD images were acquired during this period with the following parameters: TR/TE/FA =2000 ms/30 ms/ 90°, and spatial resolution = 3.75 × 3.75 × 4.4 mm3. Data analysis: A perfusion kinetic model was used to quantify the perfusion-weighted maps of the pCASL sequence as CBF maps.4 CVR maps were obtained by general linear regression using the BOLD signal as the dependent variable and the hemodynamic response function from SPM as the independent variable. All CBF and CVR maps were co-registered to the subject’s structural images and the MNI space. The regions of interest of four major lobes, including frontal, temporal, parietal, and occipital, were parcellated by MRIcloud. The masks of the four major lobes were applied to the CBF and CVR maps to acquire the regional CBF and CVR, respectively.Results
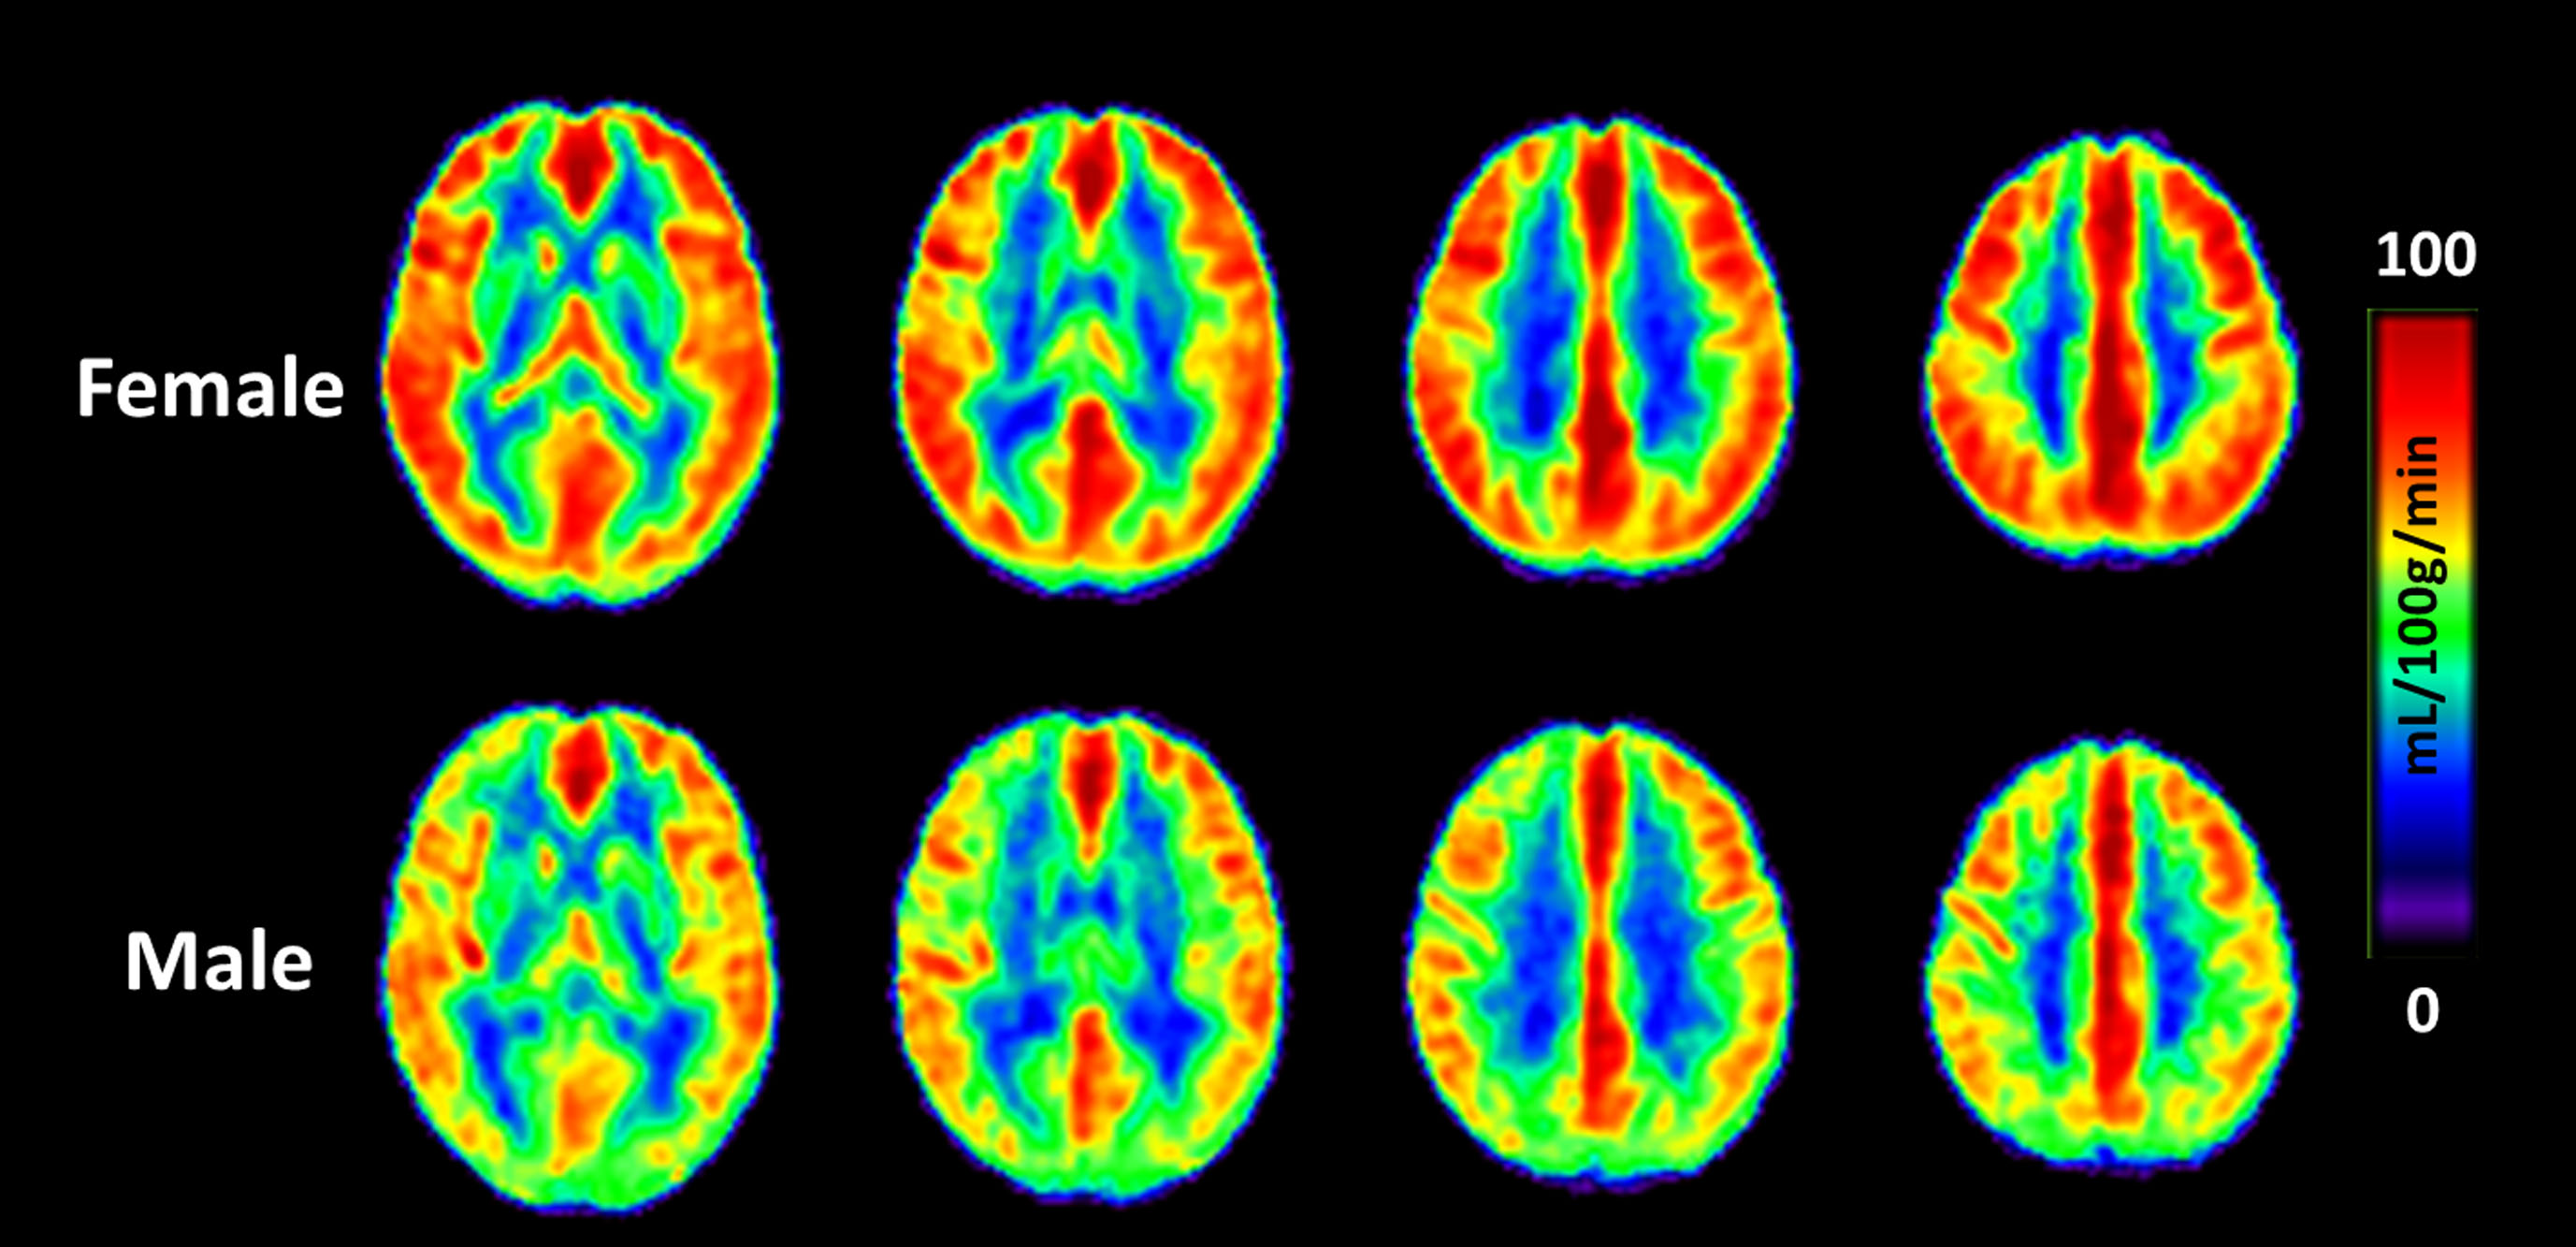
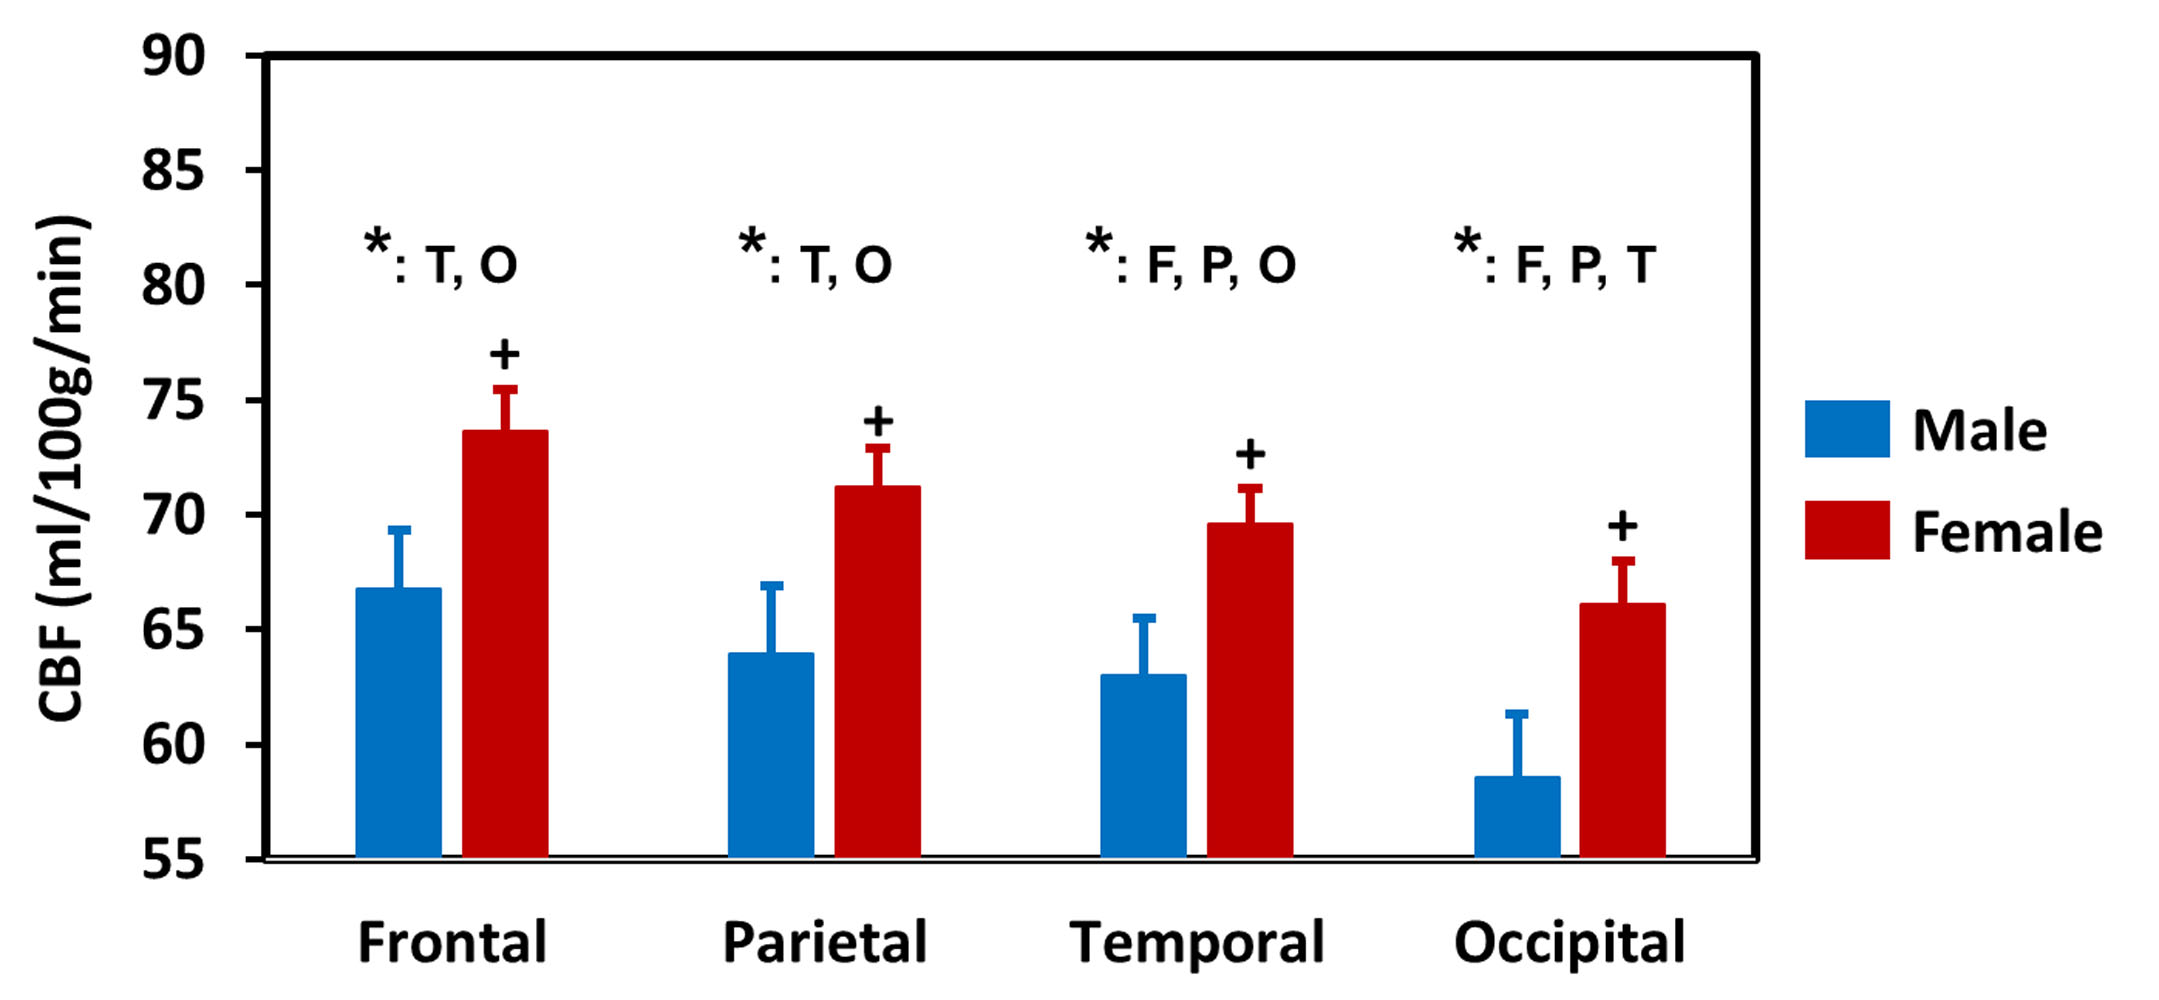
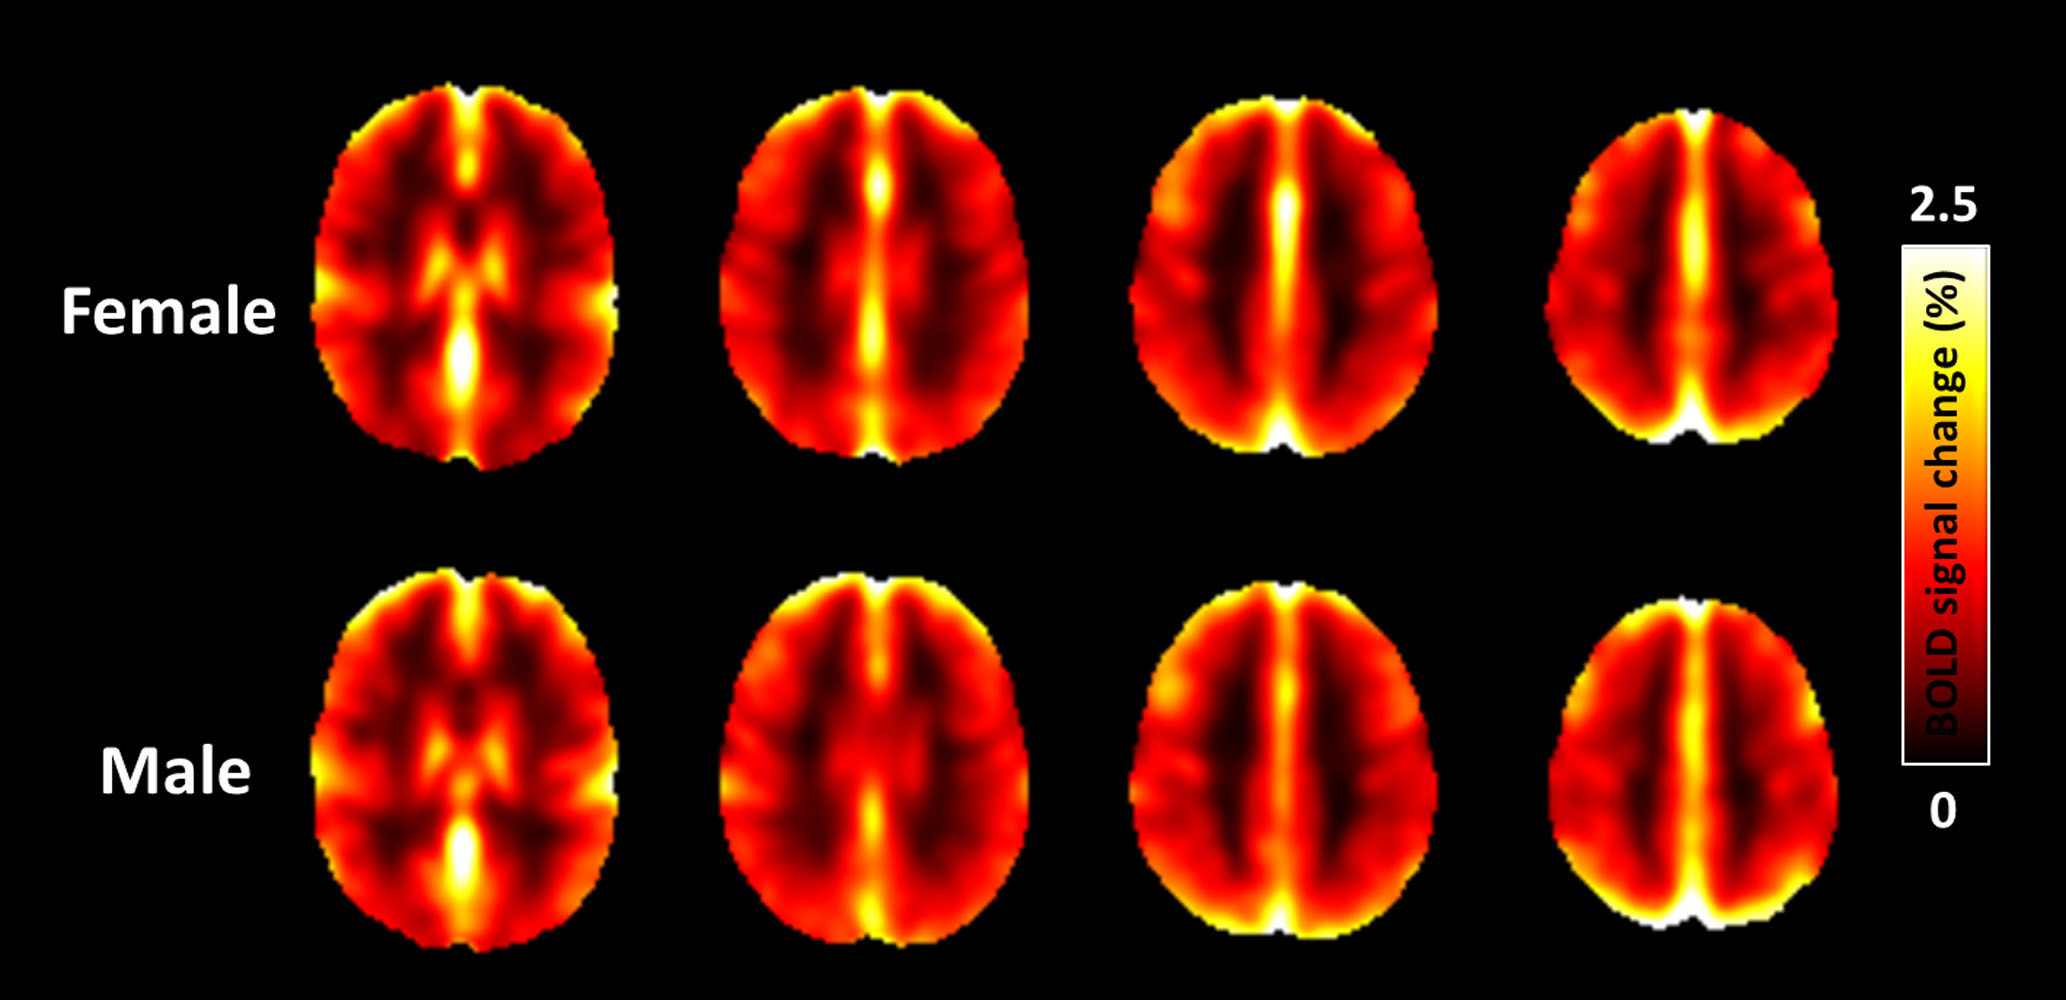
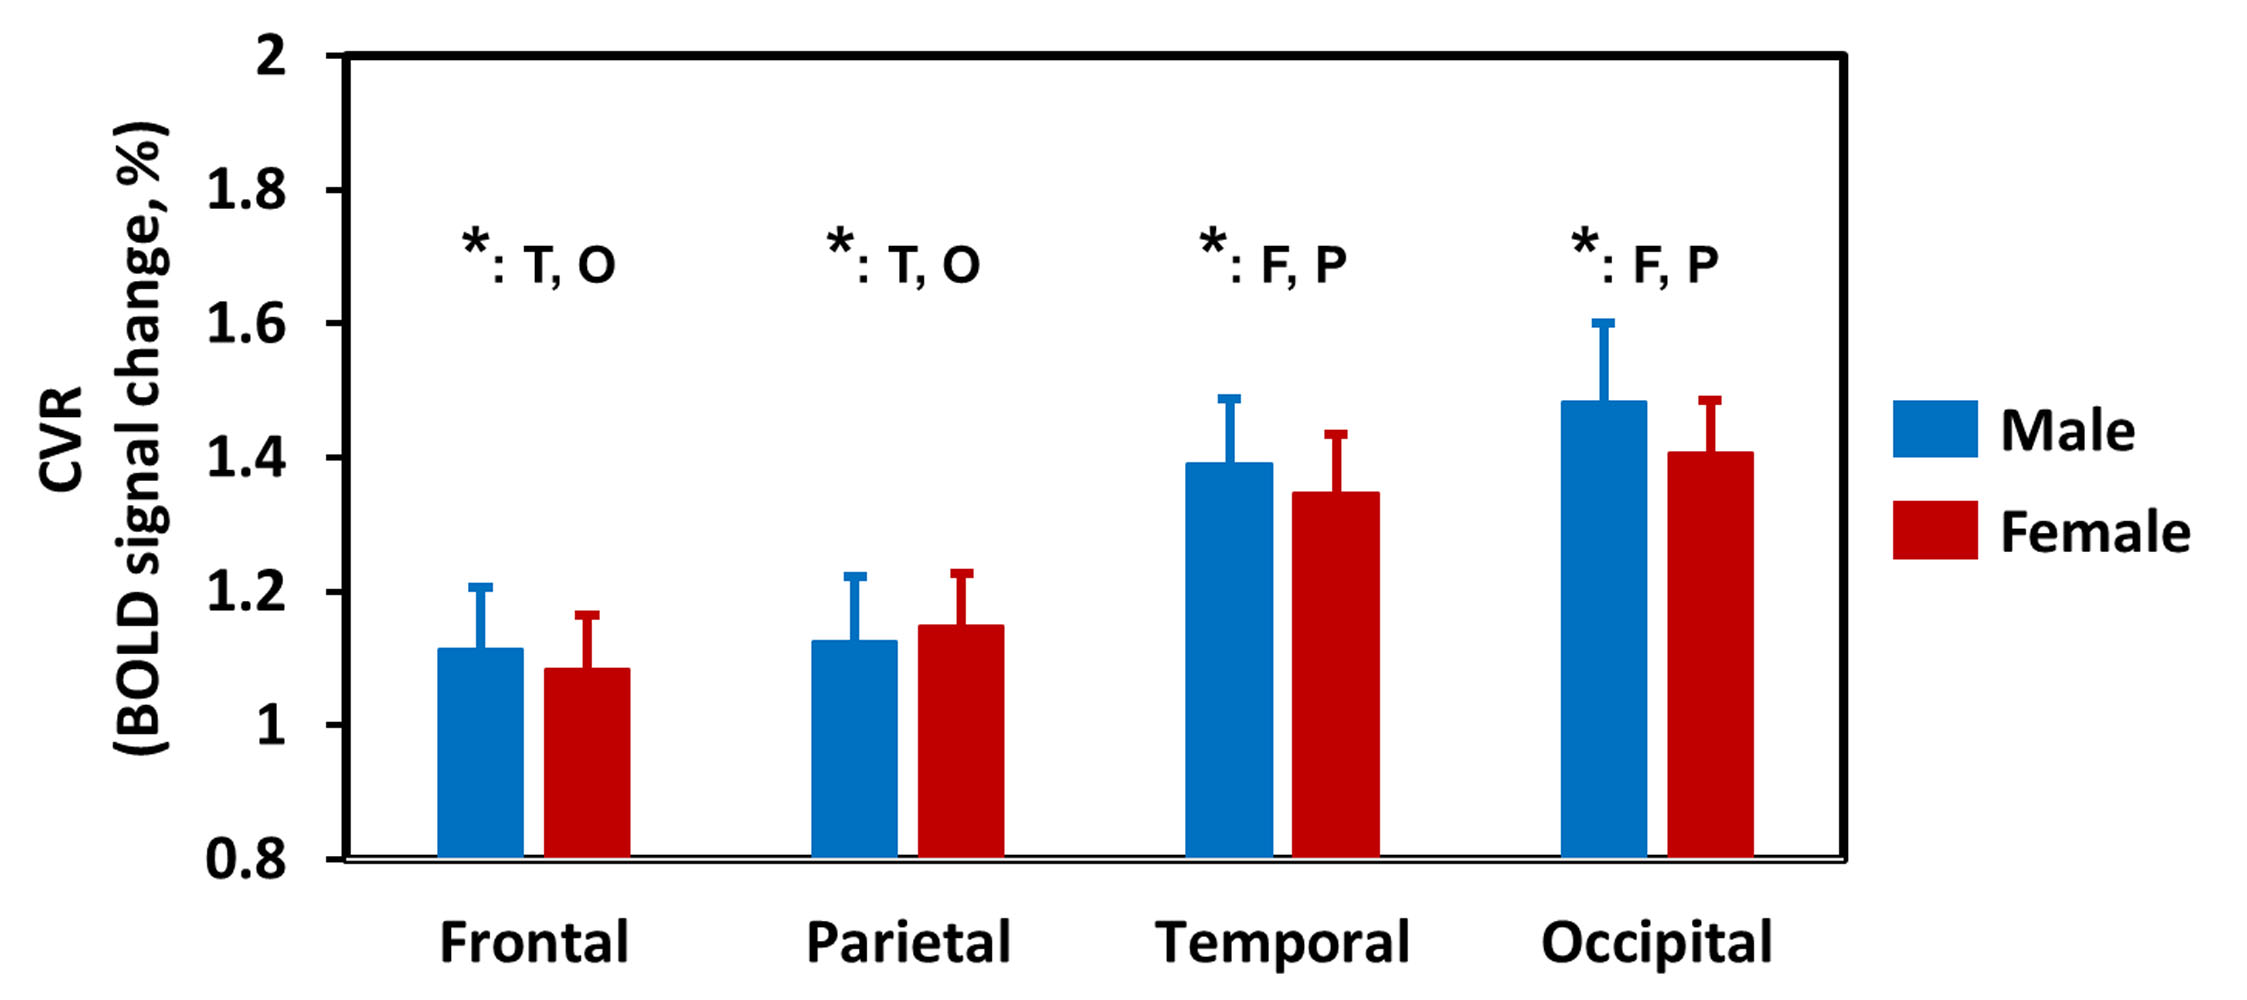
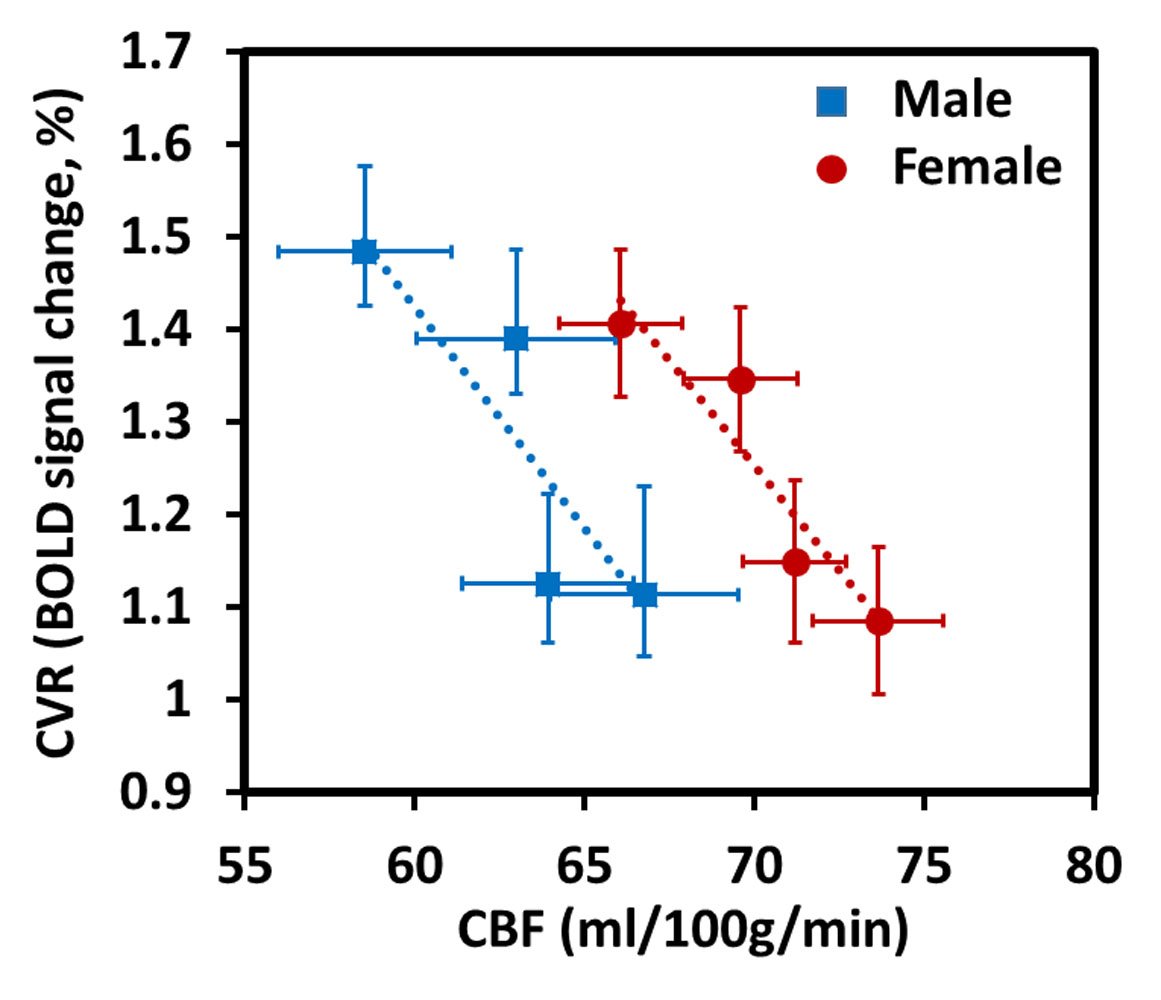
Regional dependence in CBF: Quantitative mean CBF maps and the mean CBF across cerebral regions between sex groups are displayed in Fig. 1 and Fig. 2, respectively. Sex-related differences in CBF is homogeneous across cerebral regions, as manifested by the higher CBF in females as manifested by the higher CBF in females in all lobes (all P < 0.05). One-way ANOVA with repeated measurements demonstrated regional dependence of the CBF (P < 0.05), with the frontal lobe showing the highest CBF and the occipital lobe the lowest value. Regional dependence in CVR: The averaged CVR maps and averaged CVR across cerebral regions between sex groups are displayed in Fig. 3 and Fig. 4, respectively. Sex-related differences were not observed in CVR. One-way ANOVA with repeated measurements also revealed the regional heterogeneity of CVR (P < 0.05), but exhibited the opposite orders compared with the regional CBF values. A greater and a smaller CVR were observed in the occipital and frontal lobes in both sex groups, respectively. Relationship between CBF and CVR: Figure 5 depicts the relationship between mean CBF and mean CVR in all subjects across different cerebral regions. There is a significant reciprocal relationship between resting CBF and CVR across cerebral regions for both sexes (both P < 0.05). These findings indicate that there exists a large and a small vasodilation ability at low and high resting CBF within the brain, respectively.Discussion and conclusion
This work showed that although both resting CBF and CVR are heterogeneous across the brain, they do not appear to be in the same pattern, with a negative correlation between resting CBF and CVR. As the resting CBF is higher and could be predilated in the frontal lobe, we could expect a compromised vasodilation ability in this region. Therefore, these regional differences in CVR may partially explain that stroke5 and Alzheimer’s disease6 frequently affect the frontal lobe, but not the occipital lobe. Although females had a significantly higher resting CBF than males, the sex-related effect on CVR was nonspecific. We speculate that estrogen in females may have the beneficial effect of preserving the cerebrovascular dilatory capacity. These findings may be of great potential clinical interest in the assessment of cerebrovascular reserve and regional-dependent vascular diseases.Acknowledgements
No acknowledgement found.References
1.Zhao P, Alsop DC, Abduljalil A, Selim M, Lipsitz L, Novak P et al. Vasoreactivity and peri-infarct hyperintensities in stroke. Neurology 2009; 72(: 643-9.
2. Bright MG, Donahue MJ, Duyn JH, Jezzard P, Bulte DP. The effect of basal vasodilation on hypercapnic and hypocapnic reactivity measured using magnetic resonance imaging. Journal of cerebral blood flow and metabolism 2011; 31: 426-38.
3. Yezhuvath US, Lewis-Amezcua K, Varghese R, Xiao G, Lu H. On the assessment of cerebrovascular reactivity using hypercapnia BOLD MRI. NMR in biomedicine 2009; 22: 779-86.
4. Thomas BP, Yezhuvath US, Tseng BY, Liu P, Levine BD, Zhang R et al. Life-long aerobic exercise preserved baseline cerebral blood flow but reduced vascular reactivity to CO2. Journal of magnetic resonance imaging 2013; 38: 1177-83.
5. Tao WD, Liu M, Fisher M, Wang DR, Li J, Furie KL et al. Posterior versus anterior circulation infarction: how different are the neurological deficits? Stroke 2012; 43: 2060-5.
6. Yezhuvath US, Uh J, Cheng Y, Martin-Cook K, Weiner M, Diaz-Arrastia R et al. Forebrain-dominant deficit in cerebrovascular reactivity in Alzheimer's disease. Neurobiology of aging 2012; 33: 75-82.
Figures