3831
Vascular and neurovascular effects on micro- and macro-vascular compartments in human visual cortex.
Wouter Schellekens1, Alex Bhogal1, Jeroen Siero1, and Natalia Petridou1
1Radiology, UMC Utrecht, Utrecht, Netherlands
1Radiology, UMC Utrecht, Utrecht, Netherlands
Synopsis
In the current study, we investigate the contribution of non-neuronal and neuronal-related hemodynamic changes to the BOLD signal for micro- and macro-vascular compartments. Vascular reactivity was assessed using CO2 and O2 gas administration, as well as brief visual stimuli, while we used gradient-echo and spin-echo across different cortical depths to specifically target different vascular compartments. We found that gradient-echo responded clearly to the gas challenges, also affecting the neurovascular hemodynamic response function. These effects were not seen for spin-echo, suggesting that the spatiotemporal characteristics of micro-vessels may not solely be affected by vascular properties.
Introduction
The Blood-Oxygen Level Dependent (BOLD) signal is widely used to investigate human brain functioning in healthy and diseased humans. However, the BOLD signal consists of a mix of hemodynamic changes, some of which relate to neuronal activity via micro-vessels, and some of which relate to blood draining effects in macro-vessels (intra-cortical and pial draining veins). Thus, the neurophysiological nature of the signals is unclear due to unknown variability in vascular organization and the spatiotemporal characteristics of the hemodynamic response within the volume imaged. In the current study, we investigate the contribution of non-neuronal and neuronal-related hemodynamic changes to the BOLD signal for micro- and macro-vascular compartments. Non-neuronal hemodynamic changes were induced with CO2 and O2 gas administration, while we recorded BOLD signals using gradient-echo (GE) and spin-echo (SE) EPI at 7T. SE-EPI samples BOLD signal effects originating mainly from micro-vessels (e.g. capillary bed), while GE-EPI is sensitive to both micro- and macro-vessels (intra-cortical and pial draining veins). Additionally, neural activity was induced using a visual stimulus to directly assess how differences in vessel reactivity modulate the hemodynamic response function.Methods
Seven healthy volunteers (female=6, mean age=20.4 years) participated in a 7 Tesla fMRI session, while performing CO2 and O2 breathing challenges (Respiracttm), and brief visual stimuli were presented on a screen in the scanner bore. BOLD signals were recorded using a gradient-echo (GE, resolution=1x1x1mm, TR/TE=850/27ms, FA=50°, FOV=128x128x7mm), and spin-echo (SE, resolution=1.5x1.5x1.5 mm, TR/TE=850/50ms, FA=90°, FOV=190x190x7.5mm) EPI sequences, for the same gas and visual conditions. The gas conditions consisted of a 3-minute increase in end-tidal pressure CO2 (+3, +5, +8, and +10 mm/hg) and O2 (+500 mm/hg), plus a baseline of normal air. The visual stimuli were brief (0.5s) flashes of black/white random orientation patterns on a grey background, which were presented during all gas conditions. On the basis of a T1-weighted anatomy scan, cortical layers (deep, middle and top) were estimated using LayerfMRI (github.com/layerfMRI). The percentage of BOLD signal change following the gas conditions was estimated per voxel and averaged over layers. Hemodynamic Response Functions (HRF) following the visual stimuli were estimated per gas condition using a Finite Impulse Response (FIR) function and also averaged across cortical layers.Results
We found robust BOLD signal change for the increases in end-tidal pCO2 and end-tidal pO2 gas conditions during the GE-EPI run (F(4,24)=14.546, p<.001), but not for the SE-EPI run (F(4,24)=0.286, p=.884) (figure 1). Additionally the GE-EPI scans showed the largest signal change in the upper cortical layers (F(4,24)=18.615, p<.001), whereas the SE-EPI scans did not reveal any differences in BOLD signal change across layers (F(4,24)=0.253, p=.781). For the estimated GE-EPI HRFs, we observed small differences in the response shape during different gas conditions (figure 2). The HRF amplitude exhibited a small decrease with increasing end-tidal pCO2 conditions as anticipated (figure 2), however, this effect did not reach significance. A significant amplitude increase was found from deep to upper cortical layers (F(2,8)=10.224, p=.006). The estimated SE-EPI HRFs did not show a change in BOLD signal amplitude across gas conditions (F(4,16)=0.678, p=.617), or cortical layers (F(2,8)=2.449, p=.148). However, the estimated amplitude of SE-EPI HRF during the end-tidal pO2 gas condition was significantly different from baseline (F(1,6)=9.73, p=.023), which was not seen for the GE-EPI pO2 gas increase condition (F(1,6)=0.722, p=.428).Discussion
We investigated effects of different gas challenges on the estimated BOLD signal change for different vascular compartments during the acquisition of GE-EPI and SE-EPI scans. We found that different levels of end-tidal pCO2 during the SE-EPI scan did not have a significant effect on the percentage of BOLD signal change and also did not differ across cortical layers. However, an increase in end-tidal pCO2 administration was observed to cause significant signal increases during the GE-EPI scan, resulting in largest signal changes toward the upper cortical layers. These results suggest that the smaller veins of the capillary bed may be less likely to dilate as a result of increases in end-tidal pCO2 (measured with SE-EPI), as opposed to the larger intra-cortical and pial vasculature (measured with GE-EPI). Finally, the estimated HRFs following visual stimuli changed per different gas condition, but only the HRFs caused by SE-EPI pO2 administration were significantly different from baseline. These results indicate that BOLD signal changes around the capillary bed are not solely dominated by vessel dilation and that increases in oxyhemoglobin are sufficient to cause the observed signal changes.Conclusion
Using GE-EPI and SE-EPI sequences, different CO2 and O2 gas administration levels, and a visually induced neuronal stimulus, we report differences in the contribution of large vessels versus the capillary bed to the fMRI BOLD signal. The spatiotemporal characteristics of micro-vessels may not likely be affected by solely vascular properties.Acknowledgements
This work was supported by a grant from the National Institute of Health under Award Number RO1MH111417References
No reference found.Figures
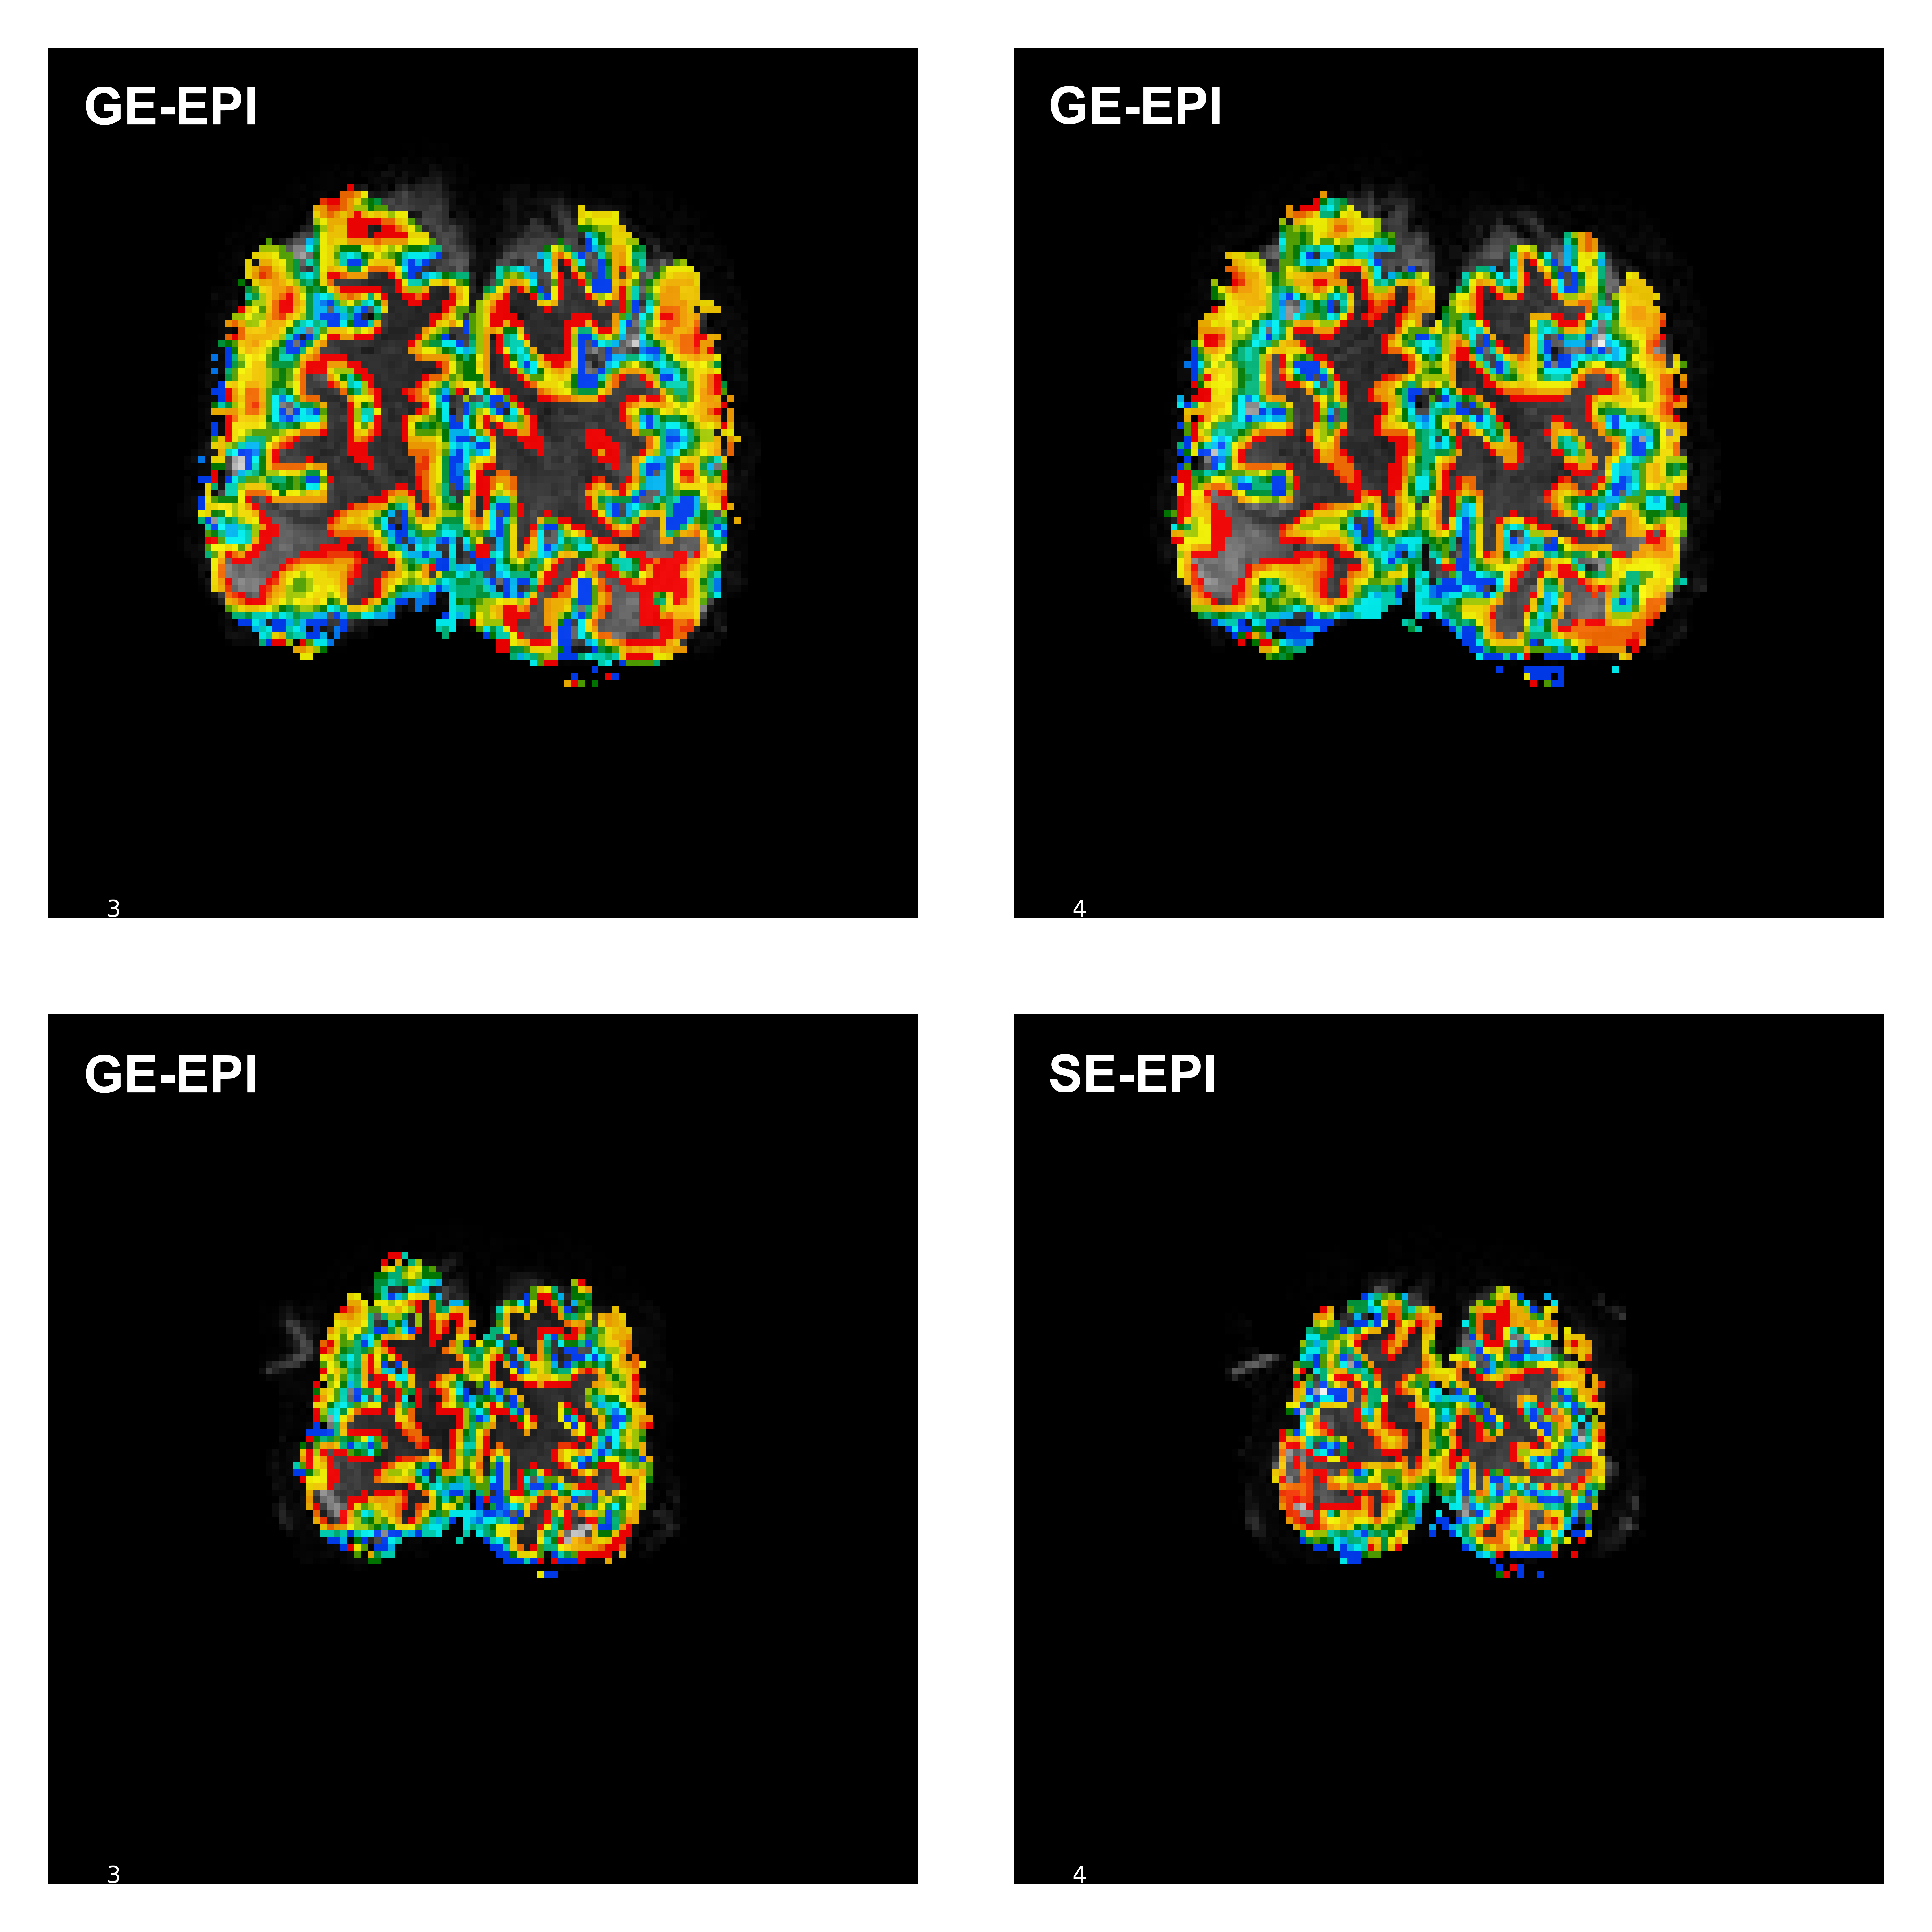
Example cortical depth map for GE-EPI (top panels) and SE-EPI (bottom panels).
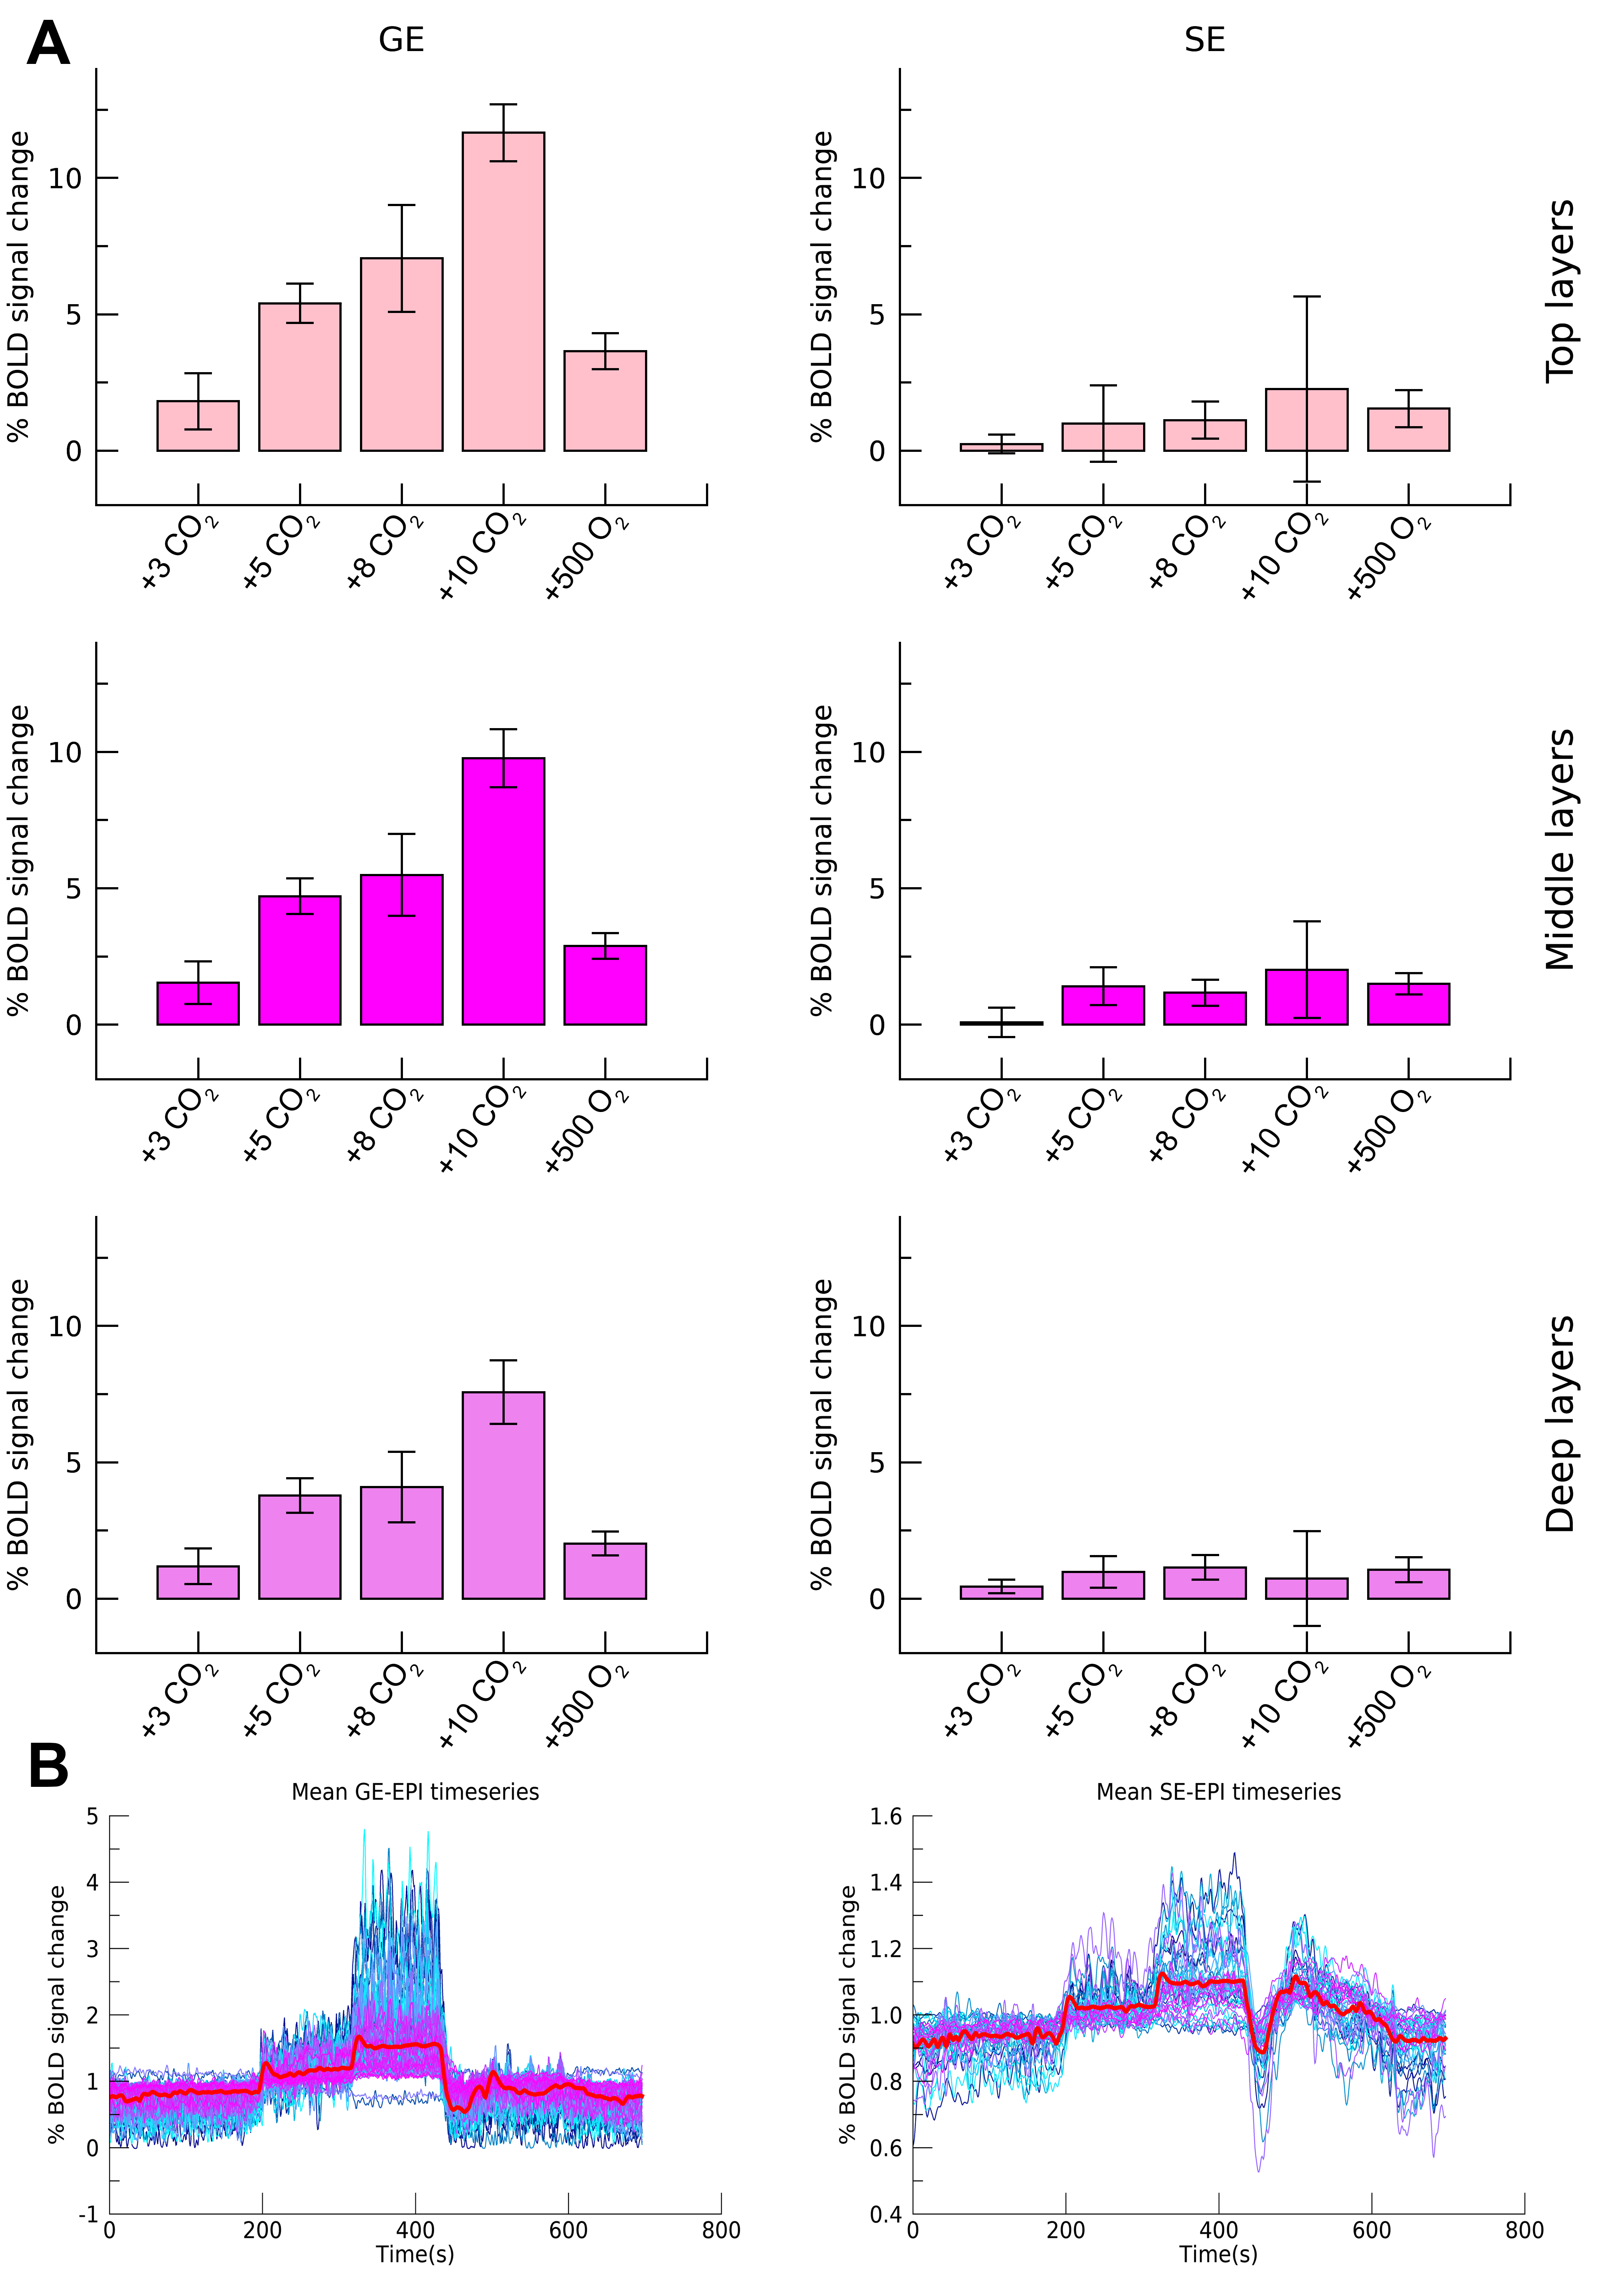
Mean
percentage BOLD signal change following gas conditions for GE-EPI (left) and
SE-EPI (right). Estimated amplitude is presented for 3 different cortical
depths (A). Full example timeseries are presented at the bottom (B).

Estimated
HRF (A) for GE-EPI (left) and SE-EPI (right) during different gas conditions. Estimated amplitude plotted over cortical depth (B).