3830
A novel statistical 3D cortical vascular network to simulate realistic hemodynamic changes in the human brain1Department of Radiology, Center for Image Sciences, University Medical Center Utrecht, Utrecht, Netherlands, 2Spinoza Centre for Neuroimaging Amsterdam, Royal Netherlands Academy of Arts and Sciences, Amsterdam, Netherlands
Synopsis
We present a statistical 3D computational model that mimics the human cortical vascular network. This approach allows to study the hemodynamic changes and to simulate biophysical effects across the vascular network, as well as to investigate the dynamic BOLD fMRI signal formation. In order to extract quantitative parameters of the BOLD fMRI signal in humans, it is necessary to adopt a computational model that resembles the human cortical vasculature and mimics realistic hemodynamic fluctuations triggered by neurovascular coupling. Simulating the biophysical effects of tissue related to hemodynamic changes will provide accurate information on the origins of the BOLD signal time-course.
INTRODUCTION
Blood oxygenation level-dependent functional magnetic resonance imaging (BOLD fMRI) is a powerful noninvasive tool, which employs susceptibility-sensitive imaging techniques to study in-vivo brain function. However, the BOLD fMRI signal is only an indirect measurement that results from the hemodynamic fluctuations triggered by neurovascular coupling and the biophysical properties of the tissues1. In order to investigate the BOLD fMRI signal formation, computational modeling can give a comprehensive perspective on the relation between the brain’s vasculature and hemodynamics. Furthermore, computational approaches provide valuable information to understand the biophysical interaction of diffusing water molecules and induced-susceptibility disturbances at mesoscopic level2. So far, numerical simulations of the BOLD fMRI signal in non-realistic vascular representations (spheres or cylinders) have described static signal characteristics dependent on specific parameters of blood and tissue in active/resting states3. Recently, realistic vascular models obtained from the parietal cortex of mice have demonstrated the impact of the vascular orientation on the amplitude of the signal4,5. The geometrical structure of the vascular network between humans and mice is similar to a degree. Topological studies of the human cortical vasculature suggest that several human characteristics are not accounted in those realistic mice models6,7. For instance, a significant difference is the arterial/vein ratio that feed/drain a specific volumetric region. These discrepancies will lead to quantitative errors on the computed BOLD fMRI signal. To obtain a reconstruction of the 3D human vascular network, it is necessary to use high-tech imaging devices that, so far, are still under development7,8. To circumvent the lack of a realistic 3D human vasculature representation, we developed a statistical 3D vascular model that fulfills the geometric and rheological characteristics of the human cortical vasculature9. This computational model allows us to compute hemodynamic changes and simulate biophysical effects of tissues, and enables simulation of the full BOLD fMRI time-course.METHODS
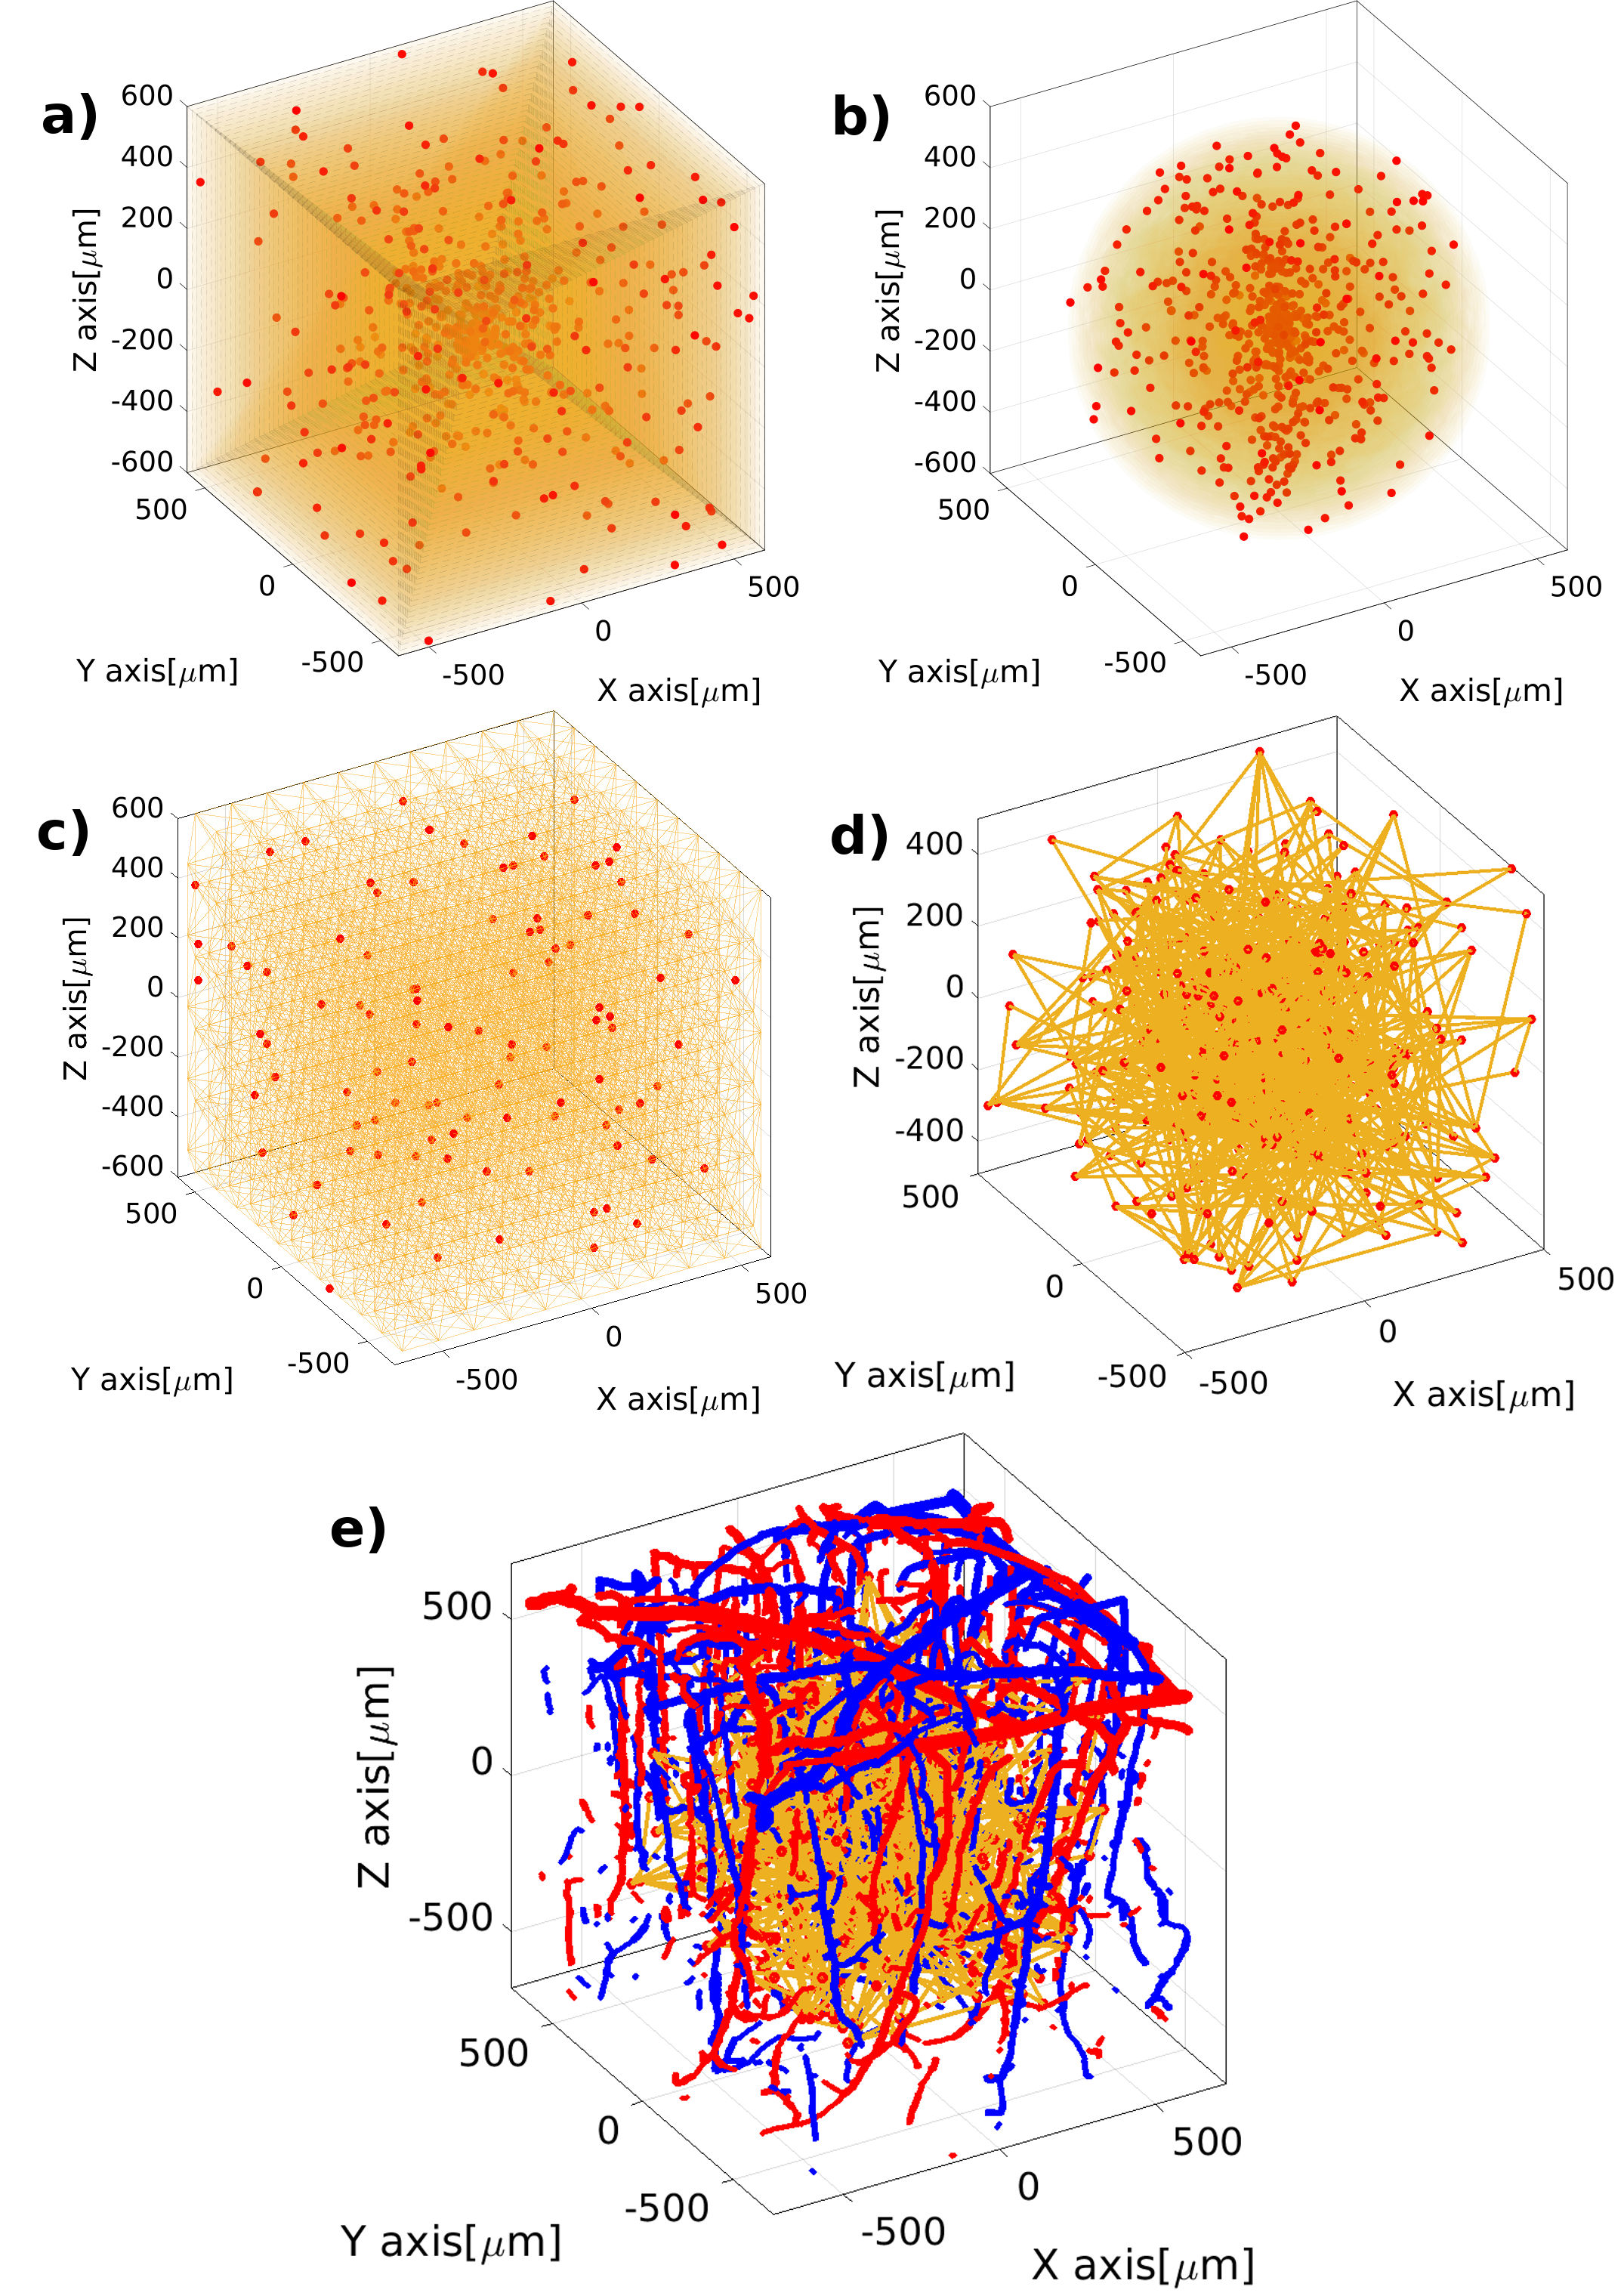
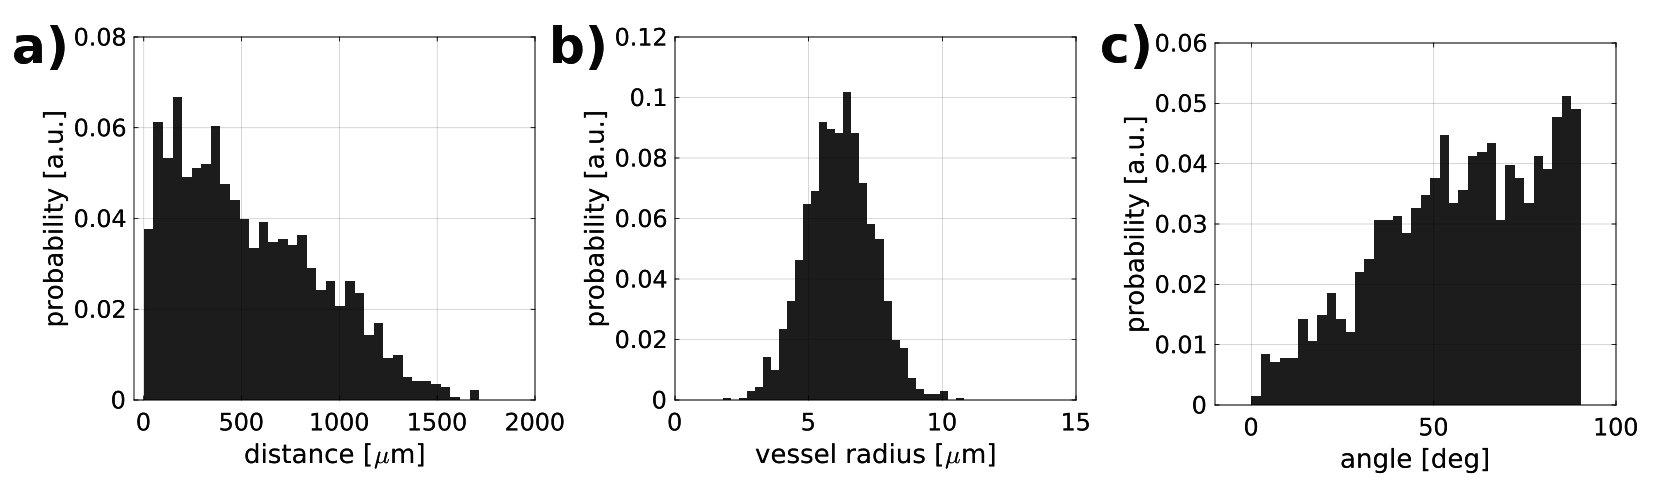
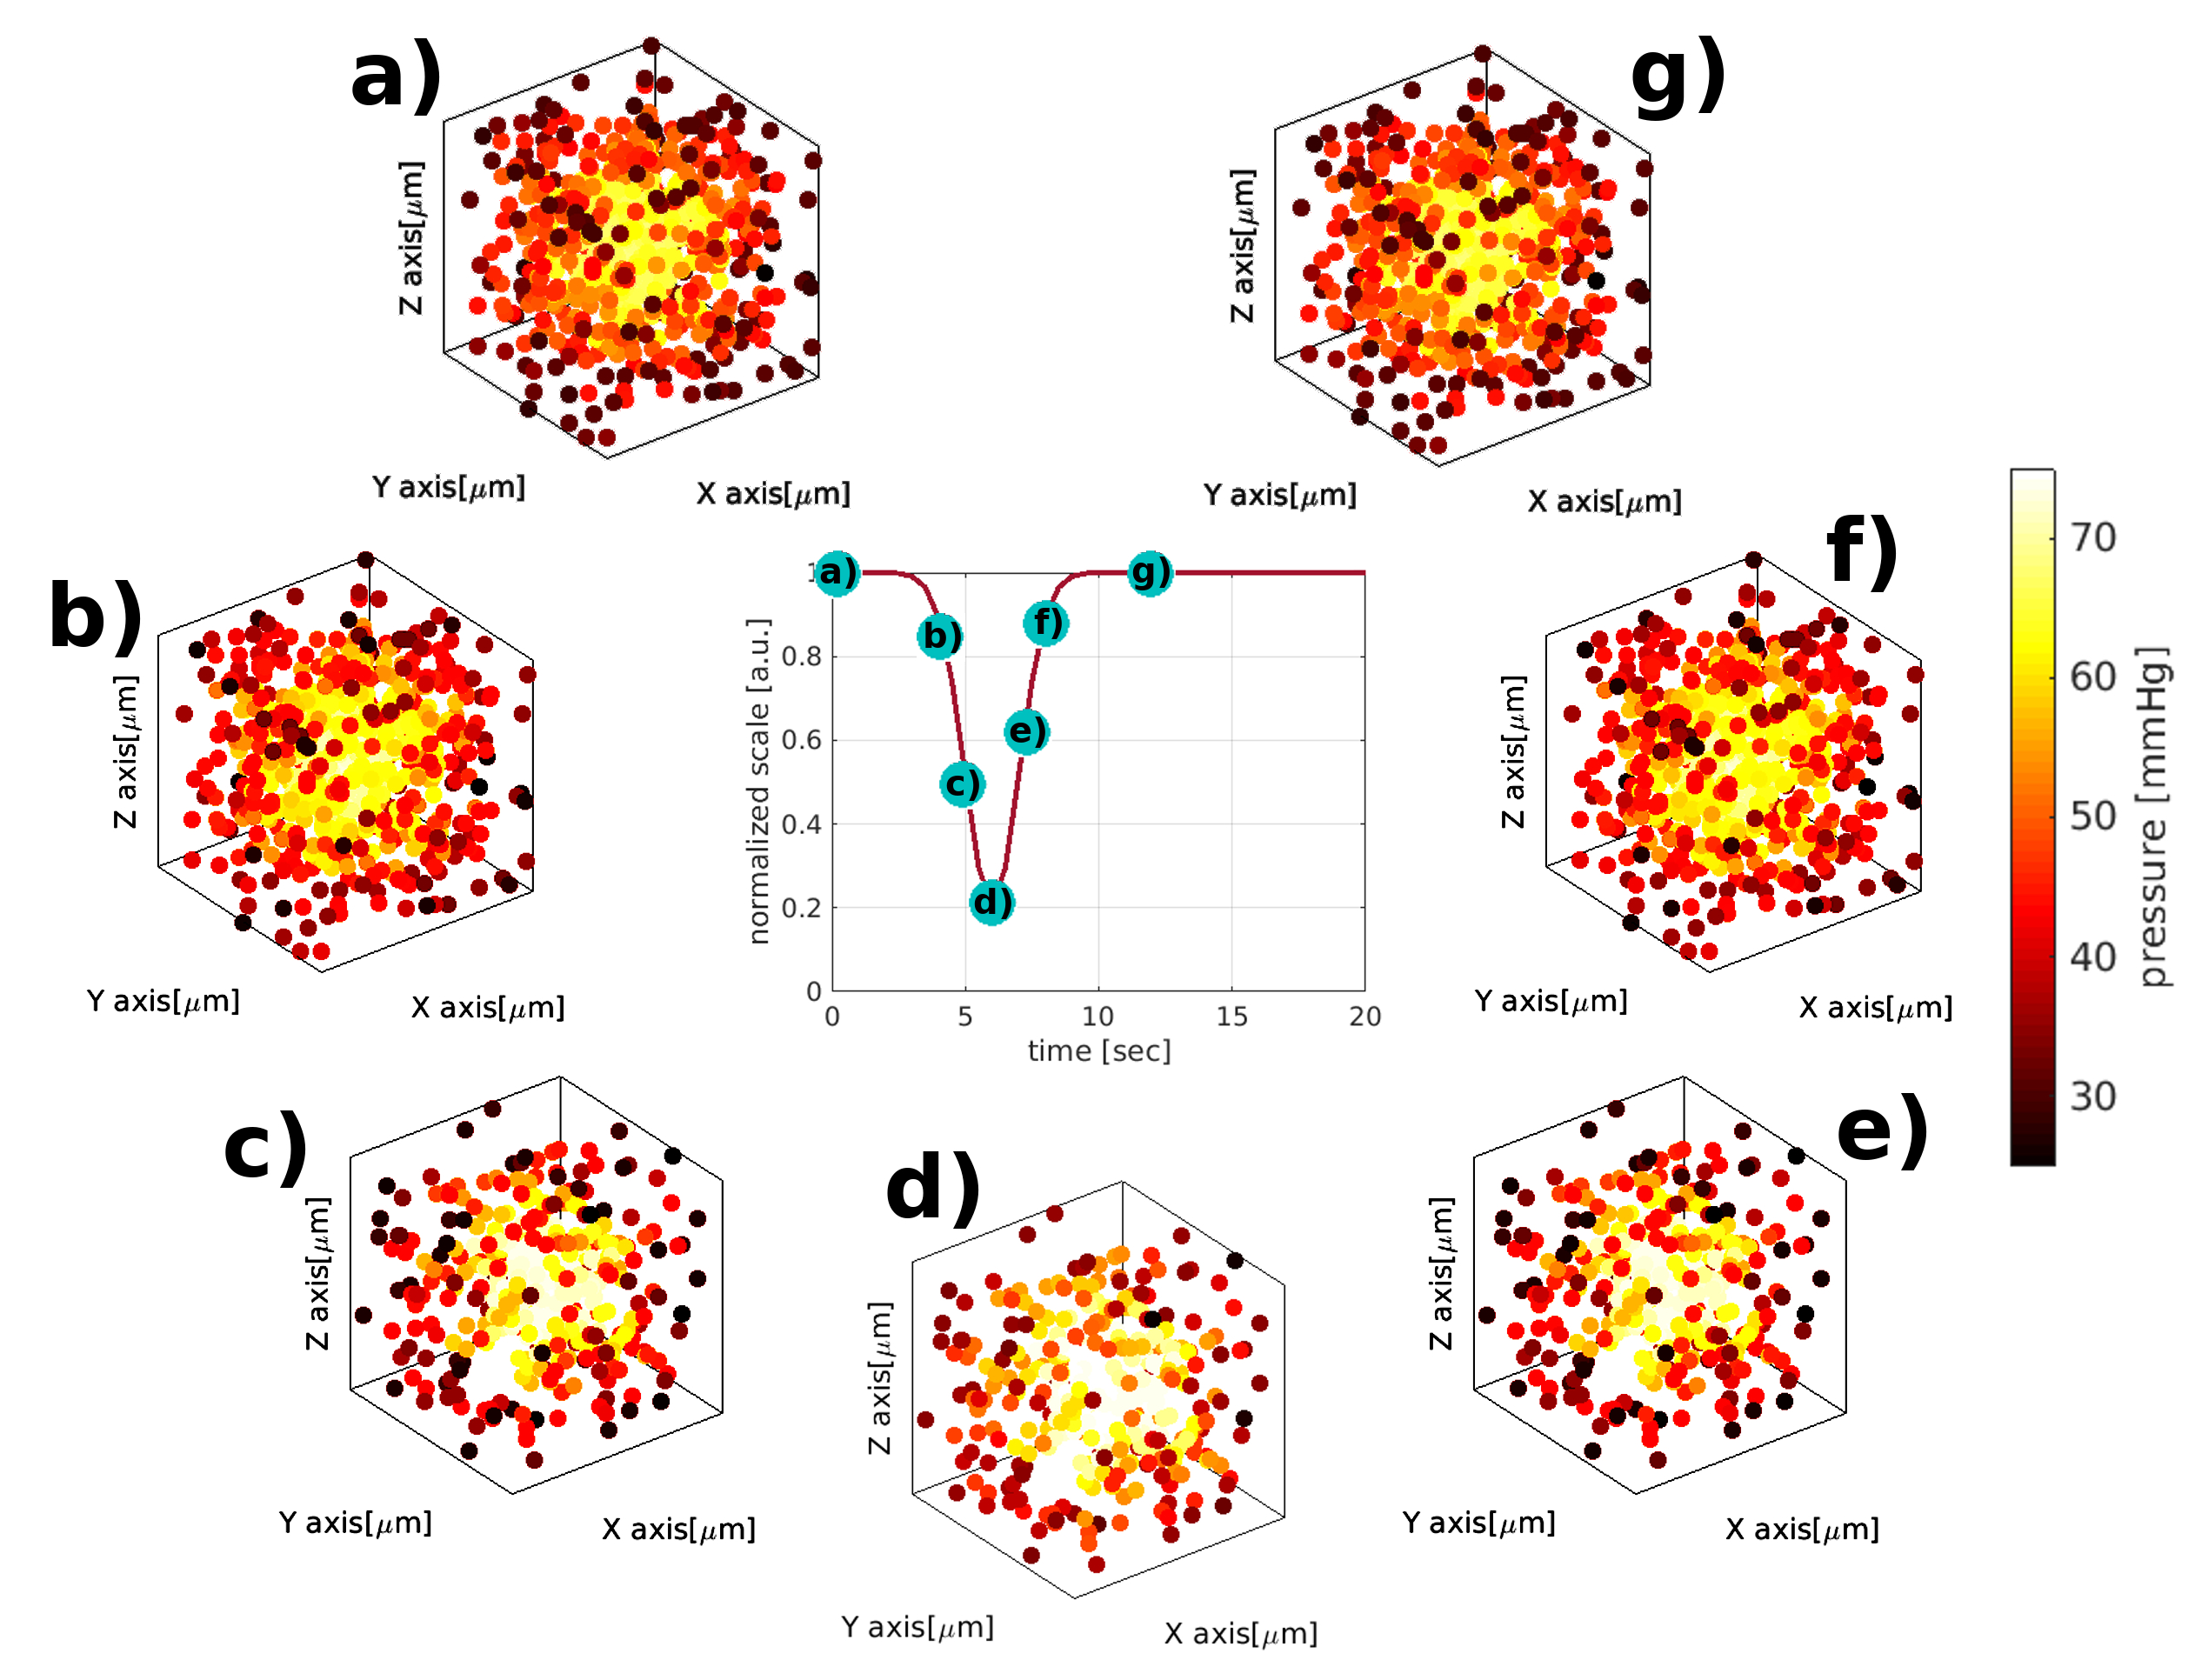
We have developed an algorithm that produces a synthetic 3D vascular model (SVM) of the human cortical vasculature7,8,9. The SVM generates two different vessel subpopulations: micro- and macrovessels. Microvessels are represented as a statistical network that resembles the capillary bed10. Properties accounted in the network generation are vessel’s radius, vessel’s length, number of connections between vessels and orientation with respect to the cortical surface. The microvascular network results from scattering random points inside an isotropic space that mimics the MR imaging voxel (~ 1mm3). Iterative pseudorandom connections between these points are generated, until statistical properties of the SVM resembles the morphological probability distributions of the human microvasculature7. To characterize the statistical properties of the SVM model, an adjacency matrix describes the complete structure of the network. Second, penetrating arteries and diving veins (macrovessels) are superimposed over the synthetic microvascular model, based on the vascular architecture acquired by [11]. The macrovascular compartment is mathematically modified to approach human characteristics12. To compute the evolution of hemodynamics on the network, the adjacency matrix is translated into an electric circuit by fluid dynamic’s analogy13. The vessel resistance is described by Poiseuille's law (R=8ηl/πr4), that depends on the vessel’s radius(r), vessel’s length(l) and blood’s viscosity(η). For simplicity, we consider that only one artery feeds (blood pressure input: 75 mmHg) and one vein drains (blood pressure output: 25 mmHg) the microvasculature. Further, an arterial dilation was simulated, resulting in a hemodynamic change for each vascular segment across the whole SVM network.RESULTS
From Figure 1.a to Figure1.c, we display three possible configurations for creating the microvascular network. The main difference between the configurations lies in the manner of scattering the random points (vessel joints), contingent on convergence into a statistically accurate microvascular representation. It is clearly visible that all three configurations show different spatial arrangements. This property allows us to simulate cortical regions with different vascular geometries. Figure 1.d illustrates the pseudorandom connections between the distributed points, which together constitute the statistical description of the microvascular bed. Using vector calculus and graph theory, it is straightforward to describe the properties of the SVM model, as shown in the probability distributions in Figure 2. The iterative pseudorandom generation of connections always assures convergence to a statistical description of the network that fulfills properties reported in humans7,8,9. Then, the macrovascular compartment is superimposed on the SVM model (Figure 1.e). Figure 3 shows the hemodynamic response of the SVM network, for an arterial dilation i.e. differential change in input resistance, located in the center of the simulated voxel. Dependent on the arterial dilation state, the blood pressure increase in a radial-like pattern.DISCUSSION/CONCLUSION
We have developed a statistical 3D vascular model (SVM) that fulfills the geometric and rheological characteristics of the human cortical microvasculature. The SVM model permits to generate different geometrical distributions of vessel subpopulations that thus allows to simulate several cortical regions. Moreover, the SVM model permits to simulate realistic hemodynamic changes. Simulations were shown for one artery (input) and one vein (output), but the model can be extended to study the evolution of hemodynamics for different number of arteries/veins. Our approach can be applied to simulate several physiological parameters such as variable oxygenation levels, or pathological conditions, and help to understand the dynamic evolution of the BOLD fMRI signal.Acknowledgements
This work was supported by the National Institute Of Mental Health of theNational Institutes of Health under Award Number R01MH111417References
1. Ogawa, S. et al. Functional brain mapping by blood oxygenation level-dependent contrast magnetic resonance imaging. A comparison of signal characteristics with a biophysical model. Biophys. J. 1993; 64:803–812
2. Kiselev V.G., Posse S. Analytical model of susceptibility-induced MR signal dephasing: effect of diffusion in a microvascular network. Magn Reson Med 1999; 41:499-509
3. Weisskoff, R., et al. Microscopic susceptibility variation and transverse relaxation: Theory and experiment. Magn. Reson. Med 1994; 31:601–610
4. Báez-Yánez M.G. et al. The impact of vessel size, orientation and intravascular contribution on the neurovascular fingerprint of BOLD bSSFP fMRI. Neuroimage 2017;163:13-23
5. Gagnon, L. et al. Quantifying the microvascular origin of BOLD-fMRI from first principles with two-photon microscopy and an oxygen-sensitive nanoprobe. J. Neurosci. 2015; 35: 3663–3675
6. Duvernoy, H.M. et al. Cortical blood vessels of the human brain. Brain Res. Bull. 1981; 7:519–579
7. Cassot F. et al. A novel three-dimensional computer-assisted method for a quantitative study of microvascular networks of the human cerebral cortex. Microcir 2006; 13:1-18
8. Lorthois S. et al. Simulation study of brain blood flow regulation by intra-cortical arterioles in an anatomically accurate large human vascular network: Part I: Methodology and baseline flow. NeuroImage 2011; 54:1031-1042
9. Payne S.J., El-Bouri W.K. Modelling dynamic changes in blood flow and volume in the cerebral vasculature. NeuroImage 2018; 176:124-137
10. El-Bouri W.K, Payne S.J. Multi-scale homogenization of blood flow in 3D human cerebral microvascular networks. J Theo Biol 2015; 380: 40-47
11. Blinder, P. et al. The cortical angiome: an interconnected vascular network with noncolumnar patterns of blood flow. Nature Neuroscience 2013; 15:889-897
12. El-Bouri W.K, Payne S.J. A statistical model of the penetrating arterioles and venules in the human cerebral cortex. Microcirc 2016; 23: 580-590
13. Boas, D.A. et al. A vascular anatomical network model of the spatio-temporal response to brain activation. NeuroImage 2008; 40:1116–1129
Figures