3828
Investigating Human Brain Negative Blood Oxygenation Level Dependent (BOLD) with Functional Quantitative Susceptibility Mapping (fQSM)1Graduate Institute of Biomedical Electronics and Bioinformatics, National Taiwan University, Taipei, Taiwan, 2Interdisciplinary MRI/MRS Lab, Department of Electrical Engineering, National Taiwan University, Taipei, Taiwan
Synopsis
We aim to use fQSM to investigate the phenomenon of negative BOLD with a visual stimulation task. fQSM data of 14 subjects was reconstructed with the phase information. The results show the negative BOLD is located in the identical brain region of Calcarine in both fMRI or fQSM analysis. In the future, we will optimize fQSM reconstruction method. A reliable fQSM is able to improve the understanding of the underline mechanism of fMRI BOLD.
Introduction
Functional MRI (fMRI) is a widely used image modality to measure brain activity but it lacks quantitative information. Recently, the development of quantitative susceptibility mapping (QSM) avails more and more studies examining the quantitative information of the functional activities. We had shown the QSM technique is able to measure the blood oxygenation level-dependent (BOLD) fMRI during the visual stimulation in animal model 1 and found the consistency between fMRI and functional QSM (fQSM). In this study, we aim to employ the QSM technique to investigate BOLD fMRI in the human brain, as well as the underline mechanism of the negative BOLD signal.Materials and Methods
We recruited 14 healthy subjects and scanned their brain activation with a visual stimulation task by scanning EPI and Gradient Echo sequence(GRE) respectively. The scan time per volume of EPI and GRE is 3.49s and 8.67s respectively. Therefore, we used two different experimental paradigms. In EPI scan, we performed a block design with 20.94s (6 volumes) visual stimulation and followed a 20.94s rest, and repeated 6 cycles; In GRE scan the visual stimulation and rest lasted 40.09s (5 volumes) respectively and repeated 8 cycles. All of the data acquired by Prisma 3T MRI with the following parameters. EPI scan: TR/TE=3.49s/46ms, voxel size =2.5x2.5x2.5mm3, MTX = 88x88x31, FOV = 220x220x77.5mm3. GRE scan: TR/TE=30ms/10ms, voxel size = 2.5x2.5x2.5mm3, MTX = 96x96x5, FOV = 240x240x12.5mm3.The fMRI results were analyzed by using SPM. The QSM data has been analyzed with the same process reported in our previous study. 2 In brief, first, we unwrapped the phase image by 3D path-based method. Second, the background field was removed using sophisticated harmonic artifact reduction for phase data (SHARP). The QSM reconstructed from the local field using L1 regularization.
Results
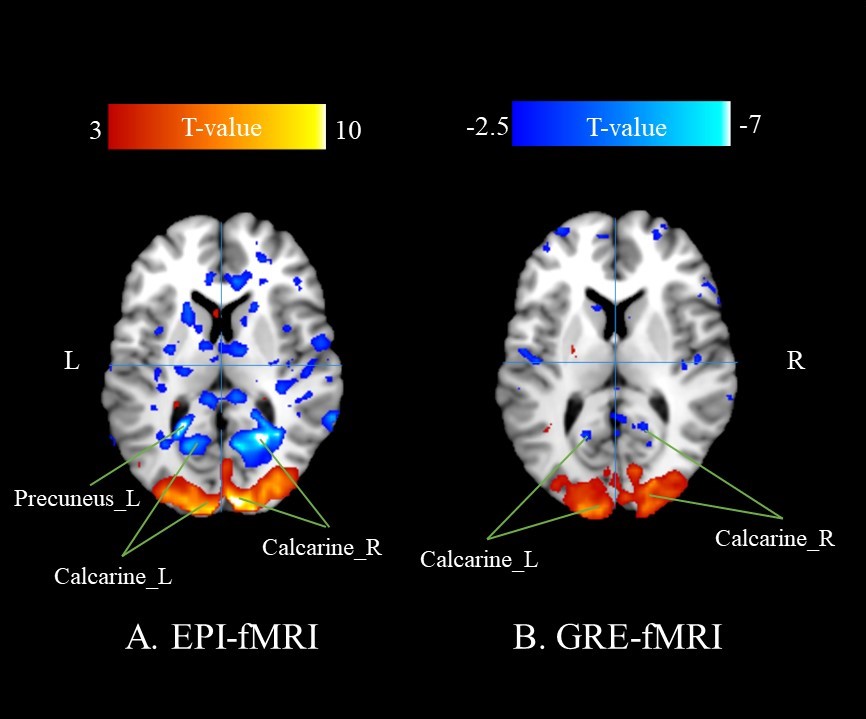
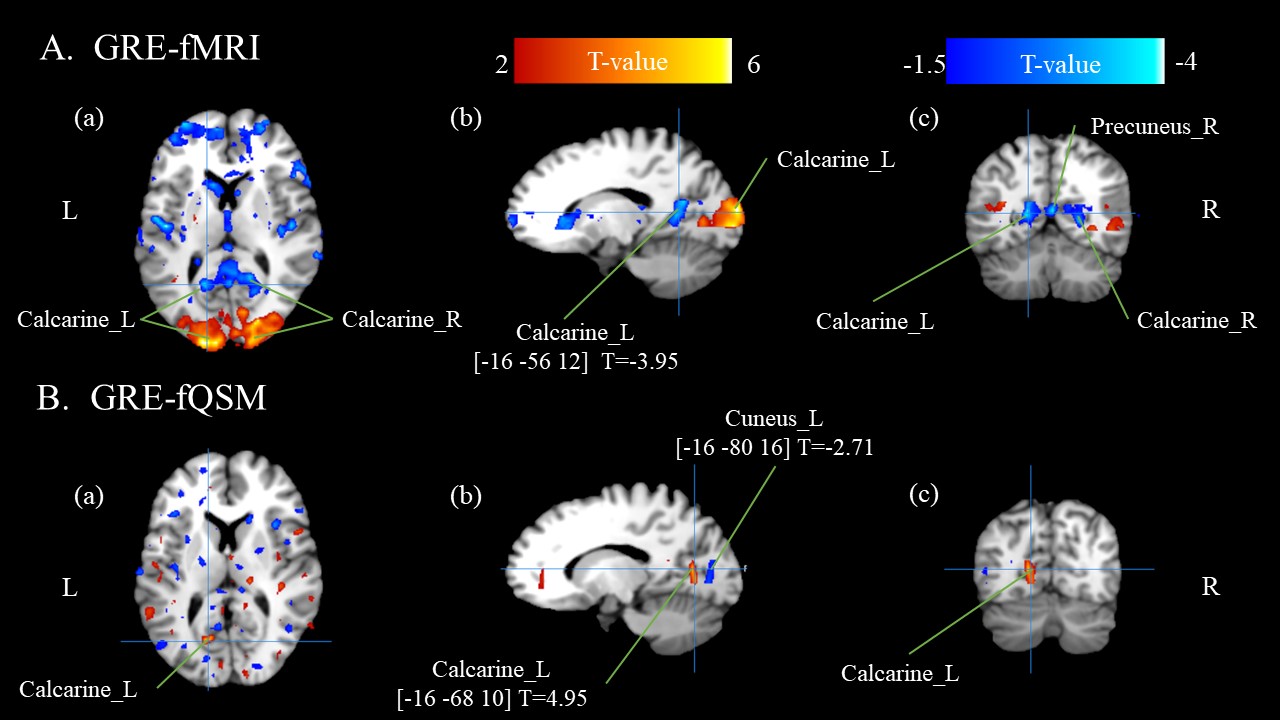
Figure 1 shows the activation maps of EPI-fMRI and GRE-fMRI. It indicates that the activation locations of EPI and GRE are consistent. Positive activations are located in the visual cortex while the negative BOLD appears in the Calcarine, a part of the visual cortex. The higher T2* effect makes EPI more sensitivity to detect the BOLD contrast, therefore, the activation strength in EPI is stronger than GRE. Figure 2 shows the activation region between GRE-fMRI and fQSM. The t-value of the peak of Negative BOLD is in Calcarine_L ([-16 -56 12], t-value = -3.95). On the other hand, the peak of positive fQSM is also in Calcarine_L ([-16 -68 10], t-value = 4.95), which is 1.2 cm apart from the fMRI result. As the higher susceptibility value measured in fQSM would conduct a lower signal strength in fMRI BOLD, our results demonstrate the consistency between fMRI and fQSM. In addition, the negative fQSM and the positive BOLD of fMRI also show this consistency.Discussion and conclusion
In this study, we performed a visual stimulation task and examined the fMRI BOLD and fQSM data. We showed the activation negative BOLD in Left Calcarine which is consistent with the corresponding positive fQSM results in Left Calcarine. Compare to the EPI-fMRI results, the GRE-fQSM has great potential, since it is a quantitative method and does not suffer from the distortion due to the susceptibility effect. In the future, we would optimize the fQSM process in GRE-fQSM and further applied this technique in EPI-fQSM. A reliable fQSM is able to improve the understanding of the underline mechanism of fMRI BOLD.Acknowledgements
This study was supported by Ministry of Science and Technology (MOST 107-2314-B-002-280) and National Health Research Institutes (NHRI-EX108-10829EI).References
1. Hsin-Chih Lo, Meng-Chi Hsieh, Der-Yow Chen, Ke-Hsin Chen and Jyh-Horng Chen, “Quantitative Susceptibility Functional MRI (QS-fMRI) of Rat Brain during Flashing Light Stimulation”, International Conference on Magnetic Resonance in Biological Systems, 2016
2. Meng-Chi Hsieh, Li-Wei Kuo, Yun-An Huang, and Jyh-Horng Chen, “Investigating hyperoxic effects in the rat brain using quantitative susceptibility mapping based on MRI phase,” Magn Reson Med, Feb. 2016.
Figures