3826
Apparent attenuation of BOLD macro-vascular contributions with high-frequency stimuli1Athinoula A. Martinos Center for Biomedical Imaging, Massachusetts General Hospital, Boston, MA, United States, 2Department of Radiology, Harvard Medical School, Boston, MA, United States, 3Department of Biomedical Engineering, Boston University, Boston, MA, United States, 4Harvard-Massachusetts Institute of Technology Division of Health Sciences and Technology, Boston, MA, United States
Synopsis
Fast fMRI signals may reflect an enhanced relative contribution of fast microvascular signals in the BOLD response. In the current work we tested whether using fast oscillatory stimulus frequencies indeed leads to a relative attenuation of the signal from draining veins, as compared to the microvasculature. Our results suggest that the relative contribution of deep BOLD signals is enhanced at high stimulus frequencies.
Introduction
In conventional block and event-related BOLD fMRI experiments, the amplitude of signal fluctuations is generally observed to be largest in the vicinity of draining pial veins (1). This property limits the specificity of fMRI both spatially, because the activation is detected away from the neural tissue of interest, and temporally, because BOLD responses from draining veins are slow and depend non-linearly on neuronal activity (2). This sluggishness of the haemodynamic response is a key limiting factor for studying neuronal activity with fMRI, yet recent studies have shown that experiments using fast oscillatory stimuli presented at ultra-high spatiotemporal resolution lead to measurable responses despite canonical HRF models suggesting otherwise (3,4). Furthermore, BOLD responses near the white matter interface, as compared to the pial surface, are known to show faster dynamics (5,6,7), suggesting a potential origin for fast fMRI signals.These observations suggest that fast fMRI signals may reflect an enhanced relative contribution of fast microvascular signals. Here we tested whether driving BOLD responses with faster stimulus frequencies leads to a relative attenuation of the signal from draining veins relative to the microvasculature. We acquired fMRI data at high spatiotemporal resolution in order to separate signals arising mostly from large draining veins, localized closer to the pial surface, and signals arising mostly from the microvasculature, using a cortical depth-dependent analysis (8).Methods
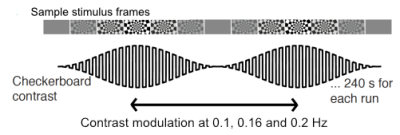
We acquired data from 6 subjects (5F/1M, 27.6±5.5 years) on a Siemens 7T whole-body scanner. Anatomical reference data were collected at 0.75mm isotropic resolution using a ME-MPRAGE sequence. Functional data were acquired at 0.9mm isotropic, with 18 slices positioned at the calcarine sulcus, using a GRE-EPI with parameters: TE/TR:27/1160ms, PAT4,PF 7/8. In each session, a large field-of-view reference scan was acquired to aid anatomical-to-functional registration. Participants were shown an oscillatory stimulus as described in (3) and shown in Figure 1, in which the luminance contrast of a flickering checkerboard oscillated over time at a given frequency of interest. The number of runs per subject varied between 6 and 8. Stimuli oscillated at either 0.1 Hz or 0.16 Hz. In two subjects, stimuli oscillating at 0.2Hz were also used.The anatomical data was bias-field corrected using SPM, and then passed to FreeSurfer’s recon-all for surface reconstruction. The functional data were motion corrected using AFNI and registered to the anatomical using bbregister using the large FOV EPI reference as an intermediate step. Maps of response amplitudes and phase delays with respect to the oscillatory stimulus were obtained using a GLM and two orthogonal sine and cosine regressors. The design matrix also included 4 tCompCor and 6 motion parameter estimates as regressors of no-interest.
Analysis was carried out in anatomical space by registering the derived amplitude and phase maps to each subject’s anatomical data upsampled to 0.25mm isotropic, from which volumetric cortical depth masks were generated for the posterior V1. Masks were further constrained by binarizing and uniting the amplitude maps of all runs thresholded at F=1.2, and then dilated thrice to avoid biasing the masks towards the surface where a larger activation region is expected. The mean amplitude of voxels sampled at the white and pial surfaces for each run was computed by averaging F-statistics within each corresponding mask. The phase estimate for the white and pial surfaces was estimated by finding the peak of a histogram of phase values within the mask, constrained to voxels where the amplitude was larger than 1.
Results
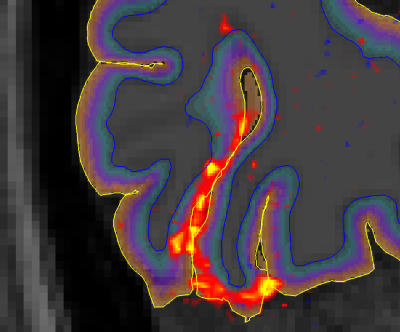
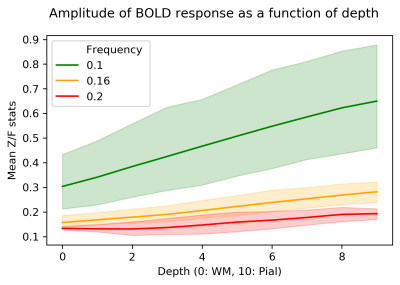
An example of the activation (Gaussianized Z/F statistics) obtained with the 0.1 and 0.16 Hz stimuli for a single subject is shown in Figure 2, overlaid onto the anatomical reference and shown relative to the depth masks computed in the posterior V1.Figure 3 shows how the mean of F-statistics decreases from the pial surface towards the white matter (WM) surface, consistent with previous studies. However, despite the loss in sensitivity, the ratio between the amplitudes measured at the WM surfaces increases as the frequency of stimulation is increased, indicating that tissue signal exhibits less attenuation to faster stimuli (Figure 4).
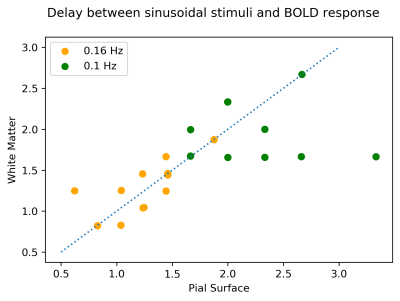
Figure 5 shows BOLD onset delays for 0.1 and 0.16 Hz stimulation (0.2 excluded because signal amplitude was low for phase estimation), suggesting that at higher frequencies the delay between white and pial surfaces decrease.
Discussion
Our results suggest that the relative contribution of deep BOLD signals is enhanced at high stimulus frequencies. Although our data does not explain why the ratio between signals from tissue and the pial vasculature is frequency dependent, at least two effects could explain these observations and merit further study. First, the signal from draining veins may be attenuated if there are transit time differences between neighboring microvascular areas being drained, leading to downstream phase cancellation. Second, as the stimulus frequency increases, the diameter of draining veins could reach a steady-state in which changes to applied stimuli lead to more linear BOLD responses. In this regime, delays between the micro- and macrovascular responses should be reduced, and our preliminary data show that this effect can potentially be measured. Different temporal nonlinearities across the vasculature may therefore lead to attenuation of macrovascular signals in response to rapid neural activity.Acknowledgements
This work was supported by National Institutes of Health grants P41-EB015896, R00-MH11748, R21-NS106706, R01-EB019437 and by the MGH/HST Athinoula A. Martinos Center for Biomedical Imaging; and was made possible by the resources provided by NIH Shared Instrumentation Grants S10-RR019371.References
1. Turner, R. 2002. “How Much Cortex Can a Vein Drain? Downstream Dilution of Activation-Related Cerebral Blood Oxygenation Changes.” NeuroImage 16 (4): 1062–7.
2. Zhang, Nanyin, Essa Yacoub, Xiao-Hong Zhu, Kamil Ugurbil, and Wei
Chen. 2009. “Linearity of Blood-Oxygenation-Level Dependent Signal at
Microvasculature.” NeuroImage 48 (2): 313–18.
3. Lewis, Laura D., Kawin Setsompop, Bruce R. Rosen, and Jonathan R. Polimeni. 2016. “Fast fMRI Can Detect Oscillatory Neural Activity in Humans.” Proceedings of the National Academy of Sciences 113 (43): E6679–E6685.
4. Lewis, Laura D., Kawin Setsompop, Bruce R. Rosen, and Jonathan R. Polimeni. 2018. “Stimulus-Dependent Hemodynamic Response Timing Across the Human Subcortical-Cortical Visual Pathway Identified Through High Spatiotemporal Resolution 7T fMRI.” NeuroImage 181 (June): 279–91.
5. Siero, Jeroen CW, Natalia Petridou, Hans Hoogduin, Peter R Luijten, and Nick F Ramsey. 2011. “Cortical Depth-Dependent Temporal Dynamics of the BOLD Response in the Human Brain.” Journal of Cerebral Blood Flow & Metabolism 31 (10): 1999–2008.
6. Chen, Brenda R., Matthew B. Bouchard, Addason F. H. McCaslin, Sean A. Burgess, and Elizabeth M. C. Hillman. 2011. “High-Speed Vascular Dynamics of the Hemodynamic Response.” NeuroImage 54 (2): 1021–30.
7. Yu, Xin, Daniel Glen, Shumin Wang, Stephen Dodd, Yoshiyuki Hirano, Ziad Saad, Richard Reynolds, Afonso C. Silva, and Alan P. Koretsky. 2012. “Direct Imaging of Macrovascular and Microvascular Contributions to BOLD fMRI in Layers IV–V of the Rat Whisker–Barrel Cortex.” NeuroImage 59 (2): 1451–60.
8. Polimeni, Jonathan R., Bruce Fischl, Douglas N. Greve, and Lawrence L. Wald. 2010. “Laminar Analysis of 7T BOLD Using an Imposed Spatial Activation Pattern in Human V1.” NeuroImage 52 (4): 1334–46.
Figures


