3822
Optimization of vascular and functional sensitivity using multi-contrast, multi-echo SAGE-EPI for fMRI1Neuroimaging Research, Barrow Neurological Institute, Phoenix, AZ, United States, 2Neuropsychology, Mayo Clinic Arizona, Phoenix, AZ, United States
Synopsis
The purpose of this study is to develop a multi-contrast, multi-echo sequence using spin- and gradient-echo (SAGE) for fMRI; furthermore, we sought to assess various analysis schemes for optimal quantification of fMRI. For this purpose, we acquired SAGE-fMRI data with five echoes (2 gradient-echo, 2 asymmetric spin-echoes, and 1 spin-echo) using a visual stimuli task in 8 healthy subjects. Analysis was performed using each echo signal individually, using weighting factors to combine dynamic signals, and by quantifying dynamic R2* and R2 time-courses. These methods are compared to determine the optimal analysis method for SAGE-fMRI.
Introduction
Functional MRI (fMRI) can map synchronous fluctuations in brain activity via blood-oxygen-level dependent (BOLD) sensitivity. The basic sequence used for fMRI leverages gradient-echo EPI, which provides high BOLD T2* sensitivity. Drawbacks include susceptiblility-induced signal drop-outs, sensitivity to large draining vessels, and suboptimal single-echo T2* sensitivity. This has led to the development of multi-echo (gradient-echo) fMRI [1,2] and spin-echo (SE) fMRI [3]. Multi-echo fMRI improves contrast sensitivity by optimally combining echo signals and can improve characterization of functional activation. However, multi-echo methods suffer from sensitivity to large vessels and signal dropout due to susceptibility. On the other hand, spin-echo methods permit refocusing of signal dropout, especially in anterior frontal and temporal lobes, and are less sensitive to large draining veins, though these methods generally have lower contrast-to-noise ratio (CNR). To combine the advantages of multi-echo and spin-echo fMRI, we developed a multi-echo, multi-contrast fMRI method using a combined spin- and gradient-echo (SAGE) sequence, which was previously developed for perfusion MRI [4,5]. We hypothesize that SAGE-based BOLD fMRI [6] will improve sensitivity and CNR, while reducing distortion and dropout.Methods
Eight healthy participants (5 females; 20.6±2.9 years) were included in this study. The fMRI paradigm was a vision task with alternating 30 second blocks, for a total of 2 minutes (Presentation software) [7]. MRI data were acquired at 3T (Ingenia, Philips). SAGE-fMRI data were acquired with 2 gradient-echoes, 2 asymmetric spin-echoes, and 1 Hahn spin-echo (TE1-5 = 5.97/18.76/36.048/49.27/62.06 ms, TR = 3000 ms, acquisition matrix: 64×64; voxel size: 3.75×3.75 mm; slice thickness: 5.0 mm; 34 sagittal slices; 42 volumes). For each TE, a reverse phase-encoding acquisition was acquired to correct for EPI image distortion.SAGE-fMRI data were processed using both single-echo and multi-echo combinations. More specifically, each TE was processed individually (five echoes, signals S1-S5), where S2 is similar to standard fMRI acquisitions. The SAGE signals at each TE depend on R2* and/or R2, as follows:
$$S(TE) = \left\{ \begin{array}{l l} S_0^I \cdot exp[-TE \cdot R_2^*] & \quad \text{0 < $TE$ < $TE_{SE}$/2}\\ S_0^{II} \cdot exp[-TE_{SE} \cdot (R_2^*-R_2)]\cdot exp[-TE \cdot (2R_2-R_2^*)] & \quad \text{$TE_{SE}$/2 < $TE$ < $TE_{SE}$}\\ \end{array} \right.$$
The multi-echo combinations include a simple sum across echoes, regardless of contrast type, CNR-weighting [8], and relaxation-weighting, where weighting factors were determined by partial derivatives of the signals by specific relaxation rates. For example, the relaxation weighting factor for T2* is given by
$$w_{T_2^*}(TE) = \left\{ \begin{array}{l l} TE \cdot exp[-TE \cdot R_2^*] & \quad \text{0 < $TE$ < $TE_{SE}$/2}\\ TE_{SE} \cdot exp[-TE_{SE} \cdot (R_2^*-R_2)-TE\cdot(2R_2-R_2^*)] - TE \cdot exp[-TE\cdot(2R_2-R_2^*)-TE_{SE} \cdot (R_2^*-R_2)] & \quad \text{$TE_{SE}$/2 < $TE$ < $TE_{SE}$}\\ \end{array} \right.$$
Finally, dynamic relaxation rates R2* and R2 were quantified by SAGE fitting (Equation 1). Twelve combinations were compared to determine the optimal analysis method. All SAGE-fMRI images were processed using standard procedures using FSL and AFNI. AFNI (3dDeconvolve) was used to calculate the statistical parametric maps of response to visual stimuli from all fMRI data.
Results
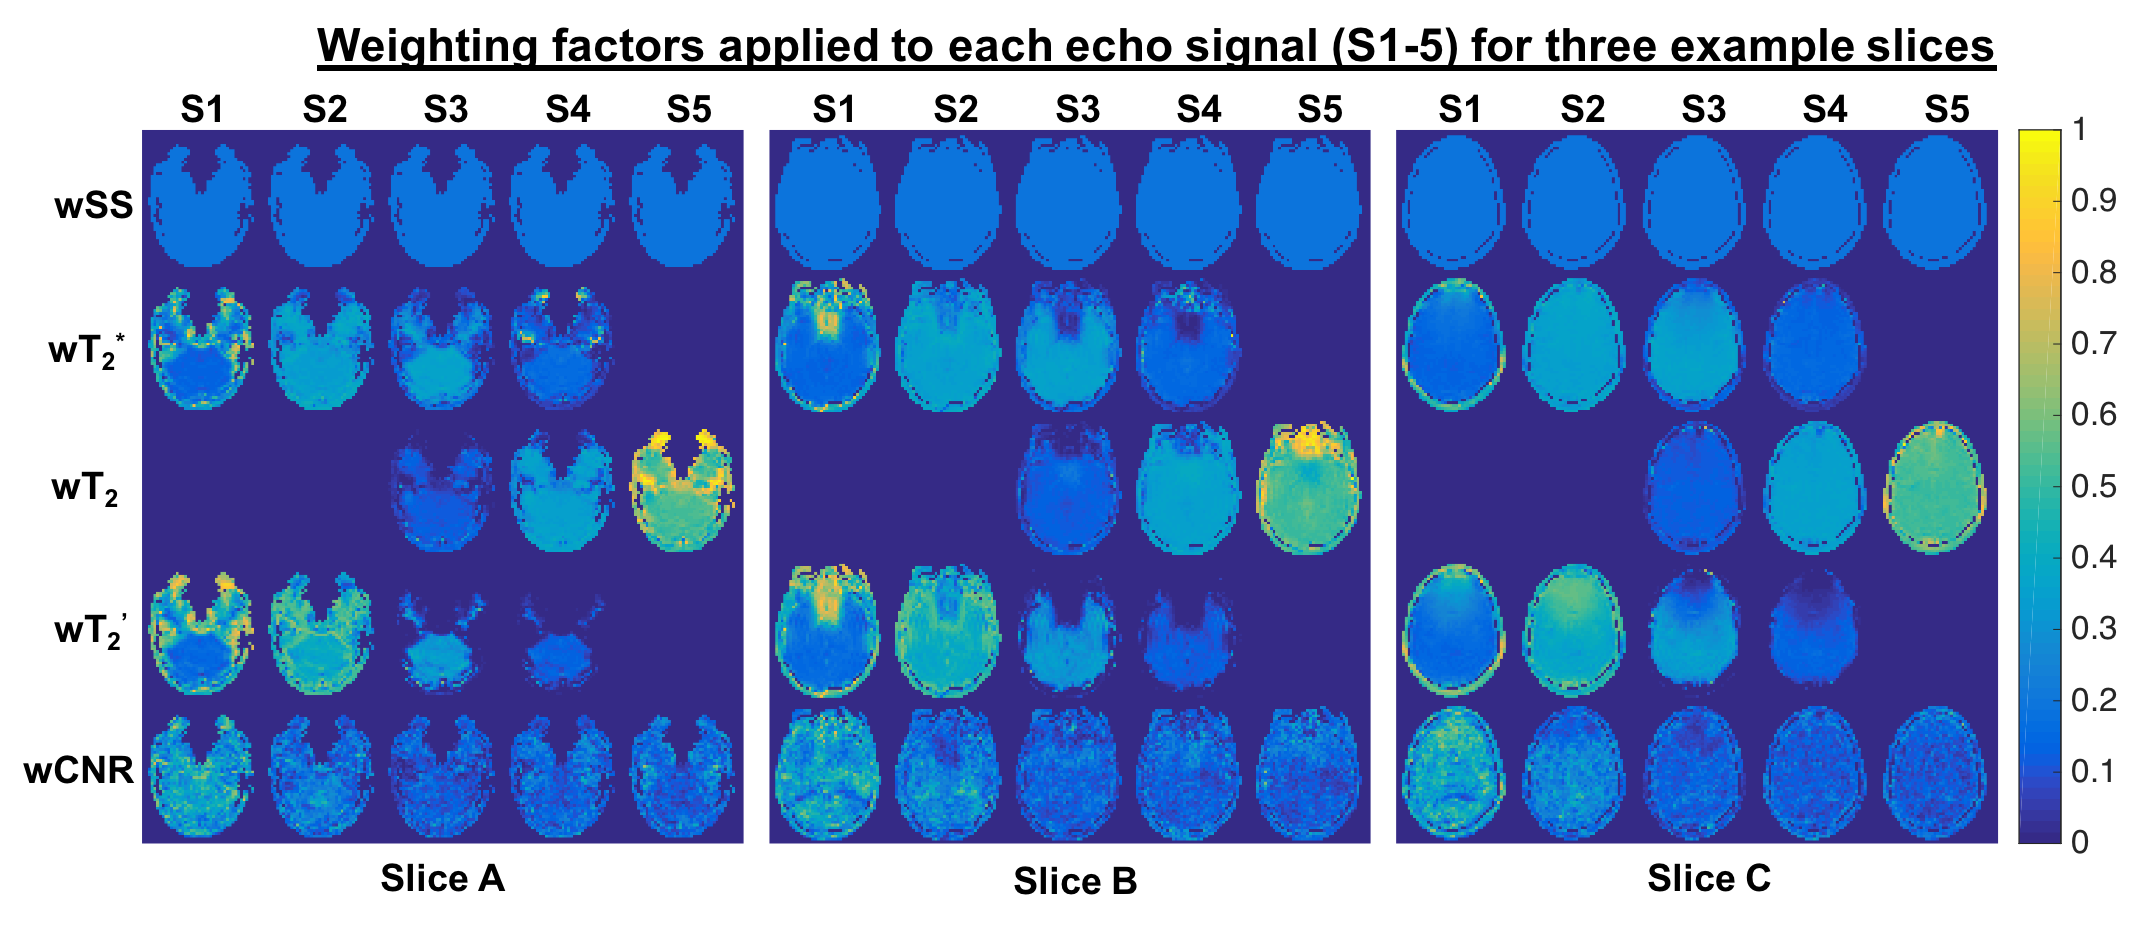
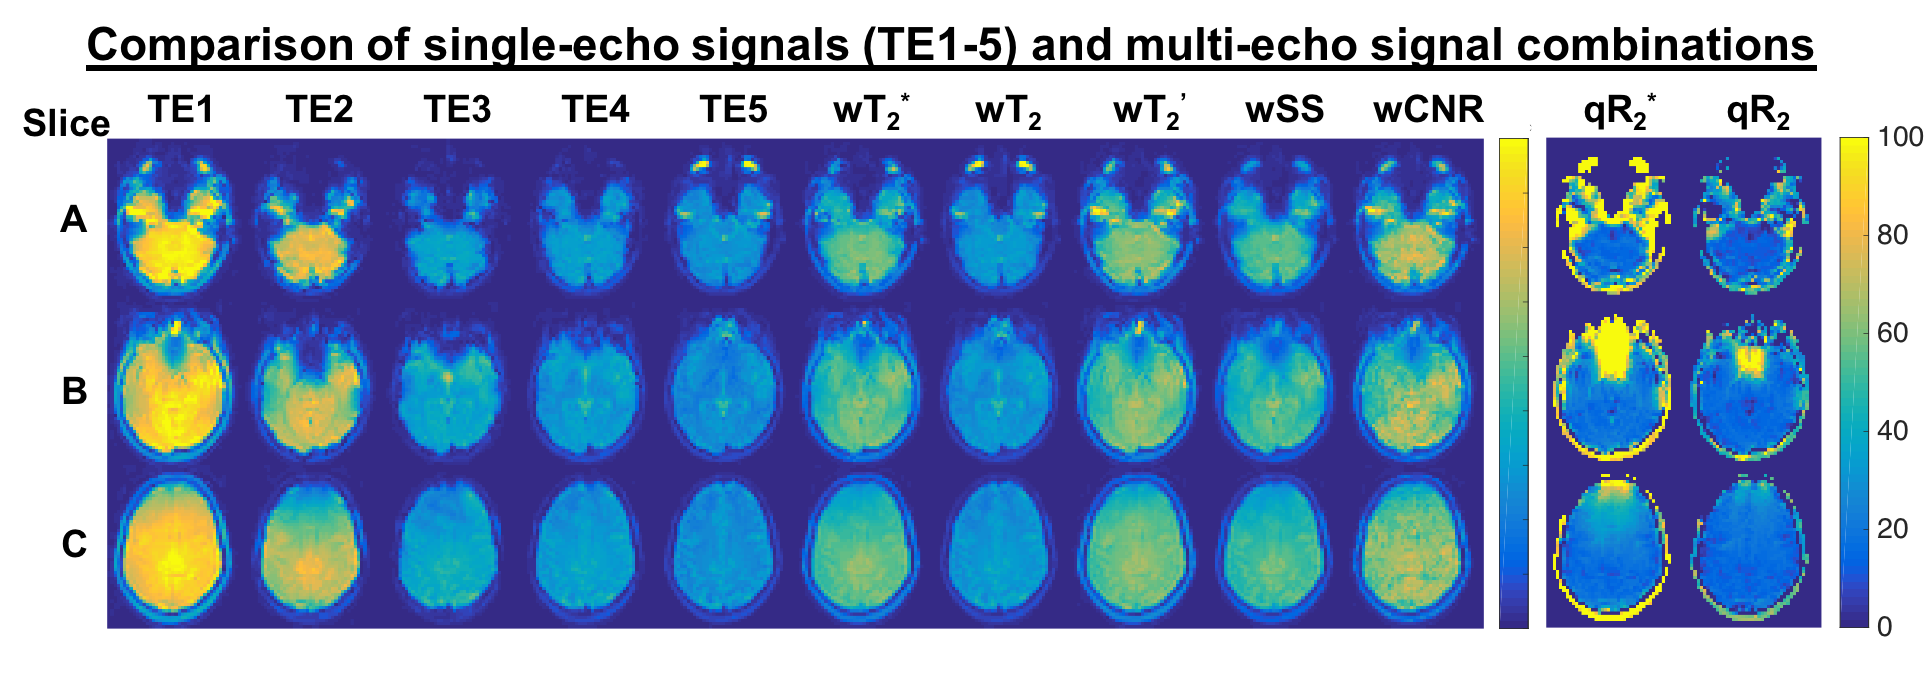
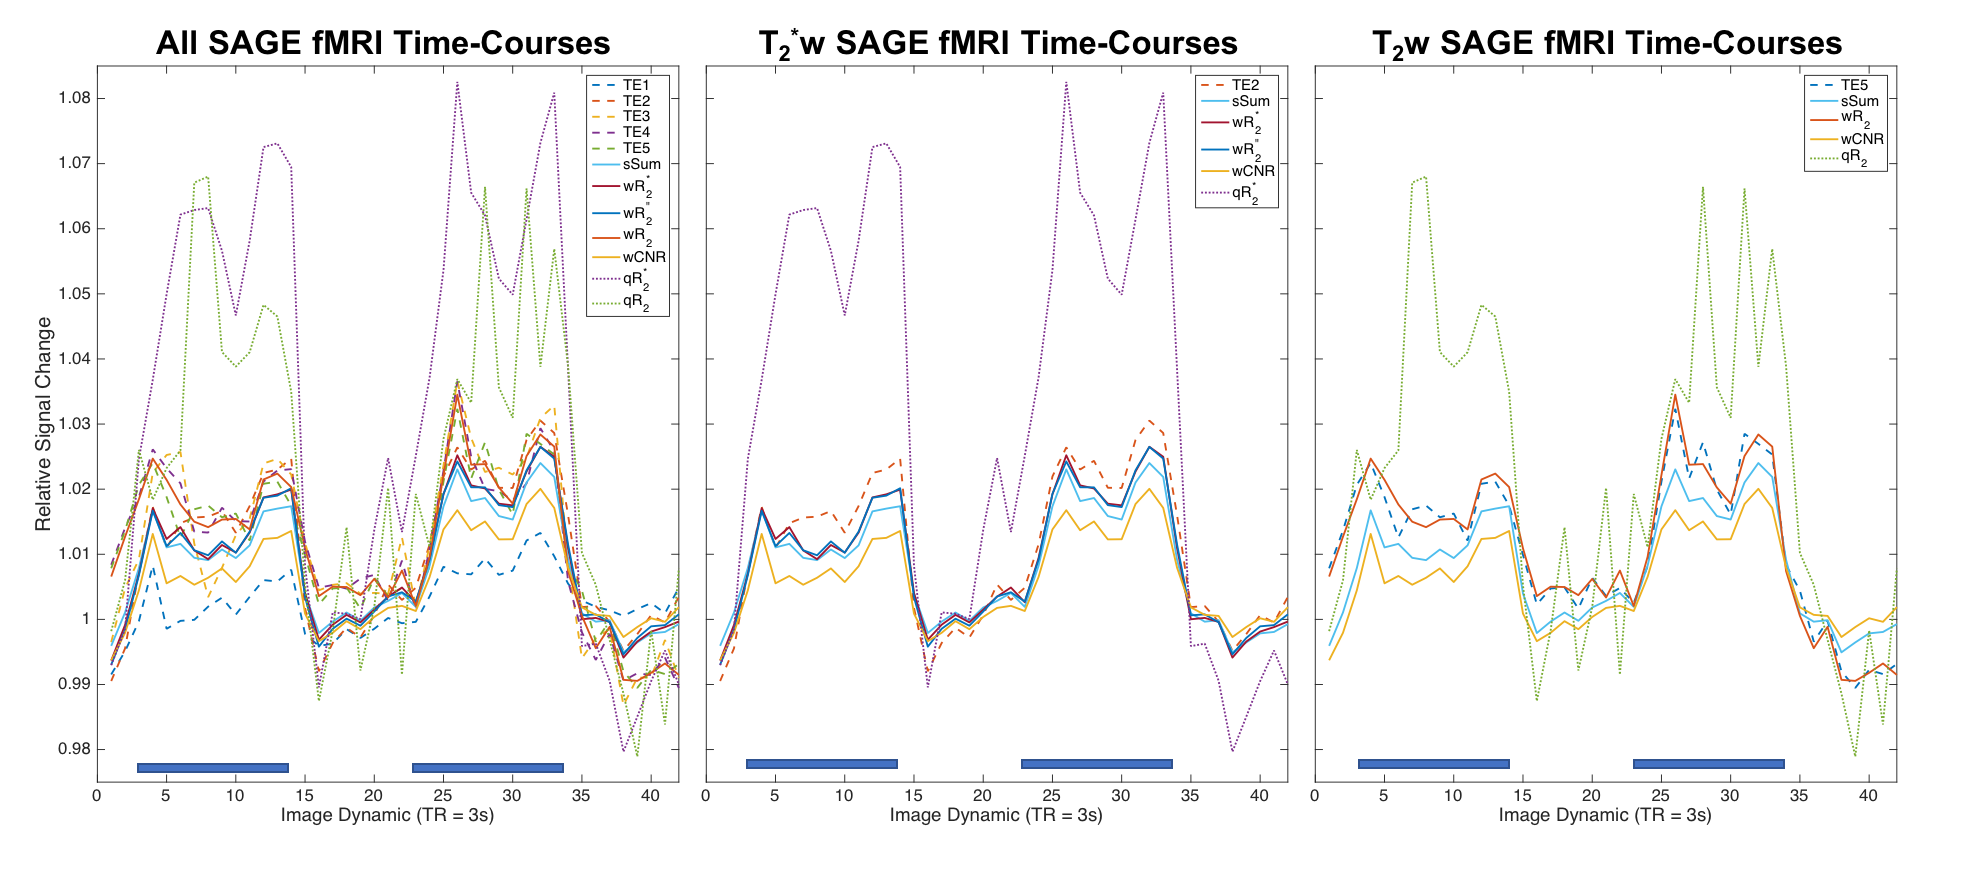
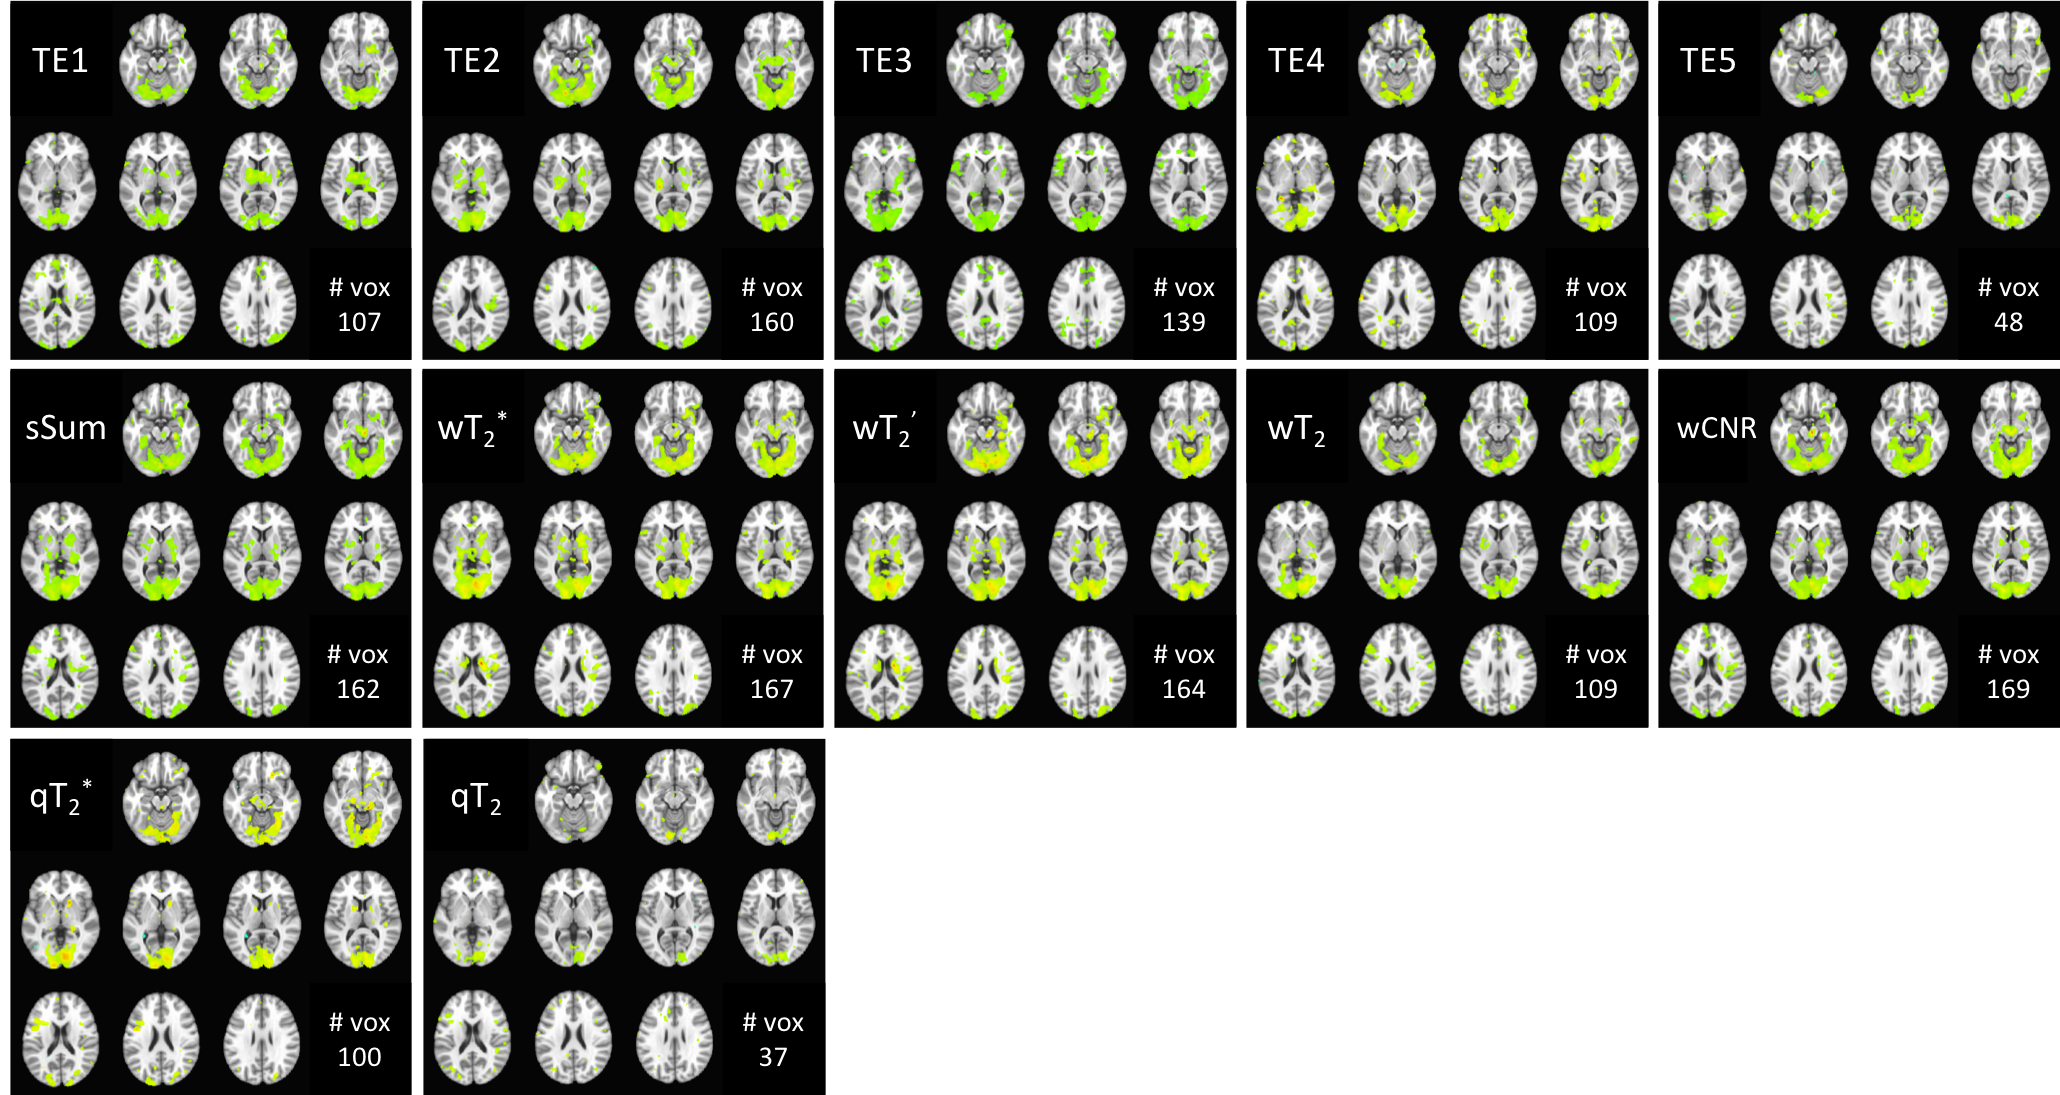
The multi-echo weighting factors for each echo signal are shown in Figure 1 for three representative slices. For simple sum, the weighting factor is the same for each echo and voxel. The relaxation-weights vary both spatially and across echoes, based on their derived contribution to BOLD contrast. Additionally, the weighting is higher near air-tissue interfaces at shorter TEs, which may improve quantification in these regions. CNR-weighting tends to be highest at the first echo. Applying these weighting factors produces the fMRI time-courses for analysis. Figure 2 shows the single-echo and multi-echo combinations. Relative to TE2, signal is recovered near air-tissue interfaces with multi-echo combinations. SAGE-fMRI also permits dynamic fits of R2* and R2 as quantitative measures of BOLD activation. Figure 3 shows dynamic SAGE-fMRI acquired during a visual task. TE1 has the smallest signal change, while qR2* and R2 have higher relative signal changes. The multi-echo combinations show the lowest signal change for CNR-weighting, while the relaxation-weighting shows higher relative signal changes. Figure 4 shows the group results across all single-echo and multi-echo combinations. The weighted-sum combinations, except wT2, generally had more significant voxels than single-echo analysis. For T2-contrast fMRI, relaxation weighting provides more voxels. Quantitative T2* and T2 produced the smallest numbers of voxels per contrast mechanism, though this could reflect higher accuracy for these metrics.Discussion
SAGE-fMRI may improve signal quantification in susceptibility regions, while inclusion of spin-echo signal may improve spatial localization. Although R2* and R2 are more directly related to neuronal activation, previous fMRI studies have shown that R2* is less robust than weighted combinations [2]. Nevertheless, SAGE-fMRI provides flexibility for analysis and can be optimized for different contrast mechanisms. SAGE-fMRI could provide insight into the intra- and extravascular BOLD contributions and improve our understanding of fMRI mechanisms. Moreover, SAGE-fMRI may permit more advanced analysis into spatio-temporal differences between gradient- and spin-echo activation, which are critical for understanding neurovascular dynamics across pathologies.Conclusions
SAGE-fMRI enables multi-echo, multi-contrast characterization, and we showed that two contrast mechanisms can be acquired, separated, and enhanced using optimized analysis algorithms. The use of SAGE-fMRI provides significant advantages, including improving SNR and CNR for more accurate analysis. SAGE-fMRI may ultimately provide new insight into the complex contributions to BOLD signal and improve spatial localization of brain activation.Acknowledgements
This work was supported by the Barrow Neurological Foundation and Philips Healthcare.References
[1] Kundu P, Brenowitz ND, Voon V, Worbe Y, Vertes PE, Inati SJ, et al. Integrated strategy for improving functional connectivity mapping using multiecho fMRI. Proc Natl Acad Sci 2013;110:16187–92.
[2] Posse S, Wiese S, Gembris D, Mathiak K, Kessler C, Grosse-Ruyken M-L, et al. Enhancement of BOLD-contrast sensitivity by single-shot multi-echo functional MR imaging. Magn Reson Med 1999;42:87–97.
[3] Binney RJ, Embleton K V, Jefferies E, Parker GJM, Ralph MAL, Sciences I, et al. The Ventral and Inferolateral Aspects of the Anterior Temporal Lobe Are Crucial in Semantic Memory : Evidence from a Novel Direct Comparison of Distortion-Corrected fMRI , rTMS , and Semantic Dementia. Cereb Cortex 2010;20:2728–38.
[4] Stokes AM, Skinner JT, Quarles CC. Assessment of a combined spin- and gradient-echo (SAGE) DSC-MRI method for preclinical neuroimaging. Magn Reson Imaging 2014;32:1181–90.
[5] Schmiedeskamp H, Straka M, Newbould RD, Zaharchuk G, Andre JB, Olivot JM, et al. Combined spin- and gradient-echo perfusion-weighted imaging. Magn Reson Med 2012;68:30–40.
[6] Schmiedeskamp H, Peterson E, Maclaren J, O’Halloran R, Christen T, Holdsworth SJ, et al. Multiband spin- and gradient-echo (SAGE) fMRI. Proc. 22nd Annu. Meet. ISMRM, Milan, Italy: 2014, p. 1503.
[7] Braden BB, Pipe TB, Smith R, Glaspy TK, Deatherage BR, Baxter LC. Brain and behavior changes associated with an abbreviated 4-week mindfulness-based stress reduction course in back pain patients. Brain Behav 2016;6:e00443.
[8] Poser BA, Versluis MJ, Hoogduin JM, Norris DG. BOLD contrast sensitivity enhancement and artifact reduction with multiecho EPI: Parallel-acquired inhomogeneity-desensitized fMRI. Magn Reson Med 2006;55:1227–35.
Figures