3821
In vivo Direct MR Imaging of Mouse Whisker Sensory Responses1Department of Biomedical Engineering, Sungkyunkwan University, Suwon, Republic of Korea, 2Center for Neuroscience Imaging Research, Institute for Basic Science, Suwon, Republic of Korea
Synopsis
Although there are debates on direct MR imaging of neuronal activity, the feasibility of this topic has been finding in various different ways. Herein, we propose an effective method of line-scan-based FLASH (LS-FLASH) imaging to directly capture sensory responses of in vivo mouse brain with a 5-ms temporal resolution. The response delay of ~10 - 15 ms between the thalamus and somatosensory barrel cortex (S1BF) was observed when the electrical stimulation was applied to the left mouse whisker area.
Introduction
Although successes of directly detecting neuronal activity have been reported1–4, some studies reported that neuronal signals of statistical significance were not detected5–9. This led to debates on the possibility of using MRI for directly detecting the neuronal activity and it is still ambiguous and inconclusive mainly due to unsolved challenges such as low signal intensity and poor temporal resolution. To continue our earlier work on this topic10,11, we here present the results of the in vivo mouse brain with a 5-ms temporal resolution, supporting the feasibility of in vivo direct imaging of neuronal activity (DIANA) using MRI.Methods
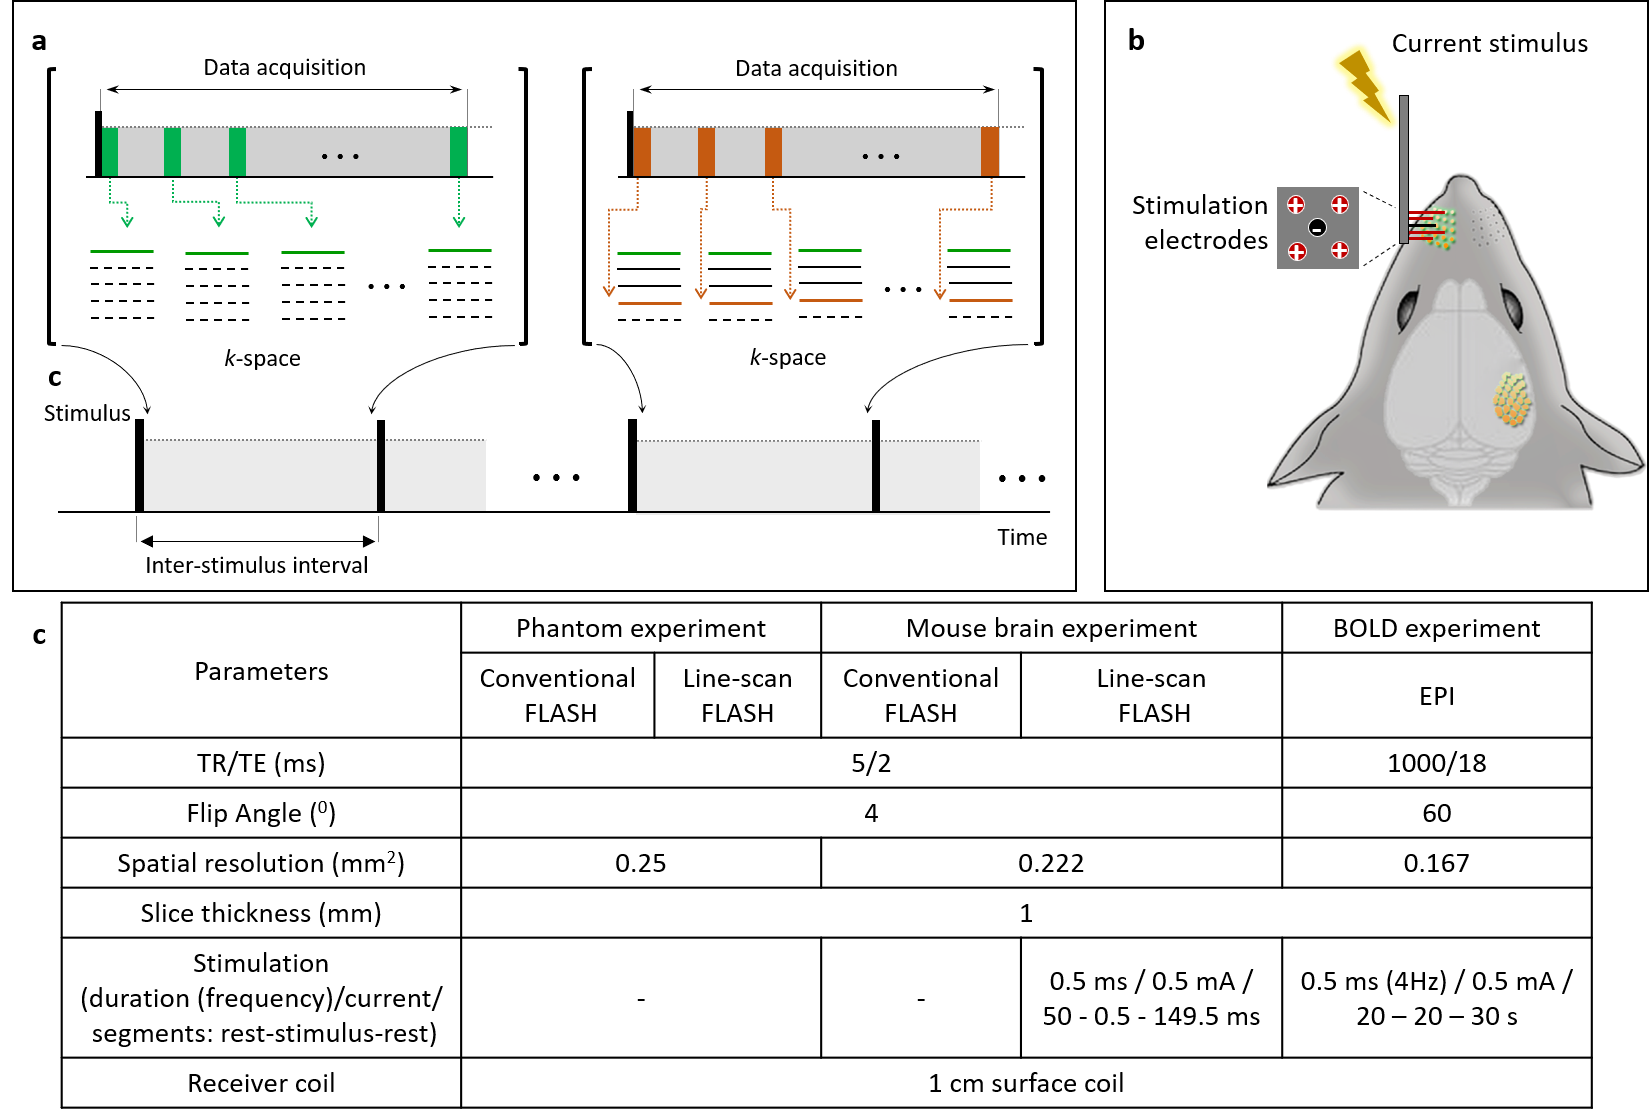
Line-scan-based FLASH Sequence (LS-FLASH): The key idea of our study is to increase the temporal resolution as high as possible (e.g., ~5 ms) to effectively capture the transient effects of neuronal activity and thereby enhance the detection sensitivity as well as temporal resolution. To do this, we combined the line-scan method12 and fast low-angle shot (FLASH) technique, dubbed LS-FLASH here, which acquires the same k-space lines consecutively in a time series during each repetitive interstimulus period (Fig.1a).Experiments: In vivo mouse brain imaging was performed on a 9.4T Bruker scanner (BioSpec 94/30, Ettlingen, Germany). Three male C57BL/6 mice (28-32 g, 10-14 weeks old; Orient Bio, Korea) were used in the approval of the Institutional Animal Care and Use Committee of Sungkyunkwan University in accordance with the standards for humane animal care. Animal preparations followed previous studies13,14. An electrical stimulation bar was applied to the left whisker area (Fig.1b). A time series of 40 two-dimensional coronal images were acquired with a 5-ms temporal resolution. The duration of each repetitive interstimulus period was 200 ms (= 40 x 5ms). Matrix size = 72 x 54, field-of-view = 16 x 12 mm2, scan time = 10.8 seconds. Other scan and electrical stimulation parameters were detailed in Figure 1c.
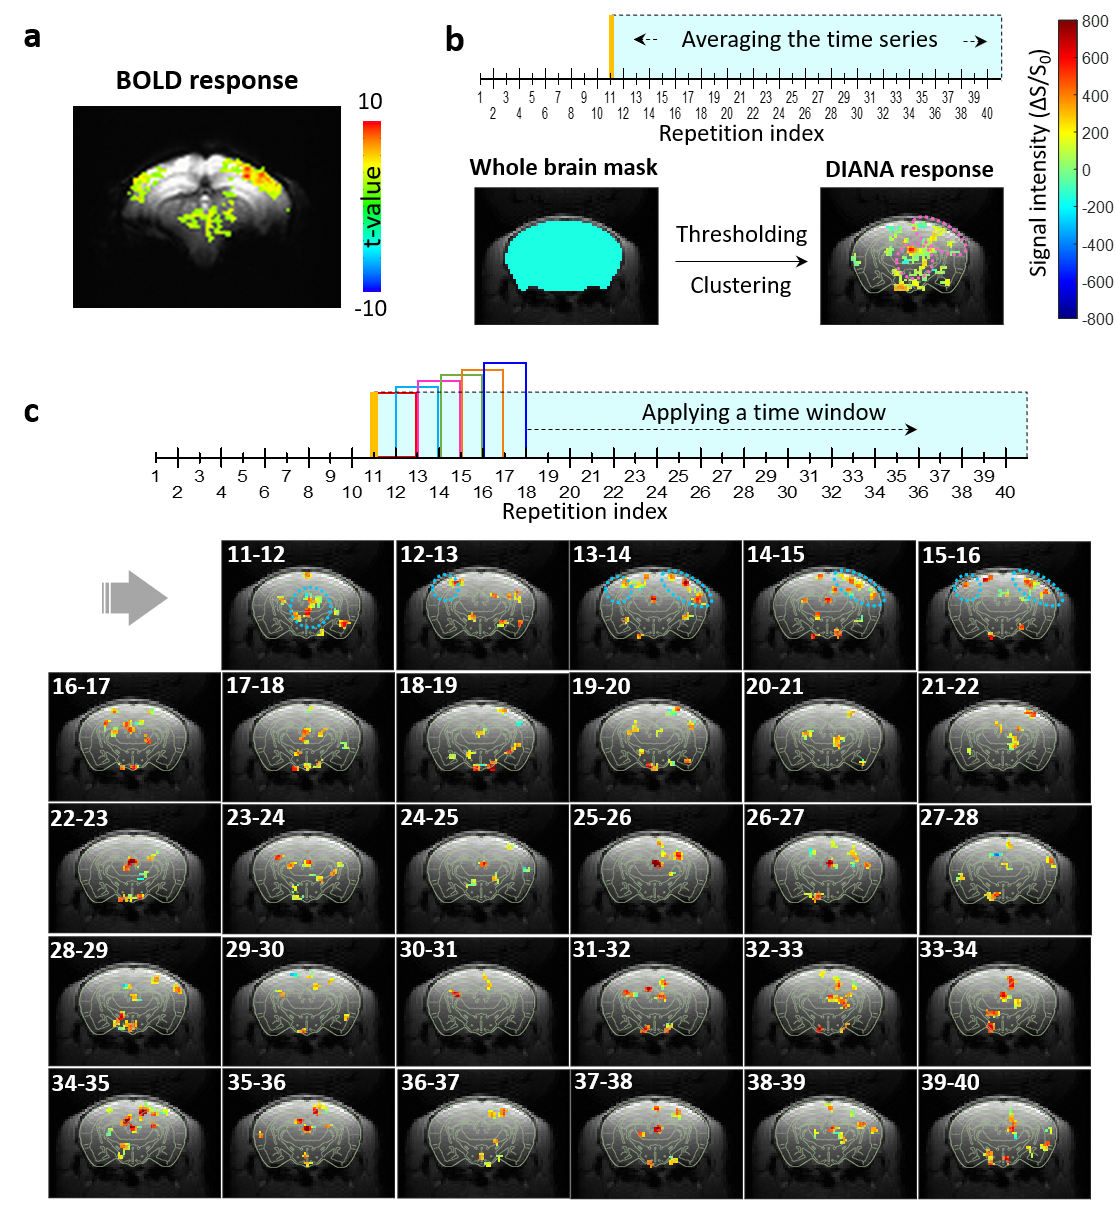
Data analysis: All data analyses were performed with the home-built Matlab code (Mathworks, Natick, USA). The BOLD activation map was made using the Analysis of Functional Neuroimages (AFNI)15 pipeline (uncorrected p < 0.02 and cluster size > 5 voxels), averaged from 5 runs. In case of DIANA response, two types of activation maps were obtained (1) by averaging the time-series data after the stimulation and (2) by applying a time window with a 10-ms width (= a duration of two repetitions) and a 5-ms moving speed (= a duration of one repetition), respectively. Thresholding (> 2,200 for (1), >1,100 for (2)) and clustering (> 5 voxels) were applied after a whole-brain masking. The Gaussian smoothing was applied to highlight the response areas. LS-FLASH data were averaged from 40 runs.
Results and Discussion
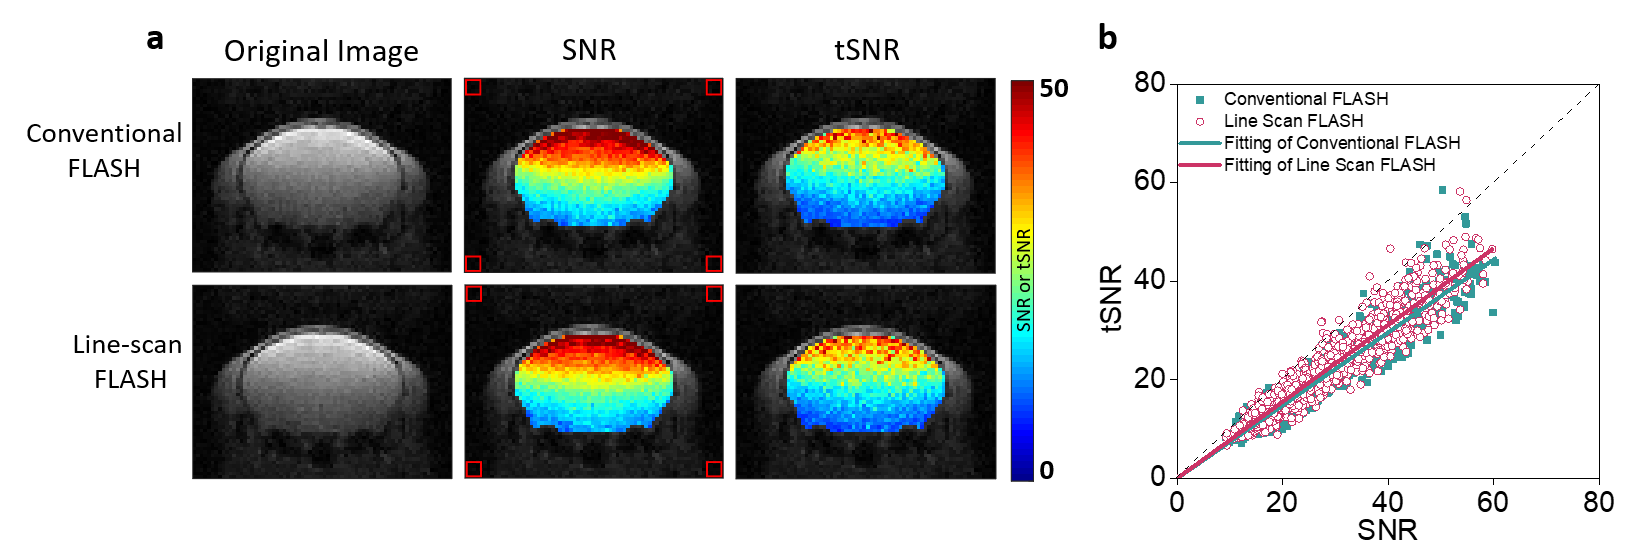
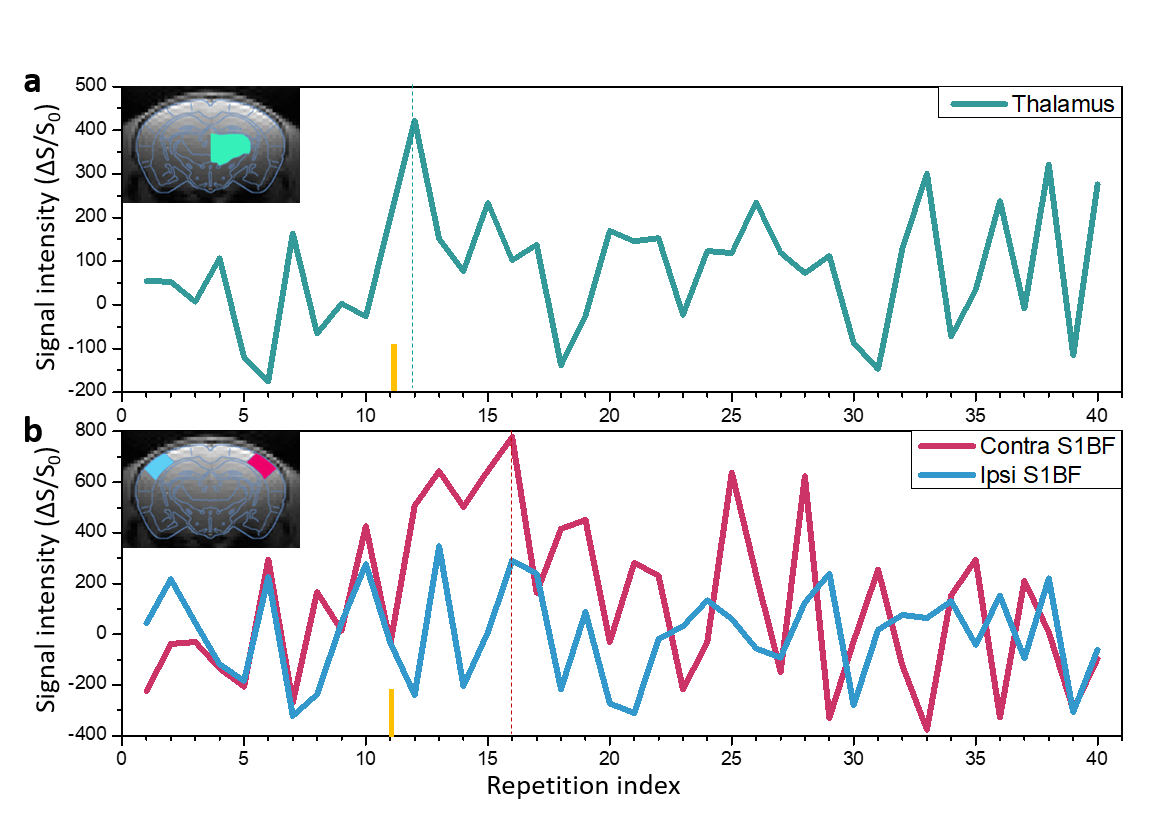
Figure 2 shows that LS-FLASH showed a similar performance to conventional FLASH in terms of SNR and tSNR, implying that a line-scan acquisition strategy does not affect the performance of the original FLASH imaging technique with which the line scan method is combined.Figure 3 shows the time series of LS-FLASH taken from the ROIs16, i.e., thalamus (Fig.3a) and contra/ipsi-S1BF (Fig.3b). The DIANA responses on thalamus and S1BF occurred ~10 ms and ~20 - 25 ms after the stimulation, respectively, confirming that the response on thalamus appears first and then is projected onto S1BF. The response delay of ~10 - 15 ms between thalamus and S1BF is consistent with the previous whisker studies17–21.
Figure 5 shows the DIANA response maps obtained by averaging the time series (Fig.5b) and applying a time window with a 10-ms width (Fig.5c) after the stimulation, along with the BOLD response map for comparison purpose (Fig.5a). In the first 5 time-resolved images in Figure 5c, strong activations were clearly seen in the contra/ipsi-S1BF and thalamus, which agreed with the time-series data from these areas in Figure 2. Unlike the BOLD response, the DIANA response on the ipsi-S1BF was very weak, which might be accidental because even the BOLD response might not always appear on the ipsi-S1BF. Interpretation of the activations occurring in the same regions after 6th time-resolved images are still remained and warranted for further investigation.
Conclusion
In this study, we showed that direct imaging of neuronal activity (DIANA) was feasible for the in vivo mouse brain using the line-scan-based FLASH (LS-FLASH) method with a 5-ms temporal resolution. The DIANA responses were clearly observed in thalamus and S1BF when electrical stimulation was applied to the left whisker area. Thanks to the very high temporal resolution of 5 ms, the time delay of the responses between thalamus and S1BF was also observed (~10 – 15 ms). Although further studies are needed for elucidating the underlying contrast mechanism and exploring an appropriate DIANA response model, the DIANA contrast is expected to be a great candidate for a novel fMRI that can detect neuronal activity directly with a high spatial and temporal resolution.Acknowledgements
This work was supported by the National Research Foundation of Korea, NRF-2019M3C7A1031993.References
1. Kamei, H., Iramina, K., Yoshikawa, K. & Ueno, S. Neuronal current distribution imaging using magnetic resonance. IEEE Trans. Magn. 35, 4109–4111 (1999).
2. Chow, L. S., Cook, G. G., Whitby, E. & Paley, M. N. J. Investigating direct detection of axon firing in the adult human optic nerve using MRI. NeuroImage 30, 835–846 (2006).
3. Park, T. S., Lee, S. Y., Park, J.-H., Cho, M. H. & Lee, S. Y. Observation of the fast response of a magnetic resonance signal to neuronal activity: a snail ganglia study. Physiol. Meas. 27, 181 (2006).
4. Petridou, N. et al. Direct magnetic resonance detection of neuronal electrical activity. Proc. Natl. Acad. Sci. 103, 16015–16020 (2006).
5. Singh, M. Sensitivity of MR phase shift to detect evoked neuromagnetic fields inside the head. in IEEE Conference on Nuclear Science Symposium and Medical Imaging 1286–1288 vol.2 (1992). doi:10.1109/NSSMIC.1992.301512.
6. Chu, R. et al. Hunting for neuronal currents: absence of rapid MRI signal changes during visual-evoked response. NeuroImage 23, 1059–1067 (2004).
7. Parkes, L. M., Lange, F. P. de, Fries, P., Toni, I. & Norris, D. G. Inability to directly detect magnetic field changes associated with neuronal activity. Magn. Reson. Med. 57, 411–416 (2007).
8. Tang, L., Avison, M. J., Gatenby, J. C. & Gore, J. C. Failure to direct detect magnetic field dephasing corresponding to ERP generation. Magn. Reson. Imaging 26, 484–489 (2008).
9. Luo, Q. et al. Physiologically evoked neuronal current MRI in a bloodless turtle brain: Detectable or not? NeuroImage 47, 1268–1276 (2009).
10. Lee, J. A Novel Method for Direct Detection and Spatial Mapping of Neuronal Activity. ISMRM (2018).
11. Phan, T. T. Progress towards direct in-vivo detection and mapping of neuronal activity. ISMRM (2019).
12. Yu, X., Qian, C., Chen, D., Dodd, S. J. & Koretsky, A. P. Deciphering laminar-specific neural inputs with line-scanning fMRI. Nat. Methods 11, 55–58 (2014).
13. Jung, W. B., Shim, H.-J. & Kim, S.-G. Mouse BOLD fMRI at ultrahigh field detects somatosensory networks including thalamic nuclei. NeuroImage 195, 203–214 (2019).
14. Shim, H.-J. et al. Mouse fMRI under ketamine and xylazine anesthesia: Robust contralateral somatosensory cortex activation in response to forepaw stimulation. NeuroImage 177, 30–44 (2018).
15. Cox, R. W. AFNI: Software for Analysis and Visualization of Functional Magnetic Resonance Neuroimages. Comput. Biomed. Res. 29, 162–173 (1996).
16. Lein, E. S. et al. Genome-wide atlas of gene expression in the adult mouse brain. Nature 445, 168–176 (2007).
17. Sato, T. R. & Svoboda, K. The Functional Properties of Barrel Cortex Neurons Projecting to the Primary Motor Cortex. J. Neurosci. 30, 4256–4260 (2010).
18. Parabucki, A. & Lampl, I. Volume Conduction Coupling of Whisker-Evoked Cortical LFP in the Mouse Olfactory Bulb. Cell Rep. 21, 919–925 (2017).
19. Mease, R. A., Metz, M. & Groh, A. Cortical Sensory Responses Are Enhanced by the Higher-Order Thalamus. Cell Rep. 14, 208–215 (2016).
20. Troncoso, E. et al. Recovery of Evoked Potentials, Metabolic Activity and Behavior in a Mouse Model of Somatosensory Cortex Lesion: Role of the Neural Cell Adhesion Molecule (NCAM). Cereb. Cortex 14, 332–341 (2004).
21. Sachdev, R. N. S., Krause, M. R. & Mazer, J. A. Surround suppression and sparse coding in visual and barrel cortices. Front. Neural Circuits 6, (2012).
Figures