3816
Disentangling hippocampal perfusion from the macrovasculature using ASL and TOF at 7T
Roy AM Haast1, Sriranga Kashyap2, Jordan DeKraker1, Dimo Ivanov2, Benedikt A Poser2, and Ali R Khan1,3
1Robarts Research Institute, Western University, London, ON, Canada, 2Department of Cognitive Neuroscience, Maastricht University, Maastricht, Netherlands, 3Department of Medical Biophysics, Schulich School of Medicine and Dentistry, Western University, London, ON, Canada
1Robarts Research Institute, Western University, London, ON, Canada, 2Department of Cognitive Neuroscience, Maastricht University, Maastricht, Netherlands, 3Department of Medical Biophysics, Schulich School of Medicine and Dentistry, Western University, London, ON, Canada
Synopsis
Arterial spin labeling (ASL) at 7T can be used to map cerebral blood flow (CBF) at a high spatial resolution. Previously, we have shown that different hippocampal subfields have differences in perfusion, owing to potential differences in their vascular density. Hippocampal imaging at 7T can be challenging and requires optimizations of acquisition methods, as well as integration of novel analysis strategies. Here, we map high-resolution quantitative multi-modal MRI data (T1, CBF, time-of-flight angiography) in the human hippocampus to disentangle perfusion and macrovasculature at 7T.
Introduction
Arterial spin labeling (ASL) is the primary non-invasive MRI approach to measure baseline cerebral blood flow (CBF) in healthy subjects and patients. By combining novel acquisition methods, high-quality whole-brain, sub-millimeter (0.7 mm3) isotropic resolution CBF mapping using ASL has been demonstrated using 7T MRI[1] and shown to be useful for differentiation of the hippocampal subfields (hSFs) based on differences in perfusion and, therefore, in their vascular densities[2]. However, due to the small size and highly convoluted shape of the hippocampus, its CBF map and observed differences across hSFs are increasingly prone to biases induced by its surrounding macrovasculature[3]. Here, we aim to assess the magnitude of this potential macrovasculature-related bias in hippocampal perfusion by combining 1.5 mm2 ASL data with macrovasculature reconstruction, based on high resolution 0.47 mm2 time-of-flight (TOF) data.Methods
Acquisition: All data were acquired on a whole-body 7T Magnetom MRI scanner (Siemens Healthineers) with a 32-channel head-coil (Nova Medical) on two male subjects. For both subjects, a 2D-EPI ASL and FAIR QUIPSSII labeling scheme was used to acquire perfusion weighted data[4] with TR/TE/TI1/TI2=2861/14/700/1800 ms, Nslices=32, echo spacing=69 ms, PF=6/8, GRAPPA=3 (using FLEET[5] for Nreflines=48), Nvols=100 (tag-control interleaved), TA=4:49 min/run and five runs minimum. For readout distortion-correction and perfusion quantification, five volumes each of opposite phase-encoded data and with M0-weighting, i.e., with no magnetization preparation and TR increased to 20 s were acquired. 3D-TOF data were acquired using five slabs of 44 slices, TR/TE= 15/3.59 ms, PF=6/8, GRAPPA=3, Nreflines=24, and TA=5:50 min. In addition, MP2RAGE and Sa2RAGE data were obtained as in Haast et al. 2018[6], for anatomical reference, hippocampal segmentation and T1 quantification. Dielectric pads were used to improve labeling efficiency and B1 in the medial temporal lobes.Analysis: To quantify CBF, the M0 and all ASL runs were motion-corrected using SPM12 followed by distortion-correction using FSL-TOPUP. All distortion-corrected ASL runs were temporally concatenated and a perfusion-weighted volume was computed by averaging across the alternating tag-control difference images. A quantitative CBF map was then computed using the PASL model[7]. Data were coregistered and resampled onto the anatomical space using ANTs (Figure 1)[8]. For hippocampal analyses, the hippocampus was manually segmented in ITK-SNAP[9] using upsampled (0.3 mm3) MP2RAGE data. The hippocampal macrovasculature was then reconstructed by filtering the TOF angiography data for vessel-like structures near the hippocampal boundaries using an existing workflow (see Figure 2A)[10]. Distance to closest vessel and corresponding vessel diameter were calculated across voxels within the hippocampal gray matter (hGM, Figure 2B-C). ANTs registration was used to align the angiography data to the MP2RAGE. Finally, for comparison across hSFs and visualization purposes, the T1, CBF and macrovasculature-based maps were unfolded and projected onto the hippocampus using an in-house developed coordinate system[11].
Results
Quantitative T1 maps (A), TOF maximum intensity projection in the sagittal direction (B) and CBF maps (C) are displayed in Figure 1. Only right hemispheres were included in subsequent analyses. Average T1 (Sa2RAGE corrected) within hGM, was estimated at 1840±255 ms, and CBF at 24.91±14.27 ml/100g/min. The internal carotid artery was identified together with its branches, as well as major hippocampal arteries, particularly the posterior cerebral artery running along the hippocampus towards the tail and the anterior choroidal artery on top of the hippocampus using the 3D reconstruction of the TOF data (Figure 2A). Here, the average diameter of the segmented vasculature ranged from 0.60–4.57 mm (Figure 2C), within a distance of 0.30–14.29 mm from the hGM (Figure 2B).Unfolding the data allows us to study variations in (1) across subfields and (2) along the longitudinal direction in hGM T1 (msec), CBF (ml/100g/min) and distance (mm, Figure 3) in a unified coordinate system, allowing precise comparisons across subjects. While T1 (Figure 3A) and distance (Figure 3C) maps are comparable across subjects (rows), with the exception of the increased T1 in the subiculum's (Sub) middle section of Subject 1, due to partial voluming with CSF, CBF maps (Figure 3B) appear more variable. On average, as shown in Figure 4A, hGM T1 seems to be slightly higher in CA1, while perfusion tend to gradually increase towards the dentate gyrus (DG). Although both subjects seems to be characterized by penetrating arteries within the head in CA1, smaller distances are observed towards the head, overall. Also, T1 (Figure 5A) tends to be higher, and CBF (Figure 5B) more variable for hippocampal GM voxels near the segmented vasculature. Finally, measured perfusion tSNR is relatively higher for voxels within the smaller vessels.
Discussion
Current work used a novel approach, combining multi-subject and multi-parametric data into a common analysis space, to study the relation between hGM perfusion and T1, and its macrovasculature. Although validation across more subjects is necessary, the current subjects' hippocampal macrovasculature seemed relatively comparable based on their 3D segmentations and unfolded distance maps, and tends to increase T1 in voxels nearby. In contrast, perfusion patterns were more variable across subjects, potentially originating from the intrahippocampal arteries. As such, additional analyses, e.g., by mapping hGM TOF intensities, may be beneficial considering (1) the observed higher perfusion tSNR within the smaller arteries, and that (2) the intrahippocampal arteries (~0.09 mm)[3] remained resolvable given the spatial resolution of the current TOF data.Acknowledgements
The author Roy AM Haast is supported by the BrainsCAN postdoctoral fellowship for this work. This research is enabled in part by support provided by Compute Canada (www.computecanada.ca).References
[1] Ivanov et al. (2018) Proc. Intl. Soc. Mag. Reson. Med. 26 p. 2301. [2] Haast et al. (2019). Proc. Intl. Soc. Mag. Reson. Med. 27 p. 3131. [3] Spallazi et al. (2018) Neuroimage Clin. 21:101609. [4] Ivanov et al. (2017) Magn Reson Med. Jul;78(1):121-129. [5] Polimeni et al. (2016) Magn Reson Med. Feb;75(2):665-79. [6] Haast et al. (2018) Hum Brain Mapp. (6):2412-2425. [7] Alsop et al. (2015) Magn Reson Med. Jan;73(1):102-16. [8] Avants et al. (2011) Neuroimage. Feb 1;54(3):2033-44. [9] Yushkevich et al. (2006) Neuroimage. Jul 1;31(3):1116-28. [10] Bernier et al. (2018) Hum Brain Mapp. Dec;39(12):4962-4975. [11] DeKraker et al. (2018) Neuroimage. Feb 15;167:408-418.Figures
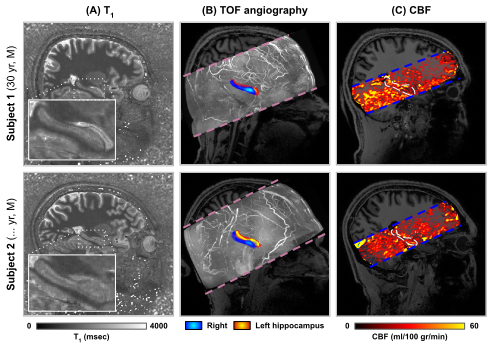
Figure 1 – Sagittal cross-sections showing quantitative T1 (A, msec), TOF angiography (B, maximum intensity projection) and CBF (ml/100 g/min) data for both subjects (rows). Inset figures in A show hippocampal T1, while the blue and red heat maps in B indicate the locations of the right and left hippocampus, respectively. White outlines in C indicates the position of the right hippocampus in the CBF maps.
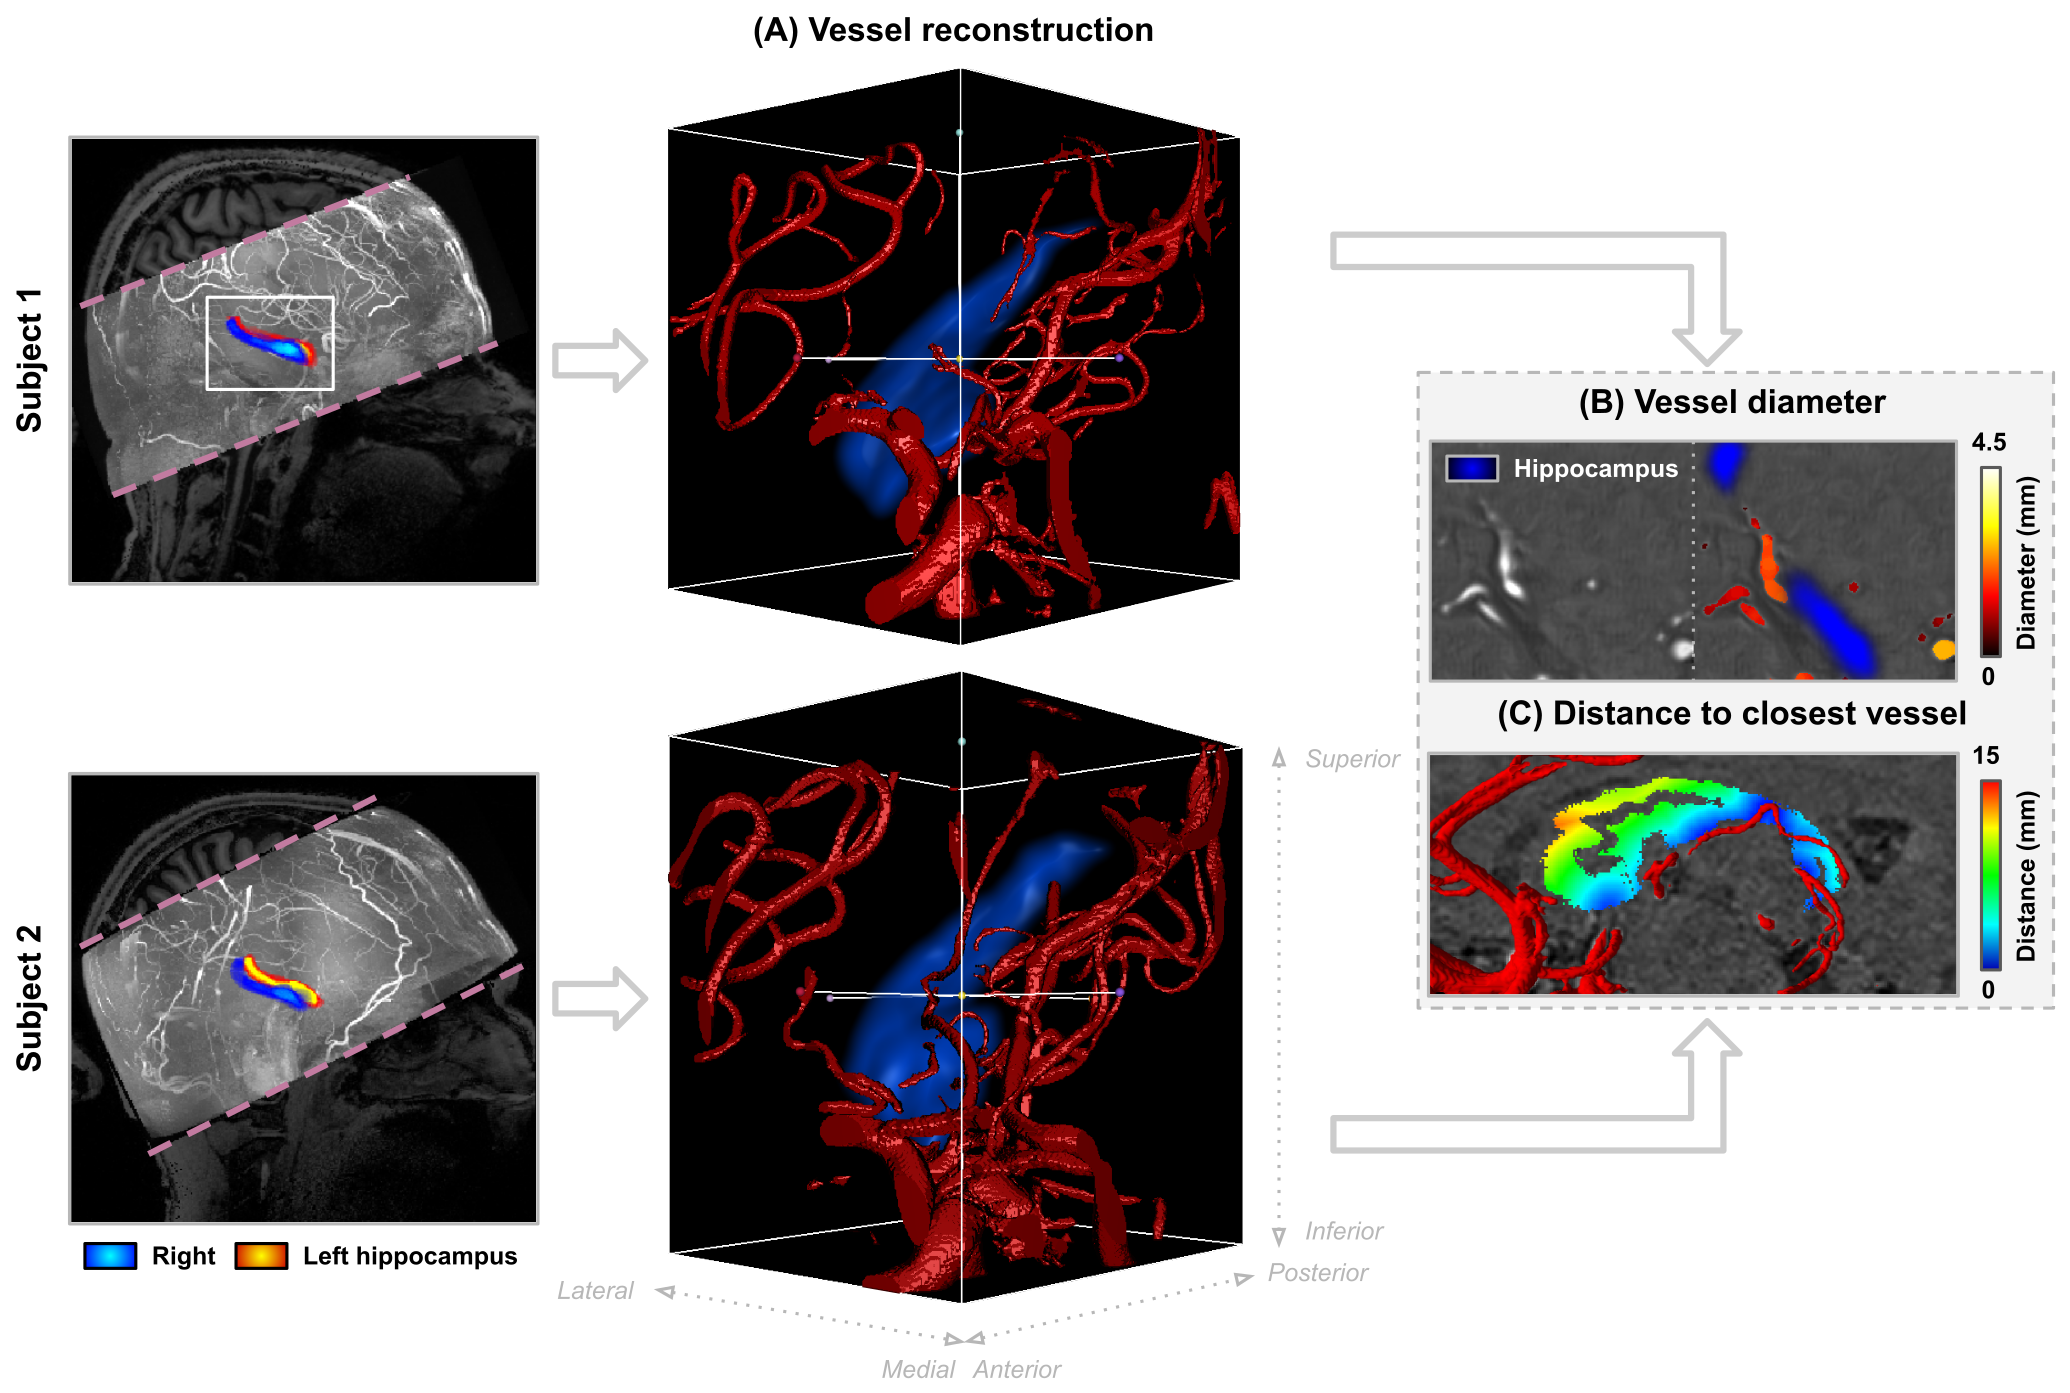
Figure 2 – Reconstructions of arteries based on the TOF data. For each subject, we segmented the arteries (red) near the hippocampus (in blue) in 3D as shown in (A). These 3D segmentations were used to extract vessel diameters (B, mm), as well as the distance to the nearest artery (mm) within the hippocampal gray matter mask (C).
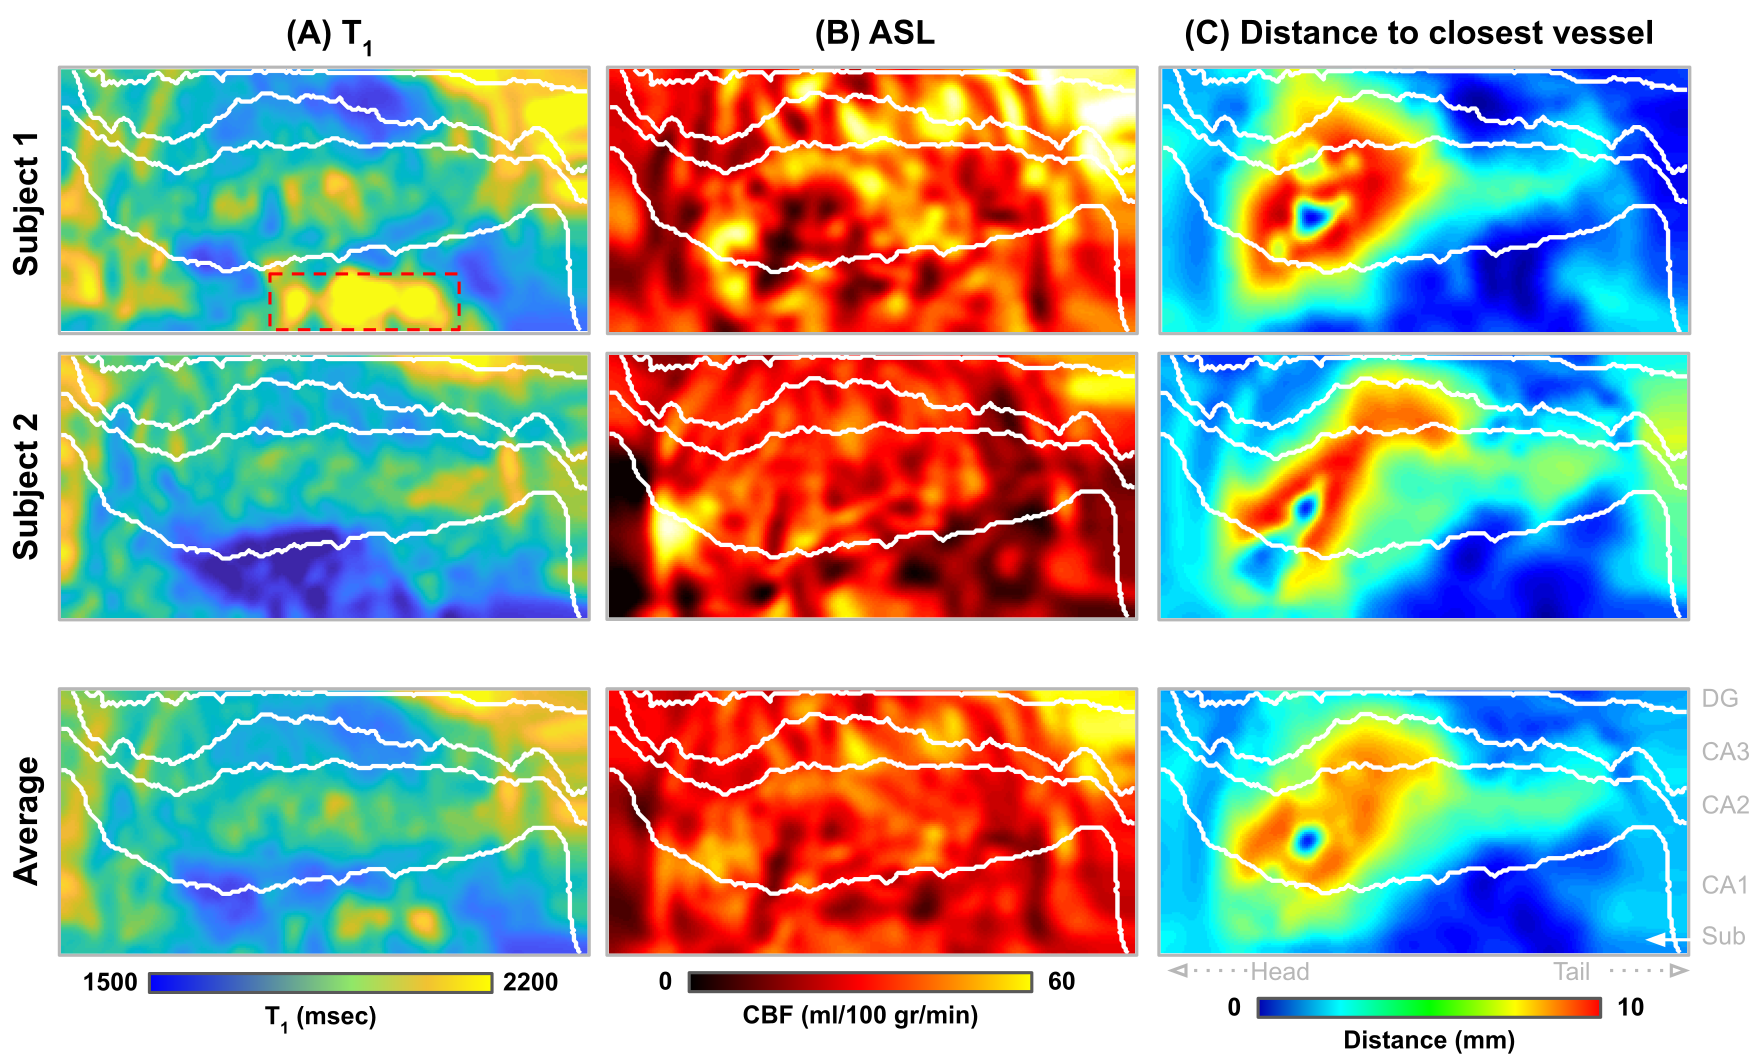
Figure 3 – Subject-specific and averaged (bottom row) unfolded hippocampal T1 (A, mesc), CBF (B, ml/100 g/min) and distance (C, mm) maps. Hippocampal subfields (subiculum [Sub], CA1-3 and dentate gyrus [DG]) are delineated using white solid lines. Note that the high T1 values inside red box of subject 1 (top left figure) are due strong partial voluming effects of neighboring CSF.
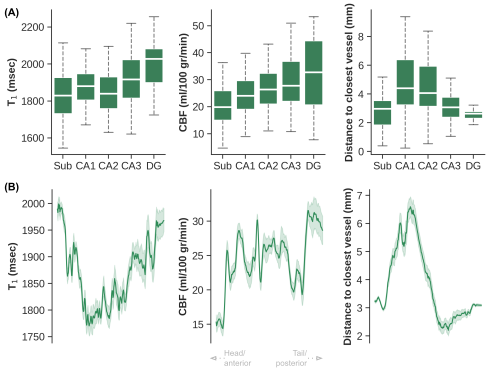
Figure 4 – Average T1 (msec), CBF (ml/100 g/min) and distances (mm) across hippocampal subfields (A), as well as a function of location along the longitudinal axis (i.e., anterior/head vs. posterior/tail, B).
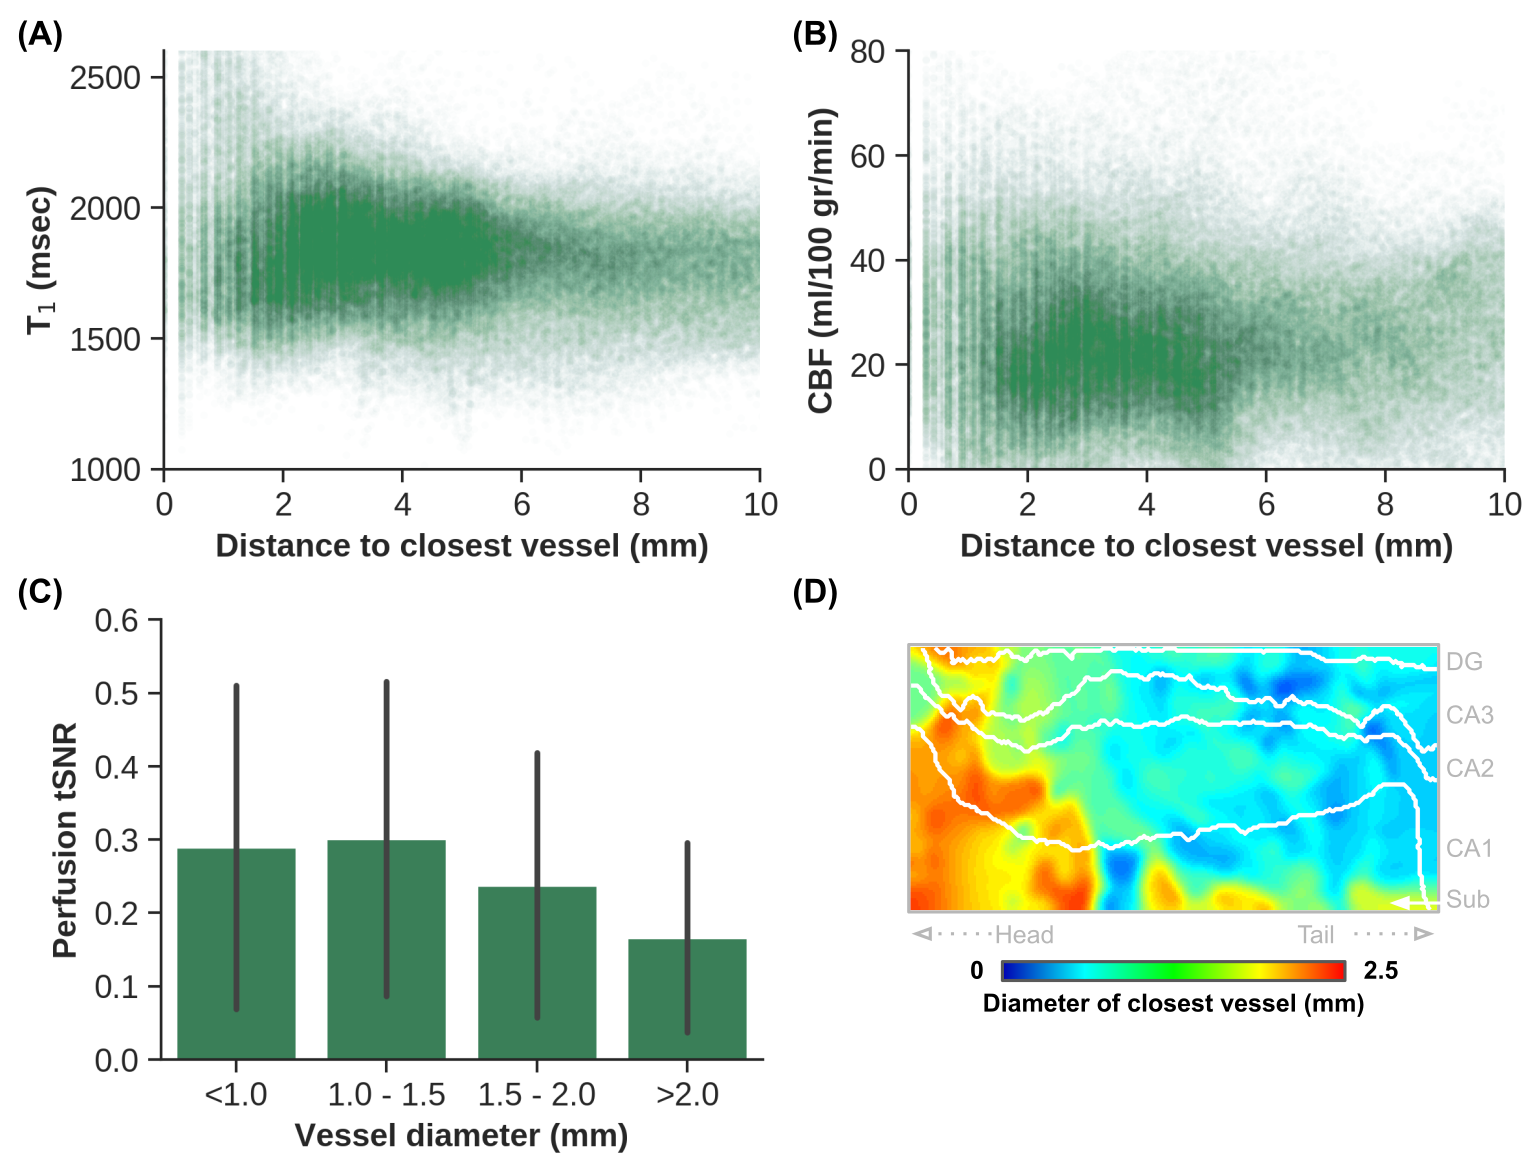
Figure 5 – Voxel-wise scatter plot with distance (mm) on the x-axes and T1 (msec, A) and CBF (ml/100 g/min, B) on the y-axes, as well as a bar plot (± S.D.) showing the perfusion tSNR for different vessel sizes (mm, C). Flat map in D shows the subjects’ average diameter (mm) of the closest vessel near the hippocampus.