3815
Effect of the perfusion lag structure removal on task fMRI1Laboratory for Brain Connectomics Imaging, RIKEN Center for Biosystems Dynamics Research, Kobe, Japan
Synopsis
A lag structure in the fMRI signal, created by a combination of the low-frequency oscillation and perfusion delay, has been suggested as being a noise component, but its removal has not been established as a denoising approach. Using an HCP task-fMRI dataset, we report that the removal of this lag structure, or deperfusioning, has a unique effect on fMRI group analysis both qualitatively and quantitatively. Increased sensitivity of the treatment in some condition was emphasized by switching from volume- to surface-based analysis, suggesting concomitant improvement of specificity. Unfavorable effect was also suggested depending on the task condition, warranting further investigation.
Introduction
Tracking the low-frequency phase in BOLD signal has been shown to provide clinically useful MRI markers for cerebral perfusion, supposedly based on the spontaneous low-frequency oscillation (sLFO) [1]. We have recently proposed that this oscillation may partly originate from an axial deoxy-hemoglobin fluctuation in the vessels that effectively behaves as a contrast agent [2]. The broad range of perfusion timing, from artery to vein, observed by the lag-tracking technique has empirically supported this model [3]-[5]. Motivated by the rich vascular information indicating non-neuronal origin of the lag structure, removal of this global component from fMRI signals -- “deperfusioning” -- was proposed as one of denoising approaches, but is yet to be established [6], [7]. Here we report the first evaluation of this deperfusioning procedure on a publicly available high-quality task fMRI dataset.Methods
Motor task fMRI datasets of 30 participants in the Human Connectome Project database were used (http://protocols.humanconnectome.org/HCP/3T/task-fMRI-protocol-details.html). This sample size was chosen to replicate a common practice of fMRI with a modest statistical power. The motor task was chosen because of the well-established activation sites.Image processing
Fixed-seed lag mapping (up to +/- 6 s after low-pass filtering at 1/12 Hz) was performed on each participant’s dataset after concatenating two runs [7]. In this procedure, the sLFO was first determined by pooling the timeseries from a set of voxels that have precisely the same low-frequency phase with the global signal. Other voxels were then assigned lag values by the cross-correlogram peak with this sLFO (seed).
Based on this individual lag structure, two types of deperfusioning were performed. One is a standard deperfusioning which involved regressing out the seed with corresponding time shift at each voxel, meaning that the removed time course profile was kept constant. For the other type, an aggressive deperfusioning, the voxels with the same phase were first pooled to create the average timeseries that was then regressed out from every voxel in the set. This procedure was considered as aggressive because, while the seed timeseries was predetermined and originally used to select the voxels, this directly pooled timeseries may contain local signal components such as neurovascular coupling. Although the lag mapping procedure involved smoothing and filtering, the deperfusioning did not affect the high-frequency components in the raw data.
In each individual data, first-level analysis was performed for each phase-encoding direction using the FEAT setting provided by HCP. After combining these two, voxel-wise one-sample t testing was done over the 30 participants to create a group activation map in volume. For the surface-based statistics, the individual statistical images were mapped to each midthickness cortical surface (MSMAll) and fed into the group analysis. Both volume- and surface-based group analyses were done using permutation testing as implemented in PALM/FSL [8].
For the detailed evaluation of the group activation, the analysis was limited only in the activation clusters from the raw data at a height threshold of p<0.05, FWE-corrected. No cluster-based inference was used.
The code for lag mapping is available at [9].
Results and Discussion
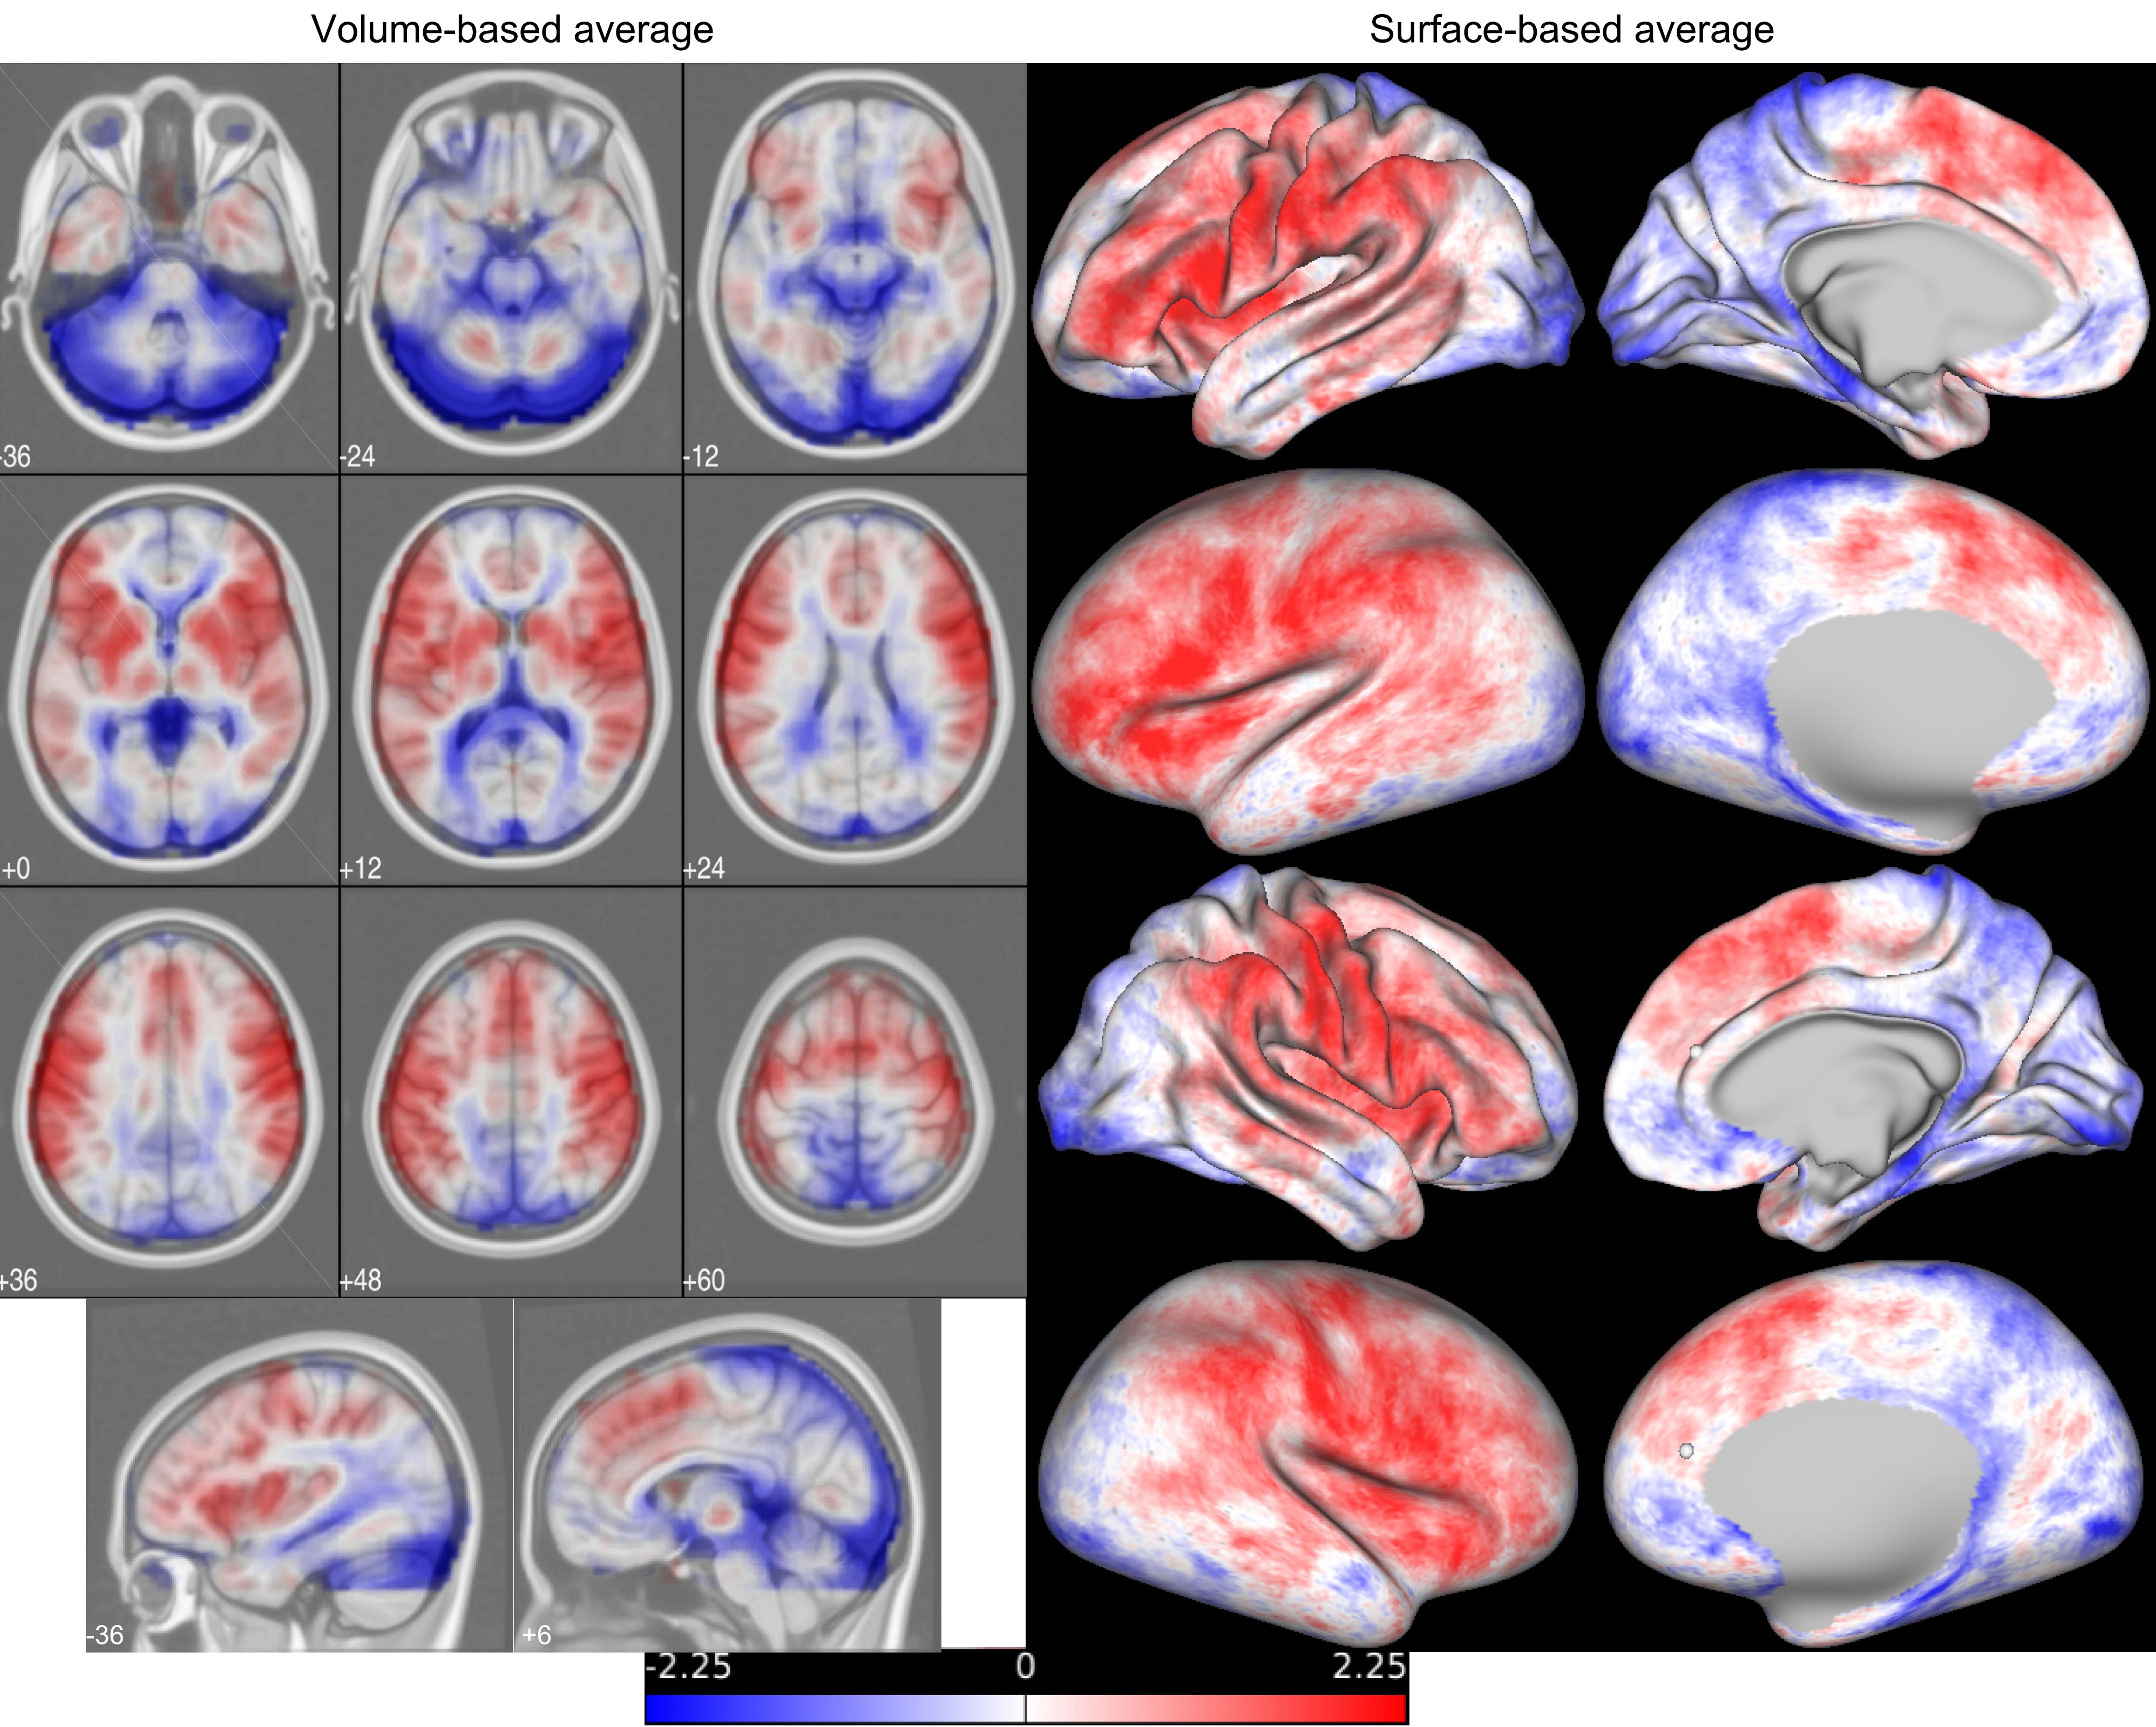
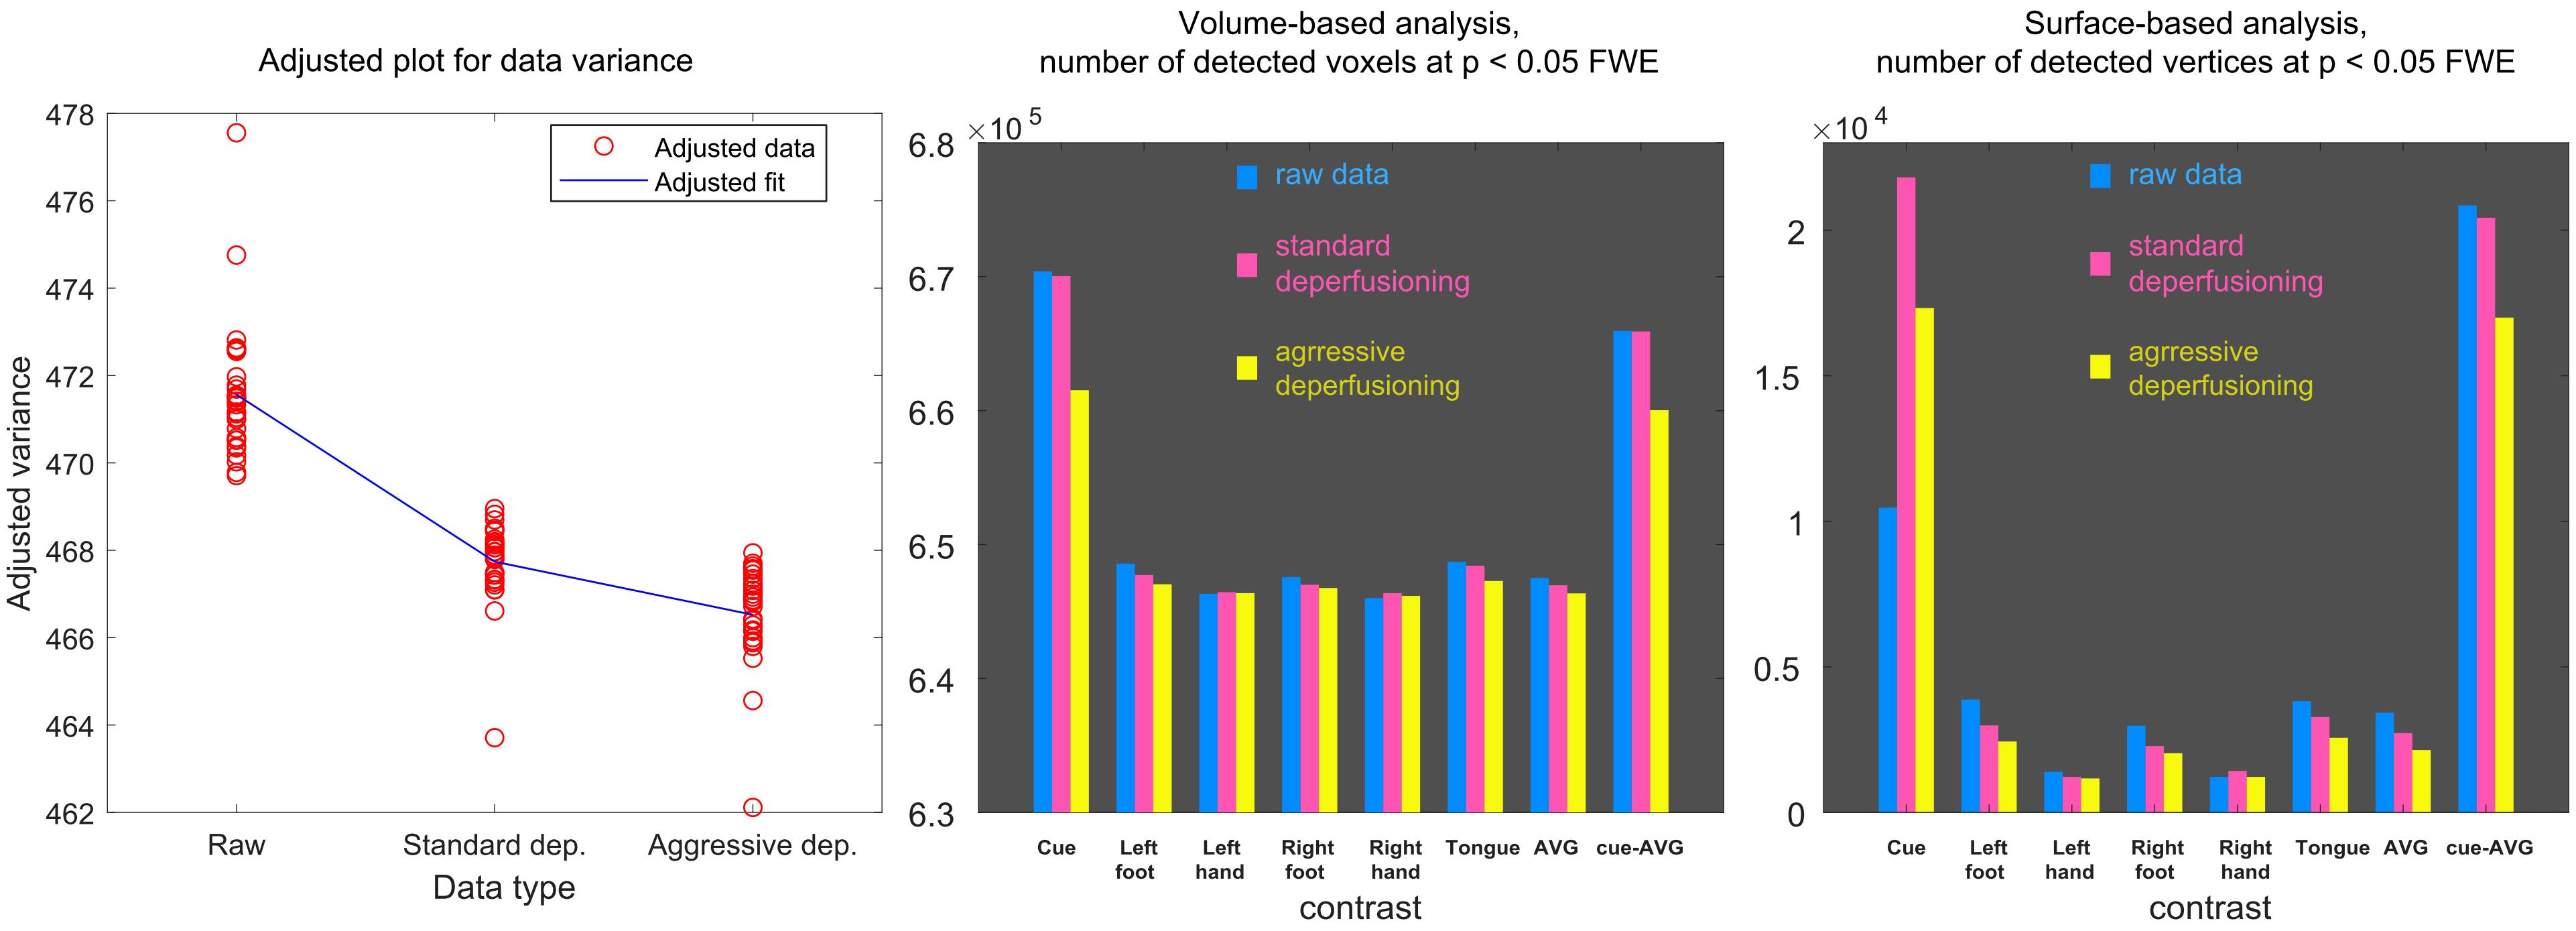
Figure 1 shows the average lag map. The lag structure largely reflects the vascular anatomy suggesting contamination of vascular components in the raw data.By deperfusioning, there was clear diminishment of both data variance (Fig. 2, left) and the number of detected voxels (middle), however, more areas were detected for the Cue condition in surface-based analysis. The difference from the volume-based analysis suggests that deperfusioning selectively removed false-positives in the non-cortical voxels.
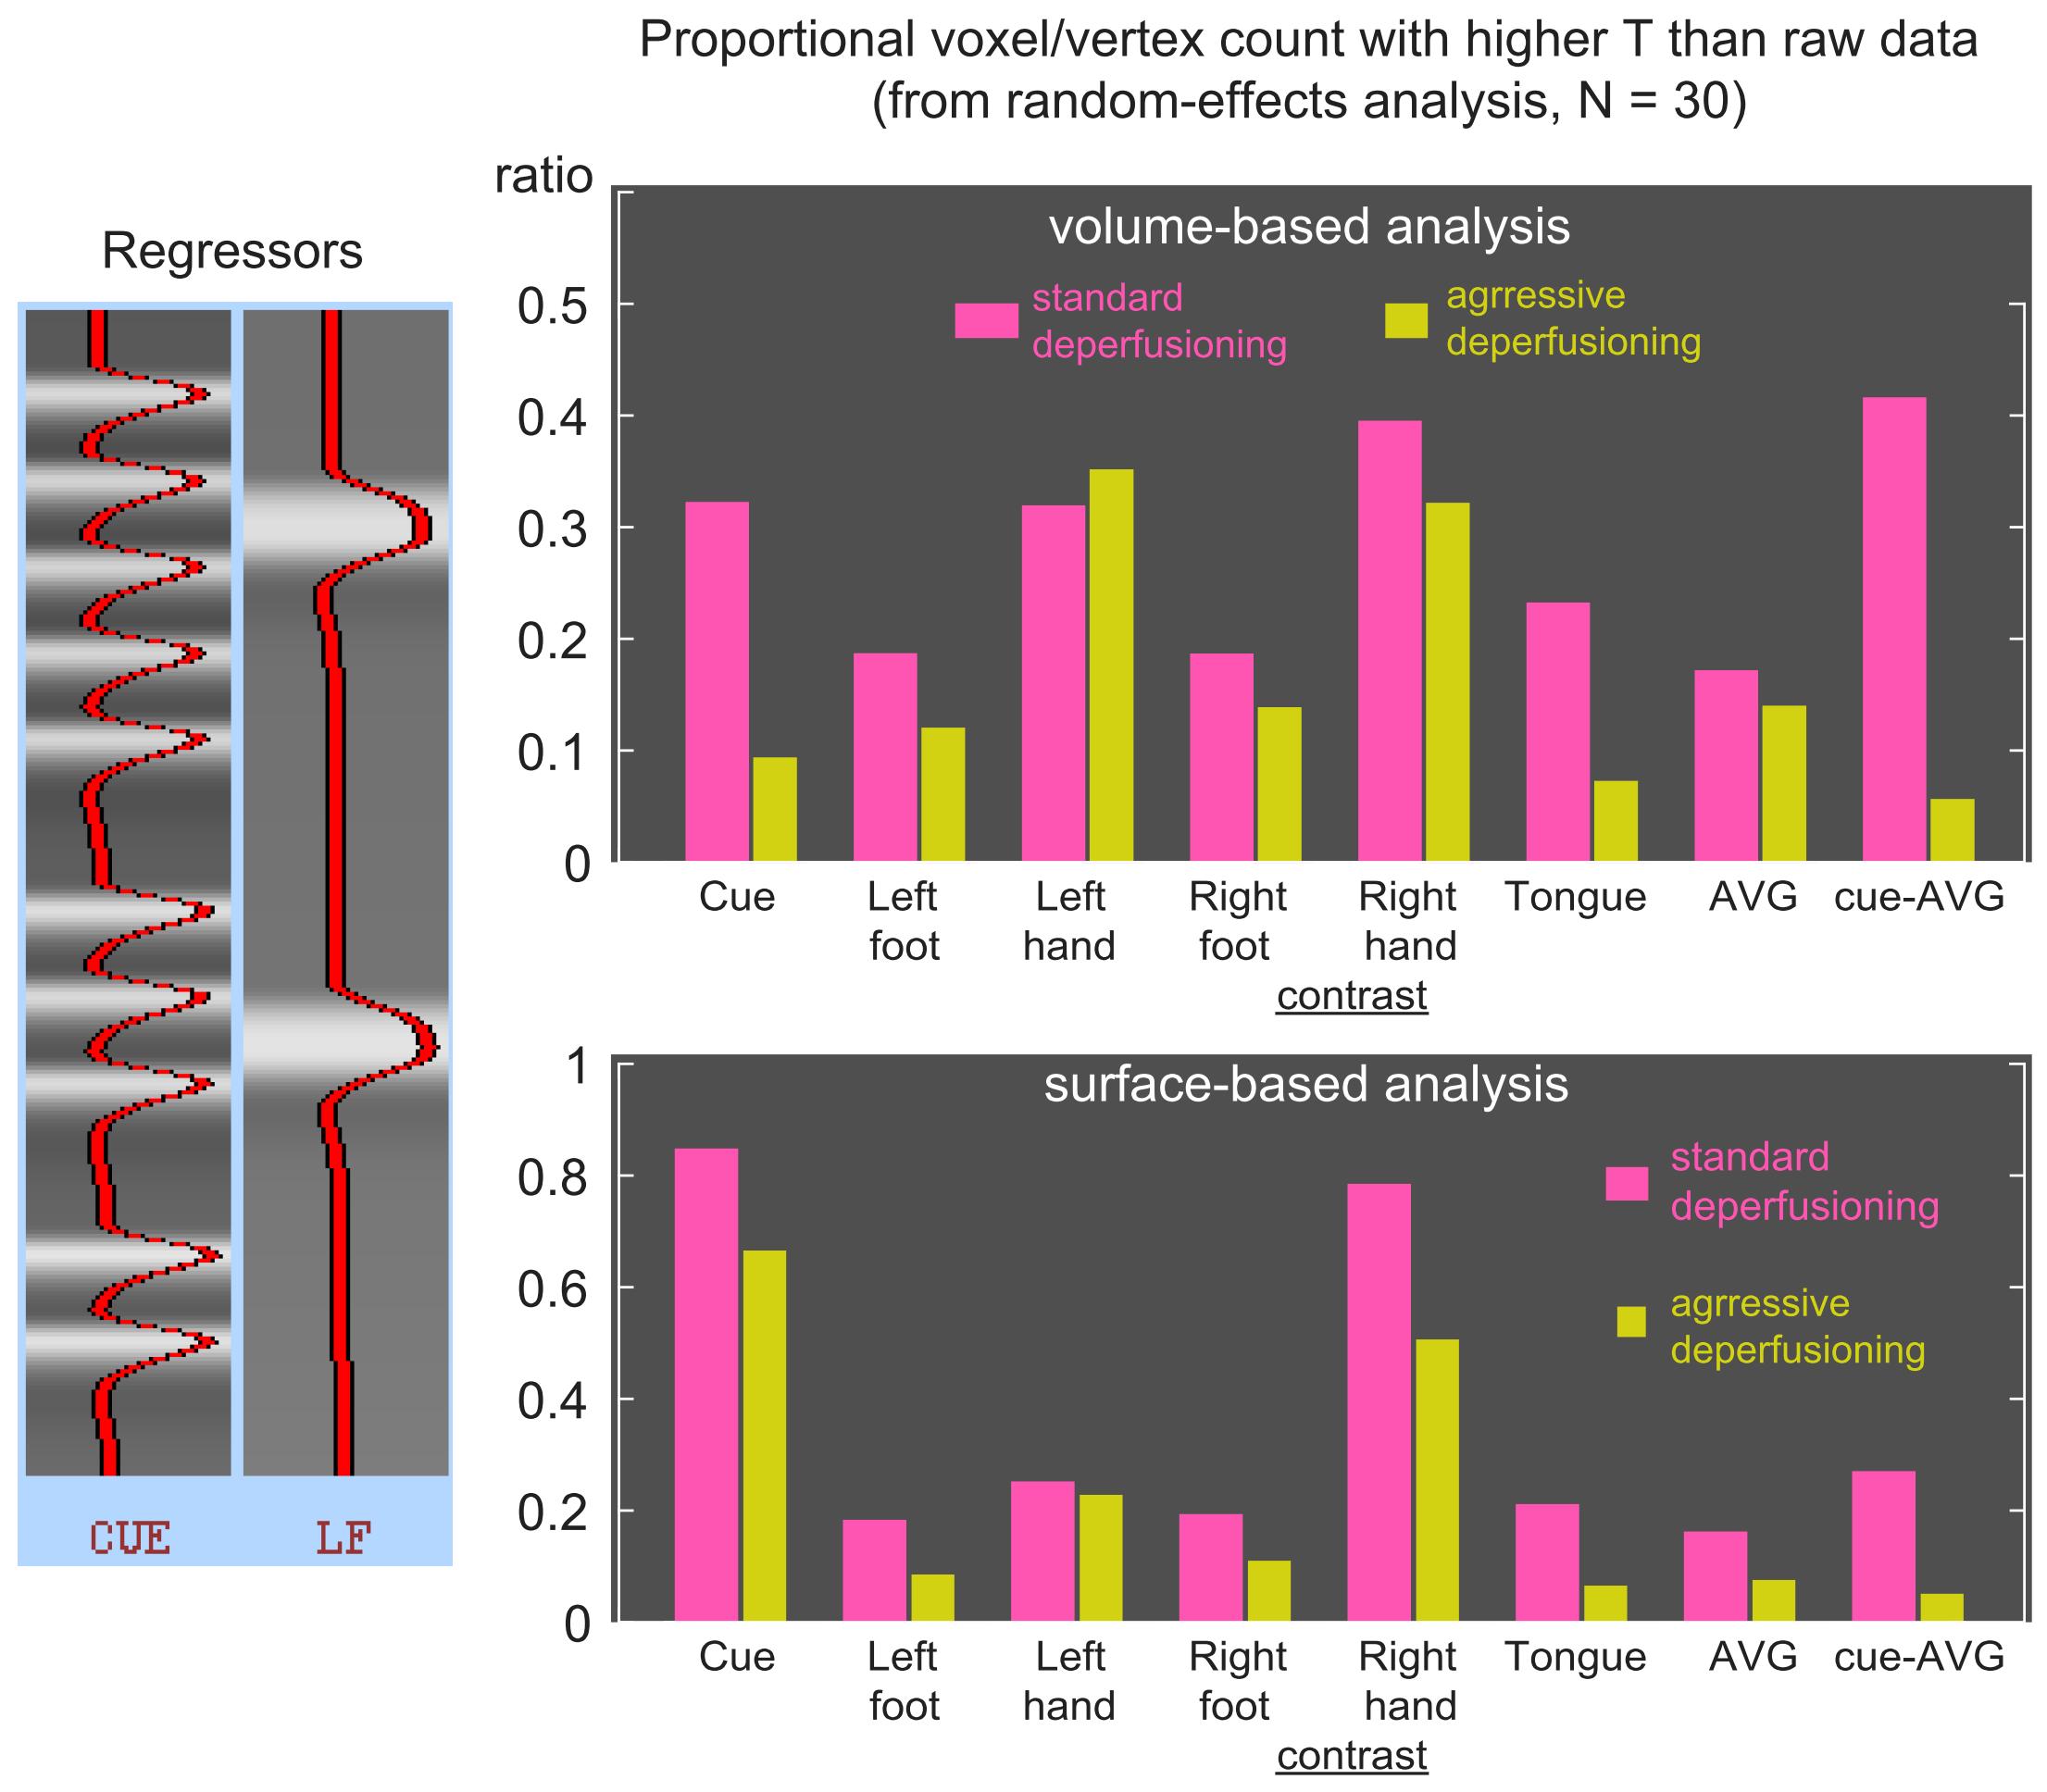
This possible favorable effect of deperfusioning in the Cue condition may be related to its higher temporal frequency (Fig. 3, left) that helps circumvent adverse effects of the low-frequency regression. Indeed, there was diminished sensitivity by the aggressive deperfusioning (right panels), therefore, only the standard deperfusioning will be evaluated hereafter. Combined with the surface-based analysis, again, positive effect of deperfusioning was prominent at least for the Cue and Right-hand movement responses, with enhancement in most activated vertices (> 75%).
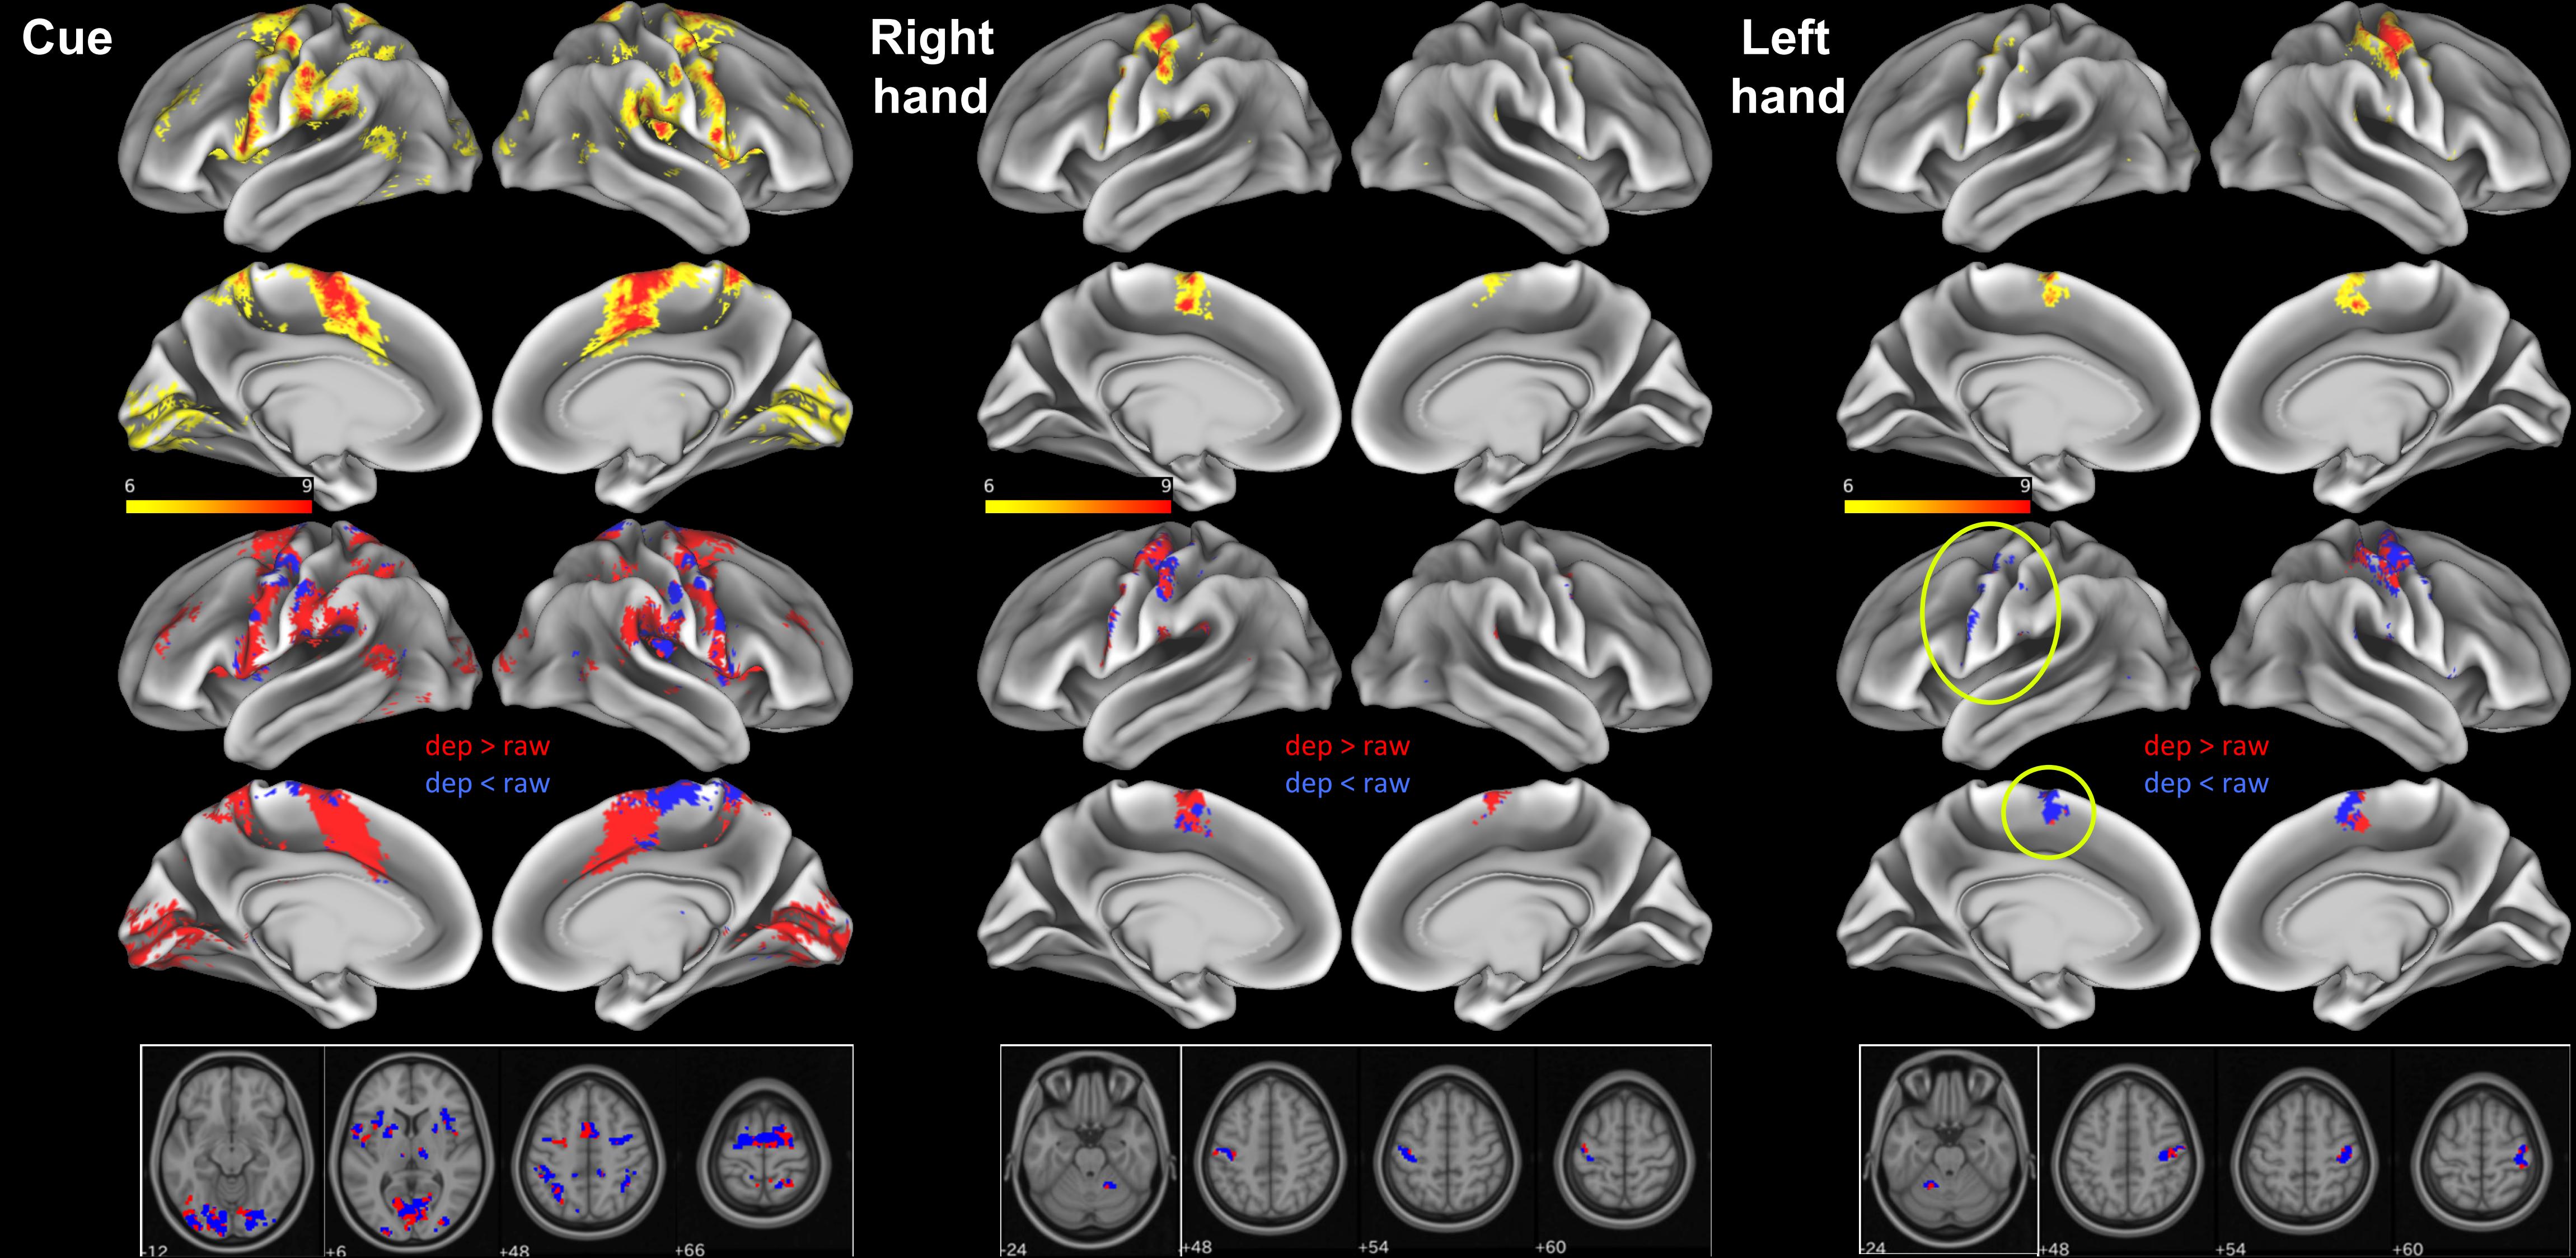
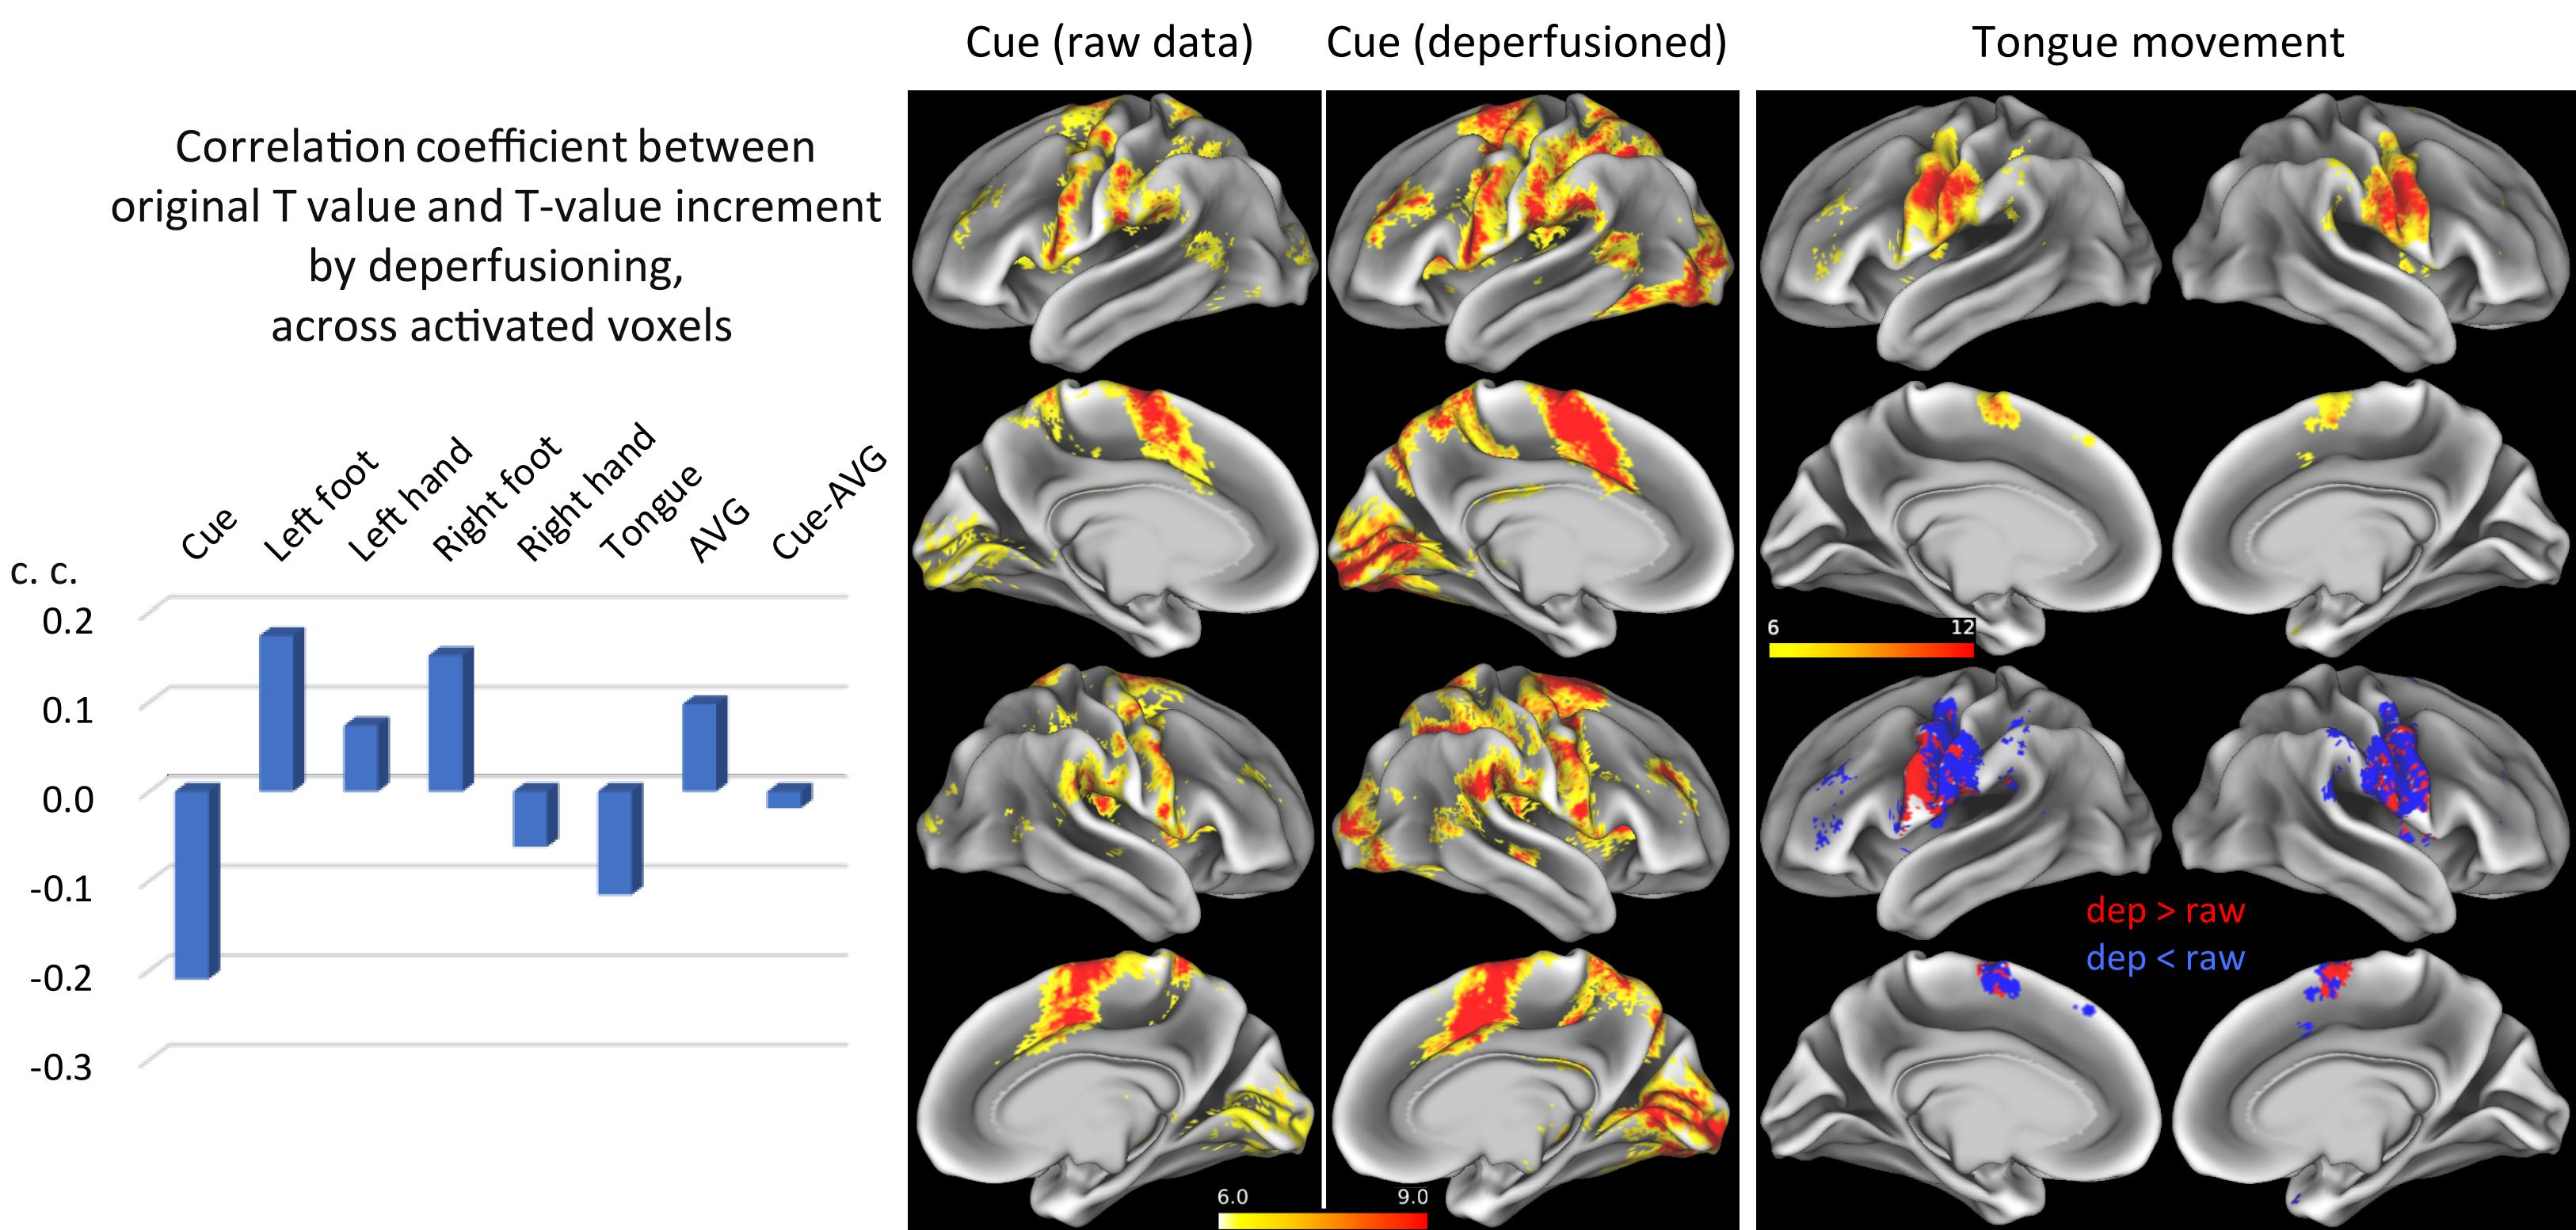
Results from selected contrasts are presented in Figure 4, top row. In the Cue and Right-hand contrasts, activated sites were dominated by those showing T-value increase by deperfusioning (red, middle row), compared to the volume-based version (bottom) presenting more blue voxels. Asymmetry in the Right and Left-had movement response was mainly found in the ipsilateral activation (yellow circles) which was less prominent in the right-hand condition.
Figure 5 presents an additional analysis for spatial distribution of activations. The correlation between the activation T map and the T increment was generally low, suggesting that the the effect of deperfusion procedure is independent from task-related activation.
Conclusion
Perfusion lag map was successfully created from the HCP task fMRI dataset. The differential effect of deperfusioning on volume- and surface-based statistics suggested not only a better sensitivity to task-induced neural activity but also improved specificity, at least for particular conditions. Unfavorable removal of neuronal component, which was enhanced by aggressive deperfusioning, may have occurred for the motor-related task components due to the slow blocked design. This false-positive effect has been predicted because the lag structure encompasses neural responses [7]. Removal of the lag structure affected the fMRI activation map in a unique way, warranting further investigation as an alternative denoising approach.Acknowledgements
The study was supported by Brain/MINDS-beyond from the Japan Agency for Medical Research and Development (AMED) (Grant Number JP19dm0307004) and Grants-in-Aid for Scientific Research (C) JP19K09480 from the Japan Society for the Promotion of Science.References
[1] Y. Tong and B. deB. Frederick, “Time lag dependent multimodal processing of concurrent fMRI and near-infrared spectroscopy (NIRS) data suggests a global circulatory origin for low-frequency oscillation signals in human brain,” NeuroImage, vol. 53, no. 2, pp. 553–564, Nov. 2010.
[2] T. Aso, S. Urayama, H. Fukuyama, and T. Murai, “Axial variation of deoxyhemoglobin density as a source of the low-frequency time lag structure in blood oxygenation level-dependent signals,” PLOS ONE, vol. 14, no. 9, p. e0222787, Sep. 2019.
[3] S. Nishida et al., “Resting-state Functional Magnetic Resonance Imaging Identifies Cerebrovascular Reactivity Impairment in Patients With Arterial Occlusive Diseases: A Pilot Study,” Neurosurgery, Sep. 2018.
[4] T. Satow et al., “Alteration of Venous Drainage Route in Idiopathic Normal Pressure Hydrocephalus and Normal Aging,” Front. Aging Neurosci., vol. 9, Nov. 2017.
[5] Y. Tong, K. P. Lindsey, L. M. Hocke, G. Vitaliano, D. Mintzopoulos, and B. deB Frederick, “Perfusion information extracted from resting state functional magnetic resonance imaging,” J. Cereb. Blood Flow Metab., vol. 37, no. 2, pp. 564–576, Feb. 2017.
[6] S. B. Erdoǧan, M. a. Yücel, and A. Akin, “Analysis of task-evoked systemic interference in fNIRS measurements: Insights from fMRI,” NeuroImage, vol. 87, pp. 490–504, 2014.
[7] T. Aso, G. Jiang, S. Urayama, and H. Fukuyama, “A resilient, non-neuronal source of the spatiotemporal lag structure detected by BOLD signal-based blood flow tracking.,” Front. Neurosci., vol. 11, p. 256, 2017.
[8] A. M. Winkler, G. R. Ridgway, M. A. Webster, S. M. Smith, and T. E. Nichols, “Permutation inference for the general linear model,” NeuroImage, vol. 92, pp. 381–397, May 2014.
[9] https://github.com/RIKEN-BCIL/BOLDLagMapping
Figures