3812
Evaluation of Native T1, Extracellular Volume, and apparent diffusion coefficient in Invasive Ductal Carcinoma1Department of Radiological technology, Ishikawa Prefectural Central Hospital, Kanazawa, Japan, 2Division of Health Sciences, Institute of Sciences, Kanazawa University, Kanazawa, Japan, 3Department of Radiology, Ishikawa Prefectural Central Hospital, Kanazawa, Japan
Synopsis
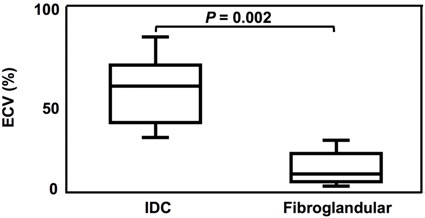
We evaluated native T1 and extracellular volume (ECV) of the breast using modified Look-Locker inversion recovery (MOLLI) sequence and compared those between invasive ductal carcinoma (IDC) and fibroglandular tissue. Moreover, we investigated the relationship between ECV and apparent diffusion coefficient (ADC) in IDC. Our results showed that ECV of IDC was significantly higher than fibroglandular tissue, whereas there was no significant difference in native T1 between both tissues. In addition, there was no significant correlation between ECV and ADC in IDC. ECV measurement using MOLLI may provide new and more detailed information in breast cancer.
INTRODUCTION
The diagnosis of breast cancer in MRI is mainly based on morphological evaluation and kinetic curve assessment.1 Dynamic contrast enhanced MRI is the most commonly used method to characterize breast cancer with high sensitivity. Moreover, previous studies have demonstrated diagnostic utility of quantitative assessment of breast cancer with apparent diffusion coefficient (ADC).2 As different approaches to quantitatively characterize biological tissues, T1-mapping and extracellular volume (ECV) measurement in cardiac MRI have been shown to have important prognostic significance in various cardiomyopathies.3,4 However, there is no report describing both T1 and ECV of breast cancer. Therefore, the purpose of this study was to evaluate native T1 and ECV in invasive ductal carcinoma (IDC) and fibroglandular tissue and investigate the relationship between ECV and ADC in IDC.MATELIALS AND METHODS
On 3T-MRI, breast T1 maps were acquired before and 10 minutes after Gd contrast agent administration using modified Look-Locker inversion recovery (MOLLI) sequence. The imaging parameters of MOLLI were set as follows: data acquisition, single-shot balanced SSFP; acquisition scheme and number of MOLLI images, 5s (3s) 3s and 16 for native T1 and 4s (1s) 3s (1s) 2s and 18 for enhanced T1; repetition time (TR), 3.0 msec; echo time (TE), 1.41 msec; flip angle, 20 degrees; section thickness, 3 mm; in-plane resolution, 1.97 x 2.00 mm; field of view (FOV), 150 mm; and sensitivity encoding (SENSE) factor, 2. Next, we determined native and enhanced T1 and ECV of IDC and fibroglandular tissue in 12 patients. In addition, breast ADC maps were obtained using single-shot diffusion echo-planar imaging with the following parameters: TR, 7468 msec; TE, 85 msec; section thickness, 4 mm; in-plane resolution, 2.86 x 2.93 mm; FOV, 320 x 160 mm; SENSE factor, 2; and b-value, 0, 800, and 1500 s/mm2. Then, we measured ADC of IDC and investigated the relationship between ECV and ADC in IDC.RESULTS AND DISCUSSION
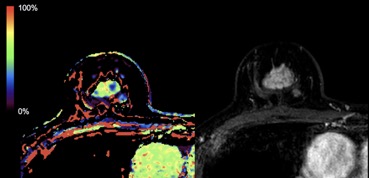
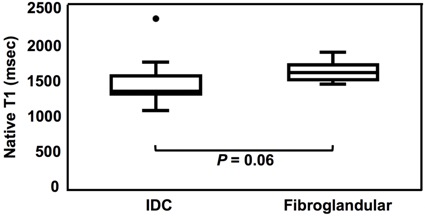
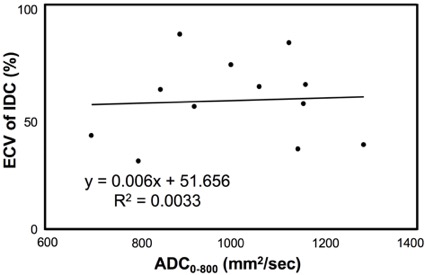
ECV was significantly higher in IDC than fibroglandular tissue (Figs. 1-2). However, there was no significant difference in native T1 between both tissues (Fig. 3). These results suggest that ECV can provide more detailed biological information in breast cancer than that provided by native T1 measurement. Furthermore, T1 value (1675.3 +/- 138.7 msec) of fibroglandular tissue was consistent with literature value (1680 +/- 180 msec)5, supporting the validity of MOLLI method as an accurate T1 mapping in breast tissue. On the other hand, there was no significant correlation between ECV and ADC in IDC (Fig. 4). This result suggests that ECV and ADC do not necessarily provide the same kind of information.CONCLUSION
ECV increases in IDC. ECV measurement using MOLLI may provide new and more detailed information in breast cancer.Acknowledgements
No acknowledgement found.References
1. ACR, BI-RADS, 2013. https://www.acr.org/Clinical-Resources/Breast-Imaging-Resources
2. Guo Y, Cai YQ, Cai ZL, et al., Differentiation of clinically benign and malignant breast lesions using diffusion-weighted imaging. J Magn Reson Imaging. 2002; 16(2): 172-178.
3. Messronghli DR, Walters K, Plein S, et al., Myocardial T1 mapping: application to patients with acute chronic myocardial infarction. Magn Reson Med. 2007; 58(1): 34-40.
4. Wong TC, Piehler KM, Kang IA, et al., Myocardial extracellular volume fraction quantified by cardiovascular magnetic resonance is increased in diabetes and associated with mortality and incident heart failure admission. Eur Heart J. 2014; 35(10): 657-664.
5. Edden RA, Smith SA, Barker PB, Longitudinal and multi-echo transverse relaxation times of normal breast tissue at 3 Tesla. J Magn Reson Imaging. 2010; 32(4): 982-987.
Figures