3809
CNNs improve tissue sodium concentration accuracy in white and grey matter from stroke patients at 3T 23Na MRI1Computer Assisted Clinical Medicine, Medical Faculty Mannheim, Heidelberg University, Mannheim, Germany, 2Department of Neuroradiology, Medical Faculty Mannheim, Heidelberg University, Mannheim, Germany, 3Department of Neurology, Medical Faculty Mannheim, Heidelberg University, Mannheim, Germany
Synopsis
This study investigates the possibility to reduce 23Na MRI measurement time for stroke patients by applying CNNs and evaluates the resulting TSC accuracy in GM and WM. Three different CNN architectures were implemented and compared. The CNNs’ performance was evaluated by calculating the TSC quantification error and with a qualitative evaluation from neuroradiologists. The implementation of TSC quantification into the clinical routine might be greately facilitated by an acceleration factor of 4 for the 23Na MRI acquisition time while keeping its TSC accuracy in WM and GM.
Introduction
Tissue sodium concentration (TSC) is a biomarker for essential physiological processes[1] and can be measured non-invasively by quantified 23Na MRI. In many pathologies – especially in the brain – it was observed that 23Na MRI can detect additional information on a cellular level[2,3]. A major limitation of 23Na MRI is its long measurement time. CNNs are known to enable robust image reconstruction from highly undersampled data[4]. This study investigates the possibility to reduce 23Na MRI measurement time for stroke patients by applying CNNs. Grey matter (GM) affection seems to be more prevalent in stroke[5], but white matter (WM) can be affected as well[6]. Hence, both tissue types were considered for the evaluation.Three different CNNs, applied on highly undersampled 23Na MR images, were evaluated based on their accuracy in GM an WM.
Methods
A standard clinical MRI-protocol for stroke, including the acquisition of a FLAIR image, with an additional 3D radial density-weighted 23Na sequence[7] was acquired on a 3T MRI (MAGNETOM Trio, Siemens Healthineers, Erlangen, Germany) using a bird-cage dual-tuned 23Na/1H head coil (Rapid Biomedical, Rimpar, Germany)[8].This study includes the data from 46 stroke patients ($$$72\pm13$$$ years, 25 female and 21 male). All the acquired k-space data (n=6000 spokes, TA=10mins) were used to reconstruct the full image (FI) which was used as ground truth. Furthermore, an undersampled image (UI) was reconstructed using n=1500 (undersampling factor=4) equidistant spokes to simulate an image with TA=2.5 mins. The image reconstructions were performed in MATLAB 2015a.
Previously, we have evaluated multiple CNN architectures and parameters by calculating the generated SNR and the structural similarity to FI (SSIM). The best performing CNNs were based on a UNet architecture[9] with residual connections. The networks have four encoding and four decoding stages (each stage 2 to 3 convolutional layers). Training uses an Adam optimizer. The batch size was set to 8 and the training ran for 20 epochs with a learning rate of 0.001. Based on these findings, we implemented three different CNNs:
CNN 1: No batch normalization, filter size of [32, 64, 128, 256, 512], loss function=L2
CNN 2: Usage of batch normalization, filter size of [32, 64, 128, 256, 512], loss function=L1
CNN 3: No batch normalization, filter size of [16, 32, 64, 128, 256], loss function=L1
The networks were implemented in Python 3.5 using Tensorflow 1.10. All CNNs were trained with 64x64voxel patches from the UI as input, and the corresponding patches of the FI as label. The data consisted of 38 training and 8 test datasets. 50 slices per patient (dataset) and 5 patches per slice resulted in 250 samples per training dataset.
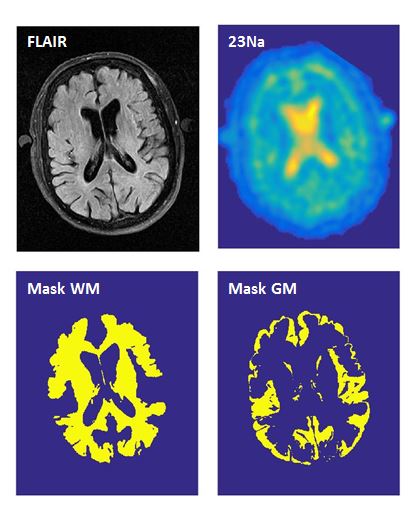
For the evaluation of the networks, a segmentation of the brain was performed using the statistical parameter mapping software SPM12 on the acquired FLAIR image resulting in a WM and a GM mask. Furthermore, SPM 12 was also used to coregister the different quantified versions of the 23Na image (FI, UI, and CNN 1-3) to the FLAIR image with the aim to use the segmentation masks on the 23Na images. Figure 1 shows one slice of the FLAIR image, the coregistered 23Na image (FI) and the calculated segmentation masks of WM and GM.
The deviation between UI, CNN and ground truth was evaluated by:
$$AbsoluteError(CNN,UI)=\frac{\sum_{n=1}^{N} |TSC_{CNN,UI}(n)-TSC_{FI}(n)|}{N}$$
with $$$N=\sum{voxels}$$$. Their performances were compared with:
$$RelativeError(CNN)=\frac{AbsoluteError(CNN)}{AbsoluteError(UI)}-1$$
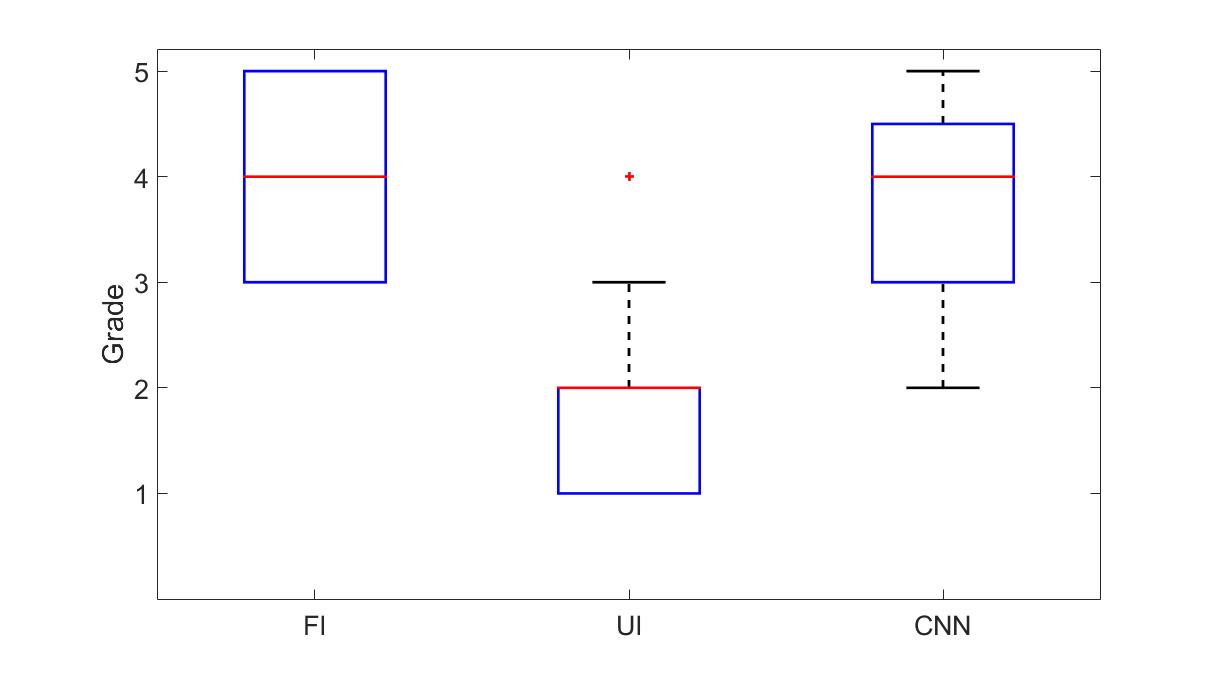
Three neuroradiologists with different levels of experience evaluated the images independently for the clinical relevance. The three images were graded with a scale from 1 (very bad) and 5 (very good). A significance test was performed using the student t-test with alpha=0.05.
Results
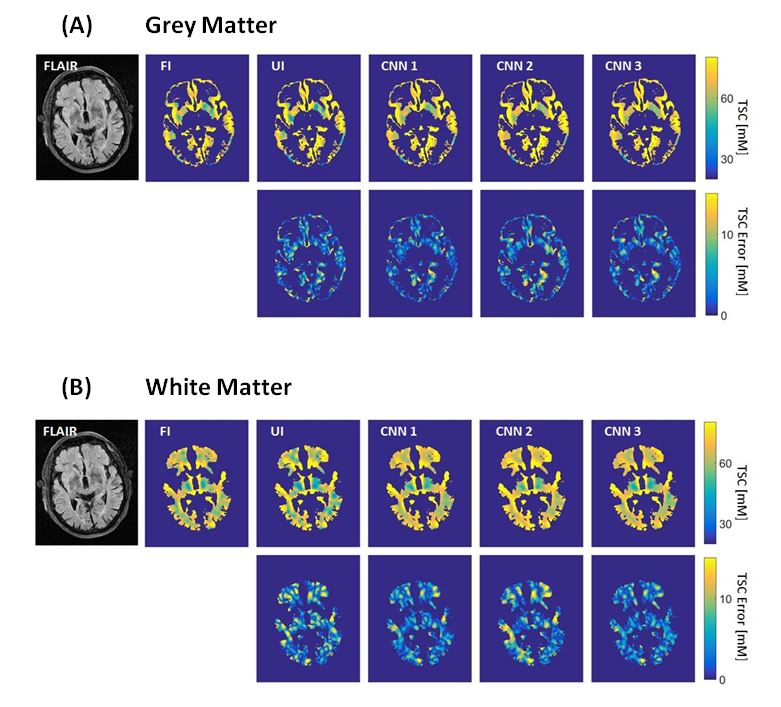
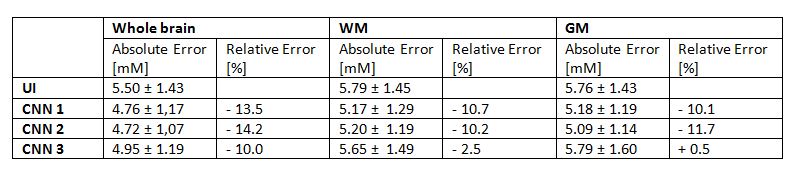
CNN 1 and CNN 2 decreased the TSC error compared to UI by >10% for white and grey matter while CNN 3 decreased the TSC error in WM by 2.5% and increased the TSC error in GM by 0.5%. For CNN 1 and 2 the absolute error is similar in WM (5.17 and 5.20 mM) and GM (5.18 and 5.09 mM). Figure 2 shows the error maps in WM and GM. In the exemplary shown slice, especially CNN 1 decreases the quantification error in both WM and GM. Table 1 shows the absolute and the relative averaged error for UI and CNN 1-3 for the whole brain, WM, and GM.The subjective evaluation of the images from the three neuroradiologists was averaged for all eight test datasets. The results are illustrated as boxplots in figure 3. The UI ($$$\bar{x}=1.88$$$) performed significantly lower than the FI ($$$\bar{x}=4.04$$$) and the CNN ($$$\bar{x}=3.92$$$) while the CNN and the FI had no statistically significant differences.
Discussion
All three CNNs implemented here decreased the TSC quantification error compared to the traditional reconstruction of highly undersampled 23Na MRI data. CNN 1 and CNN 2 improved the TSC accuracy in WM and GM compared to a traditional reconstruction of highly undersampled data. Furthermore, the diagnosability that was subjectively perceived by the neuroradiologists was improved by the implemented CNN.Conclusion
The implementation of TSC quantification into the clinical routine might be facilitated by 23Na MRI acquisition with an acceleration factor of 4 (TA=2.5mins) while keeping its TSC accuracy in WM and GM, and the subjectively perceived diagnosability.Acknowledgements
The project was funded by Dietmar Hopp Stiftung.References
[1] Boldyrev, A. A. "Na+, K+-ATPase: 40 years of investigations." (2000): 715-719.
[2] Hilal, Sadek K., et al. "In vivo NMR imaging of sodium-23 in the human head." Journal of computer assisted tomography 9.1 (1985): 1-7.
[3] Donadieu, Maxime, et al. "Metabolic counterparts of sodium accumulation in multiple sclerosis: A whole brain 23Na-MRI and fast 1H-MRSI study." Multiple Sclerosis Journal 25.1 (2019): 39-47.
[4] Schlemper, Jo, et al. "A deep cascade of convolutional neural networks for MR image reconstruction." International Conference on Information Processing in Medical Imaging. Springer, Cham, 2017.
[5] Arakawa, Shuji, et al. "Ischemic thresholds for gray and white matter: a diffusion and perfusion magnetic resonance study." Stroke 37.5 (2006): 1211-1216.
[6] Wang, Yuan, et al. "White matter injury in ischemic stroke." Progress in neurobiology 141 (2016): 45-60.
[7] Nagel, Armin M., et al. "Sodium MRI using a density‐adapted 3D radial acquisition technique." Magnetic Resonance in Medicine: An Official Journal of the International Society for Magnetic Resonance in Medicine 62.6 (2009): 1565-1573.
[8] Neumaier-Probst, Eva, et al. "A double-tuned 1H/23Na resonator allows 1H-guided 23Na-MRI in ischemic stroke patients in one session." International Journal of Stroke 10.SA100 (2015): 56-61.
[9] Ronneberger, Olaf, Philipp Fischer, and Thomas Brox. "U-net: Convolutional networks for biomedical image segmentation." International Conference on Medical image computing and computer-assisted intervention. Springer, Cham, 2015.
Figures