3804
Method for Automatic blood vessel removal from quantitative T1-perfusion MRI maps and evaluating its impact on tumor grading1Centre for Biomedical Engineering, Indian Institute of Technology, Delhi, New Delhi, India, 2Department of Radiology, Fortis Memorial Research Institute, Gurugram, India, 3Biomedical Engineering, All India Institute of Medical Science, Delhi, New Delhi, India
Synopsis
Presence of large blood vessels within tumor region can mislead interpretation on quantitative T1-perfusion MRI, particularly using automatic classification approaches. Purpose of this study was to develop a methodology for automatic blood vessel removal from quantitative T1-perfusion maps, compare it with previously reported methodology and finally evaluating impact of blood-vessel removal on tumor grading. In the proposed approach, signal intensity time curves characteristics, particularly contrast wash-out rate and peak value provided accurate automatic removal of blood-vessel from tumor region. Significant differences between T1-perfusion maps with and without blood-vessel removal were observed and tumor grading were also influenced.
INTRODUCTION
Imaging based Grading of brain tumors is being done using radiological features of convention MR images and quantitative maps such as CBV (Cerebral Blood Volume), CBF1,2 (Cerebral Blood Flow), Ktrans, ADC, etc. Major blood vessels such as carotid arteries, occipital sinus and many others may appear around the tumor and if they are included with segmented tumor region, it gives high values of hemodynamic parameters to cause misclassification or grading of tumor. So removal of major blood vessels is essential for accurate measurement of parameters and grading of tumor. Manual removal of blood vessels from segmented tumors is time taking and prone to errors. There are methods in the literature which have attempted to remove blood vessels from tumors2,3. However, sometime these methods might fails to remove blood vessel or remove tumor part showing similar value to blood vessel. Method based on DSC MRI3 is also not applicable in T1-perfusion (DCE) MRI as Area Under Curve (AUC) of blood vessel and contrast enhancing tumor might exhibit similar value. The current study have attempted to develop a new methodology based on some new surrogate markers derived from concentration curves of DCE-MRI data.METODS
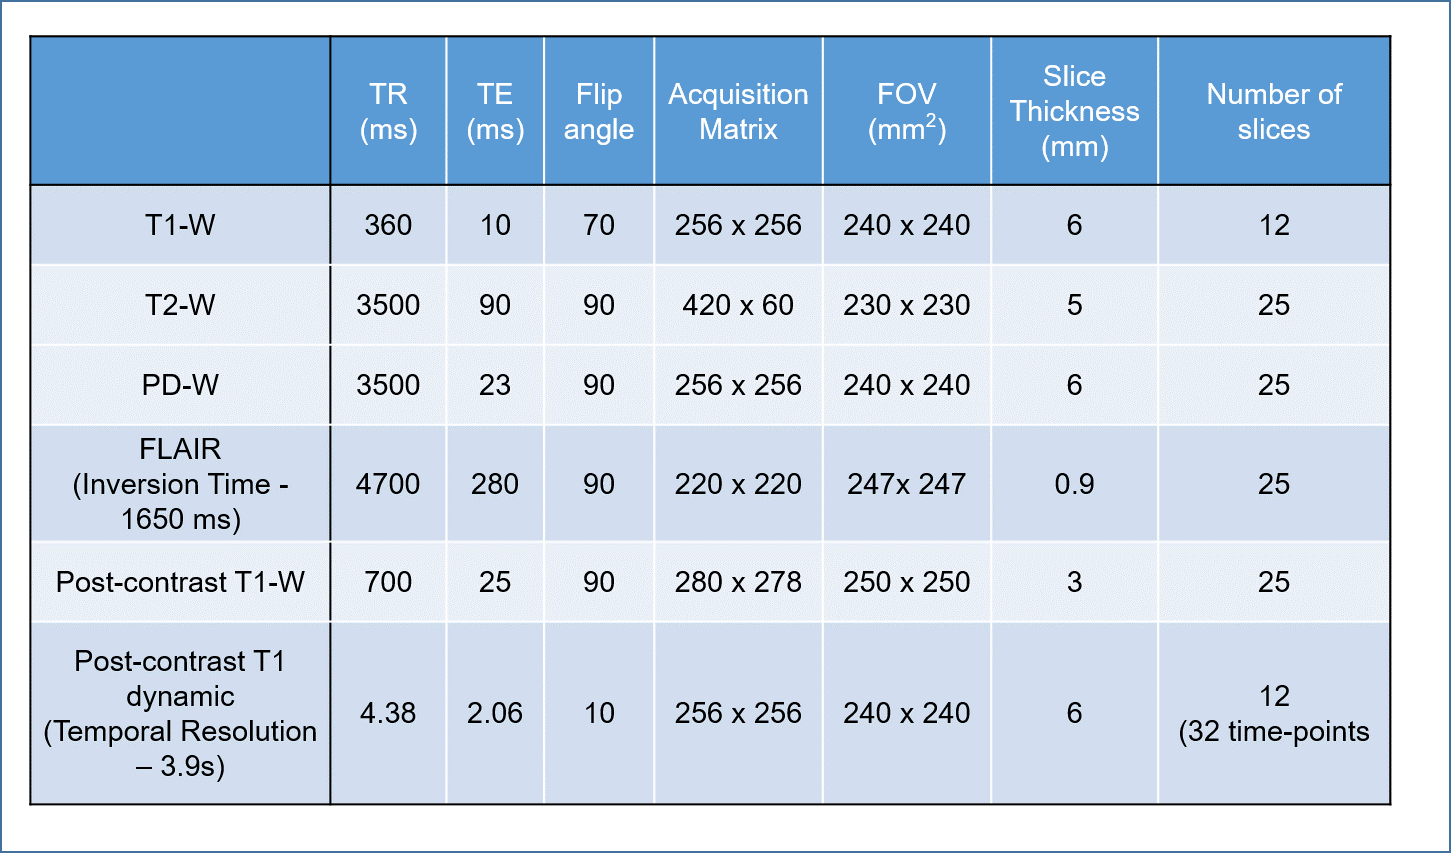
Data Acquisition: This is a retrospective study, which included MRI data from 40 brain tumor patients (20 low grade and 20 high grade classified using WHO 2016 methodology). This study was approved by Institutional Review Board of hospital and informed consent was obtained before MRI scanning. All MRI experiments were performed on a 3 T whole-body MRI system (Ingenia, Philips Healthcare, The Netherlands) using a 15-channel receive-only coil. The MRI protocol for this study included structural (T1, T2, PD weighted), T1-Perfusion (DCE), FLAIR images.Data processing: The registration of images was done using SPM12 software by taking T1-W images as a reference. Registered images were desculped by SPM software and hence background noise was removed automatically. DCE-MRI data was analysed using in-house developed routines in MATLAB. Pixelwise DCE MRI data was analyzed to convert signal intensity time curves to concentration time curves C(t). Pre-contrast T1 required for this process was obtained using T1, T2 and PD-w TSE images as described previously4. C(t) curves were fitted to piecewise linear model5 , GTKM model. First pass analysis was also performed to compute relative CBV and CBF maps. Local AIF was extracted automatically and used for GTKM and first pass analysis. Piecewise linear (PL) model parameters, particularly Slope2 (wash-out rate) and Peak value were used in the proposed method for automatic blood vessel removal. Proposed method is described as follows
Step-1). Slope2 and Peak value maps were generated for each slice
Step-2). Manually 4 ROIs having almost uniform shape and size were drawn over blood vessel voxels. Mean and Standard Deviation(SD) for slope2 and Peak values were calculated. Similarly, Mean and SD of these parameters in tumor tissues without blood-vessel were computed.
Step-3). A threshold of Slope2 (Mean±SD) and Peak value (Mean±SD) between tumor and blood vessel voxels were determined.
Step-4). An algorithm based upon these threshold was developed to remove blood vessels from tumor region automatically.
ROIs were drawn by MTech student and validated by experienced radiologist with more than 25 years of experience in MR imaging.
RESULTS
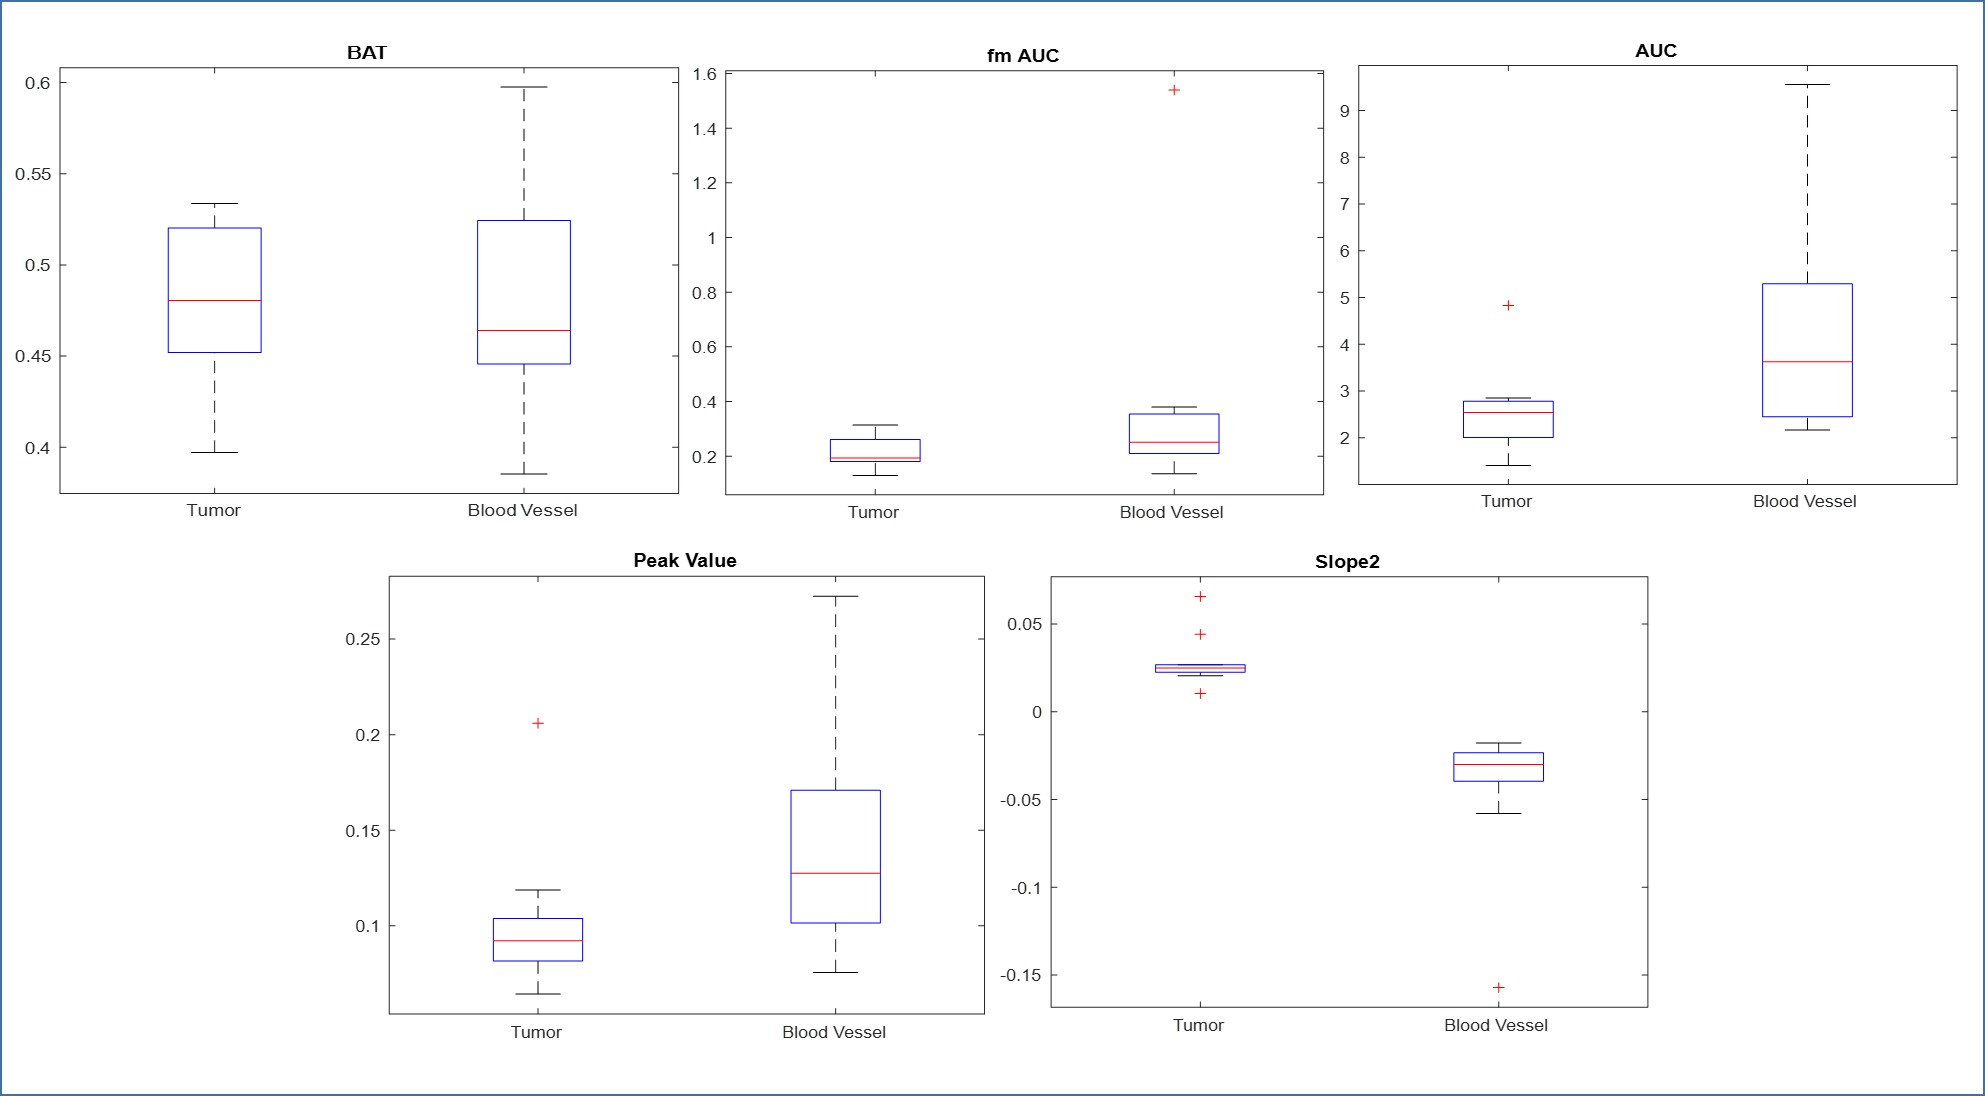
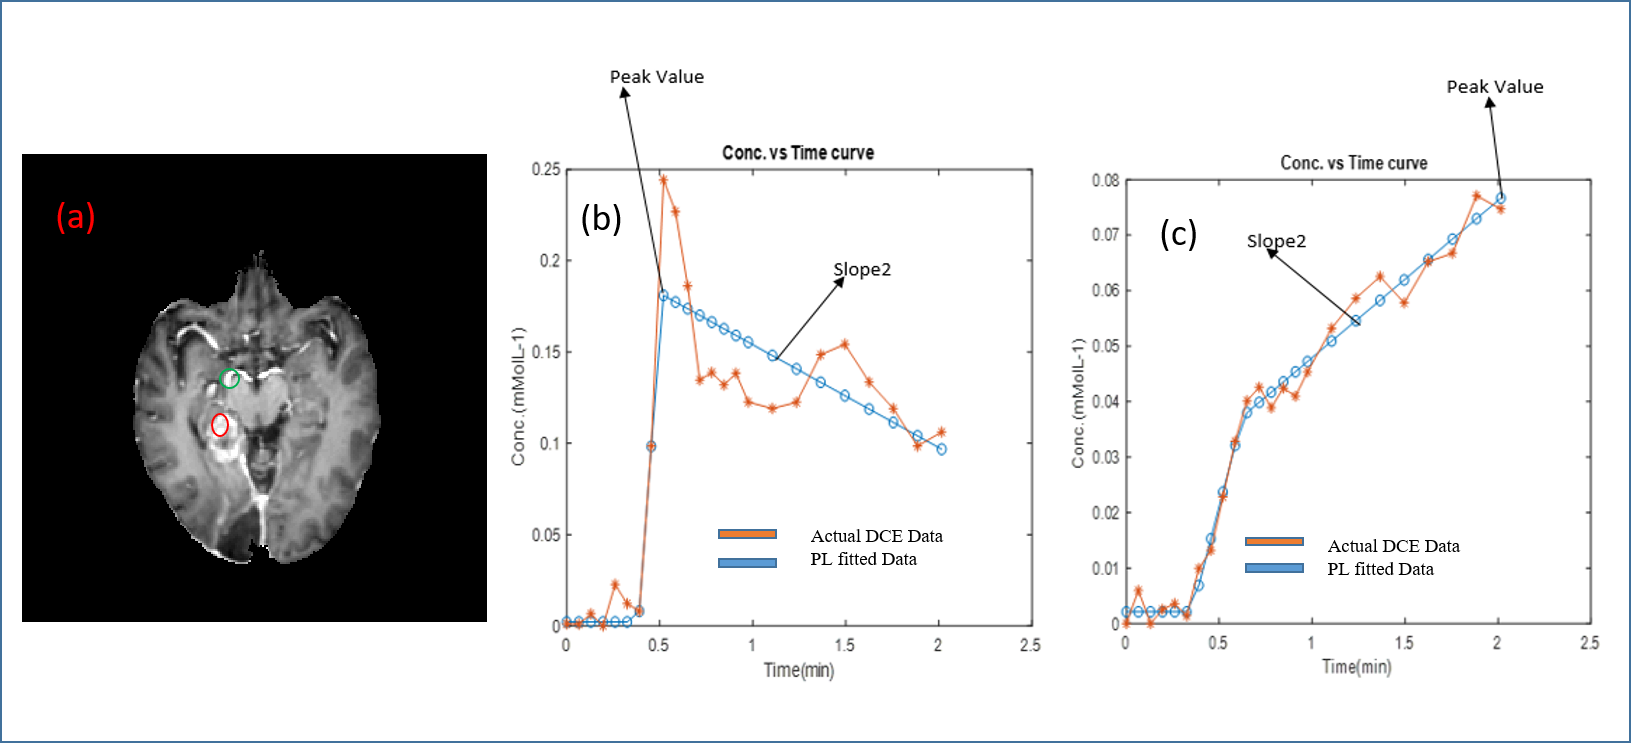
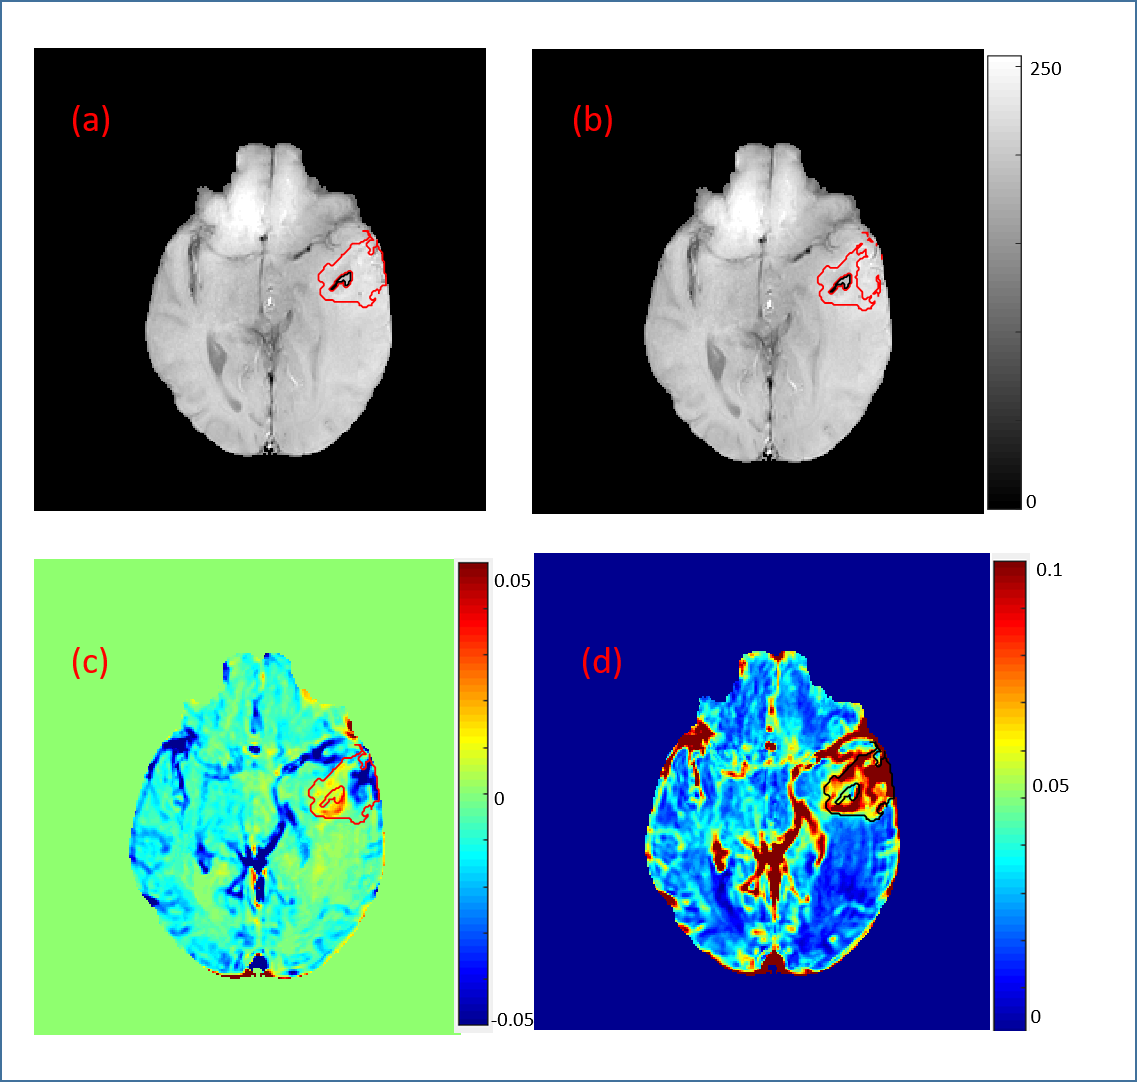
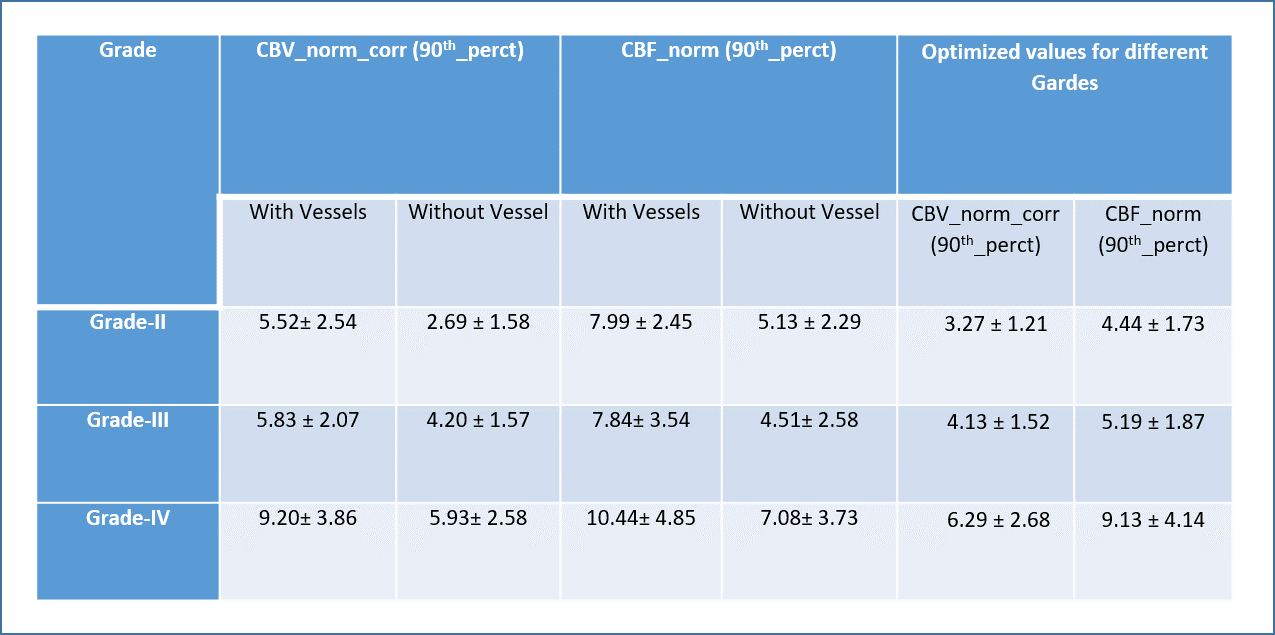
Box Plots in Fig.1 of different features for differentiating between tumor voxel (TV) and normal blood vessel voxel (NV) show that Slope2 and PeakValue are the best feature having no or very less overlapping values. Three segment piecewise linear fitting for a NV and TV are shown in Fig.2(b) & 2(c) of Grade-IV patient with goodness of fit (R2) value 0.88 and 0.98 respectively. It shows a clear distinction between TV and NV. Slope2 show a positive value and peak value is lower in comparison to NV which has negative Slope2 value and higher peak value. Tumor tissue overlaid on T1-W image, as shown in Fig.3(a), without blood vessels after applying proposed method. Comparision of hemodynamic parameters4 (in Table.1) were done before and after vessel removal of different grades of brain tumor. Hemodynamic parameters showed a significant difference between values before and after removal of blood vessels. Average values of these parametrs for tumors of different grades also changed.DISCUSSION and CONCLUSIONS
In the current study, it was observed that proposed method which is based on surrogate markers of DCE perfusion MRI worked well in removal of blood vessels from tumor region. Proposed approach weored well in both low and high grade tumors. Box plots of features used in3 show that these features can’t be utilized in DCE data for vessel removal. A comparative study has been done to calculate hemodynamic parameters in different grades of brain tumors. This shows that calculating hemodynamic parameters without vessel removal, can misclassify tumors. In Grade-II CBV_norm_corr (90th_perct) value before vessel removal was 5.52 ± 2.54(which classifies it into Grade-III) and after applying vessel removal value was 2.69 ± 1.58 and optimized cutoff for between Grade-II and Grade-II is 3.27 ± 1.21. Similar pattern was observed for other grades also.Acknowledgements
This work was supported by Indian Institute of Technology Delhi and Fortis Memorial Research Institute Gurugram. I sincerely thanks to all my lab mates Ayan Debnath,RafeekT and Suhail Parvez.References
1. Bailey P, Cushing H. A classification of the tumors of the glioma group on a histogenetic basis with a correlated study of prognosis. Philadelphia, Pa: Lippincott, 192.
2. Sengupta A, Ramaniharan A, Gupta RK, Agarwal S, Singh A. Glioma grading using a machine learning framework based on optimized features obtained from T1 perfusion MRI and volumes of tumor components. J Magn Reson Imaging. 2019 Mar 20. doi: 10.1002/jmri.26704.
3. Kyrre E. Emblem, Paulina Due-Tonnessen, John K. Hald, and Atle Bjornerud. Automatic Vessel Removal in Gliomas from Dynamic Susceptibility Contrast Imaging Magnetic Resonance in Medicine 61:1210–1217 (2009).
4. Singh A, Haris M, Rathore DKS, Purwar A, Sarma MK, Bayu G, Husain N, Rathore RKS, Gupta RK. Quantification of physiological and hemodynamic indices using T1 dynamic contrast enhanced MRI in intracranial mass lesions. J Magn Reson Imaging 2007; 26:871-880.
5.Singh A, Rathore RKS, Gupta RK, Haris M, Rathore DS, Verma SK, Purwar A, Bayu G, Sarma MK, Singh JK. Fitting of the Piecewise Linear Function to Signal Intensity Time Curve and its Application in improving the Analysis of Concentration Time Curve of Dynamic Contrast Enhanced-MRI Data. Proc. Intl. Soc. Mag. Reson. Med. Berlin, Germany (2007).
Figures