3803
Improved T2 Quantification using Noise Corrected Stimulated Echo Compensation
Fei Han1, Mahesh Bharath Keerthivasan2, and Vibhas Deshpande3
1MR R&D and Collaboration, Siemens Healthineers, Los Angeles, CA, United States, 2MR R&D and Collaboration, Siemens Healthineers, Tucson, AZ, United States, 3MR R&D and Collaboration, Siemens Healthineers, Austin, TX, United States
1MR R&D and Collaboration, Siemens Healthineers, Los Angeles, CA, United States, 2MR R&D and Collaboration, Siemens Healthineers, Tucson, AZ, United States, 3MR R&D and Collaboration, Siemens Healthineers, Austin, TX, United States
Synopsis
Quantitative imaging is the key to developing reliable and reproducible imaging methods for standardized diagnostic exams. Most practical T2 mapping solutions are based on the CPMG concept, using the SEMC or TSE sequence. However, several confounding variables, such as, but not limited to the B1, RF profile, refocusing flip-angle, choice of TEs, and the imaging noise/artifacts, can lead to distorted signal and inaccurate T2 quantification. In this work, we investigated some of these confounders in CPMG-based T2 quantification and proposed a new model and fitting methods to improve the reliability, reproducibility of in-vivo T2 quantification.
Introduction
Quantitative imaging is the key to developing reliable and reproducible imaging methods for standardized diagnostic exams. Quantitative T2 imaging has demonstrated potential in the investigation of liver, heart, brain, and MSK diseases (1,2). Most practical T2 mapping solutions are based on the CPMG concept (3), using multi-contrast spin-echo (SEMC) or turbo-spin-echo (TSE) sequence. However, several confounding variables, such as, but not limited to the B1, RF profile, and refocusing flip-angle (RFA), can give rise to stimulated echoes, leading to distorted signal and T2 quantification errors.Stimulated echo compensation methods utilize slice-resolved EPG (SEPG) or Bloch models to determine both T2 and B1 using least squares fitting or pattern recognition algorithms (4). Although these methods could in theory provide accurate T2 quantification, the accuracy and stability of the solution is often compromised in the presence of imaging noise and artifacts (2). In this work, we investigated the role of noise in T2 quantification based on stimulated echo compensation and proposed a new model and fitting methods to improve the reliability, reproducibility of T2 quantification.
Methods
Signal models used in this study are:- 2-parameter exponential model: Exp2(M0,T2)
- 3-parameter exponential model with noise-floor: Exp3(M0,T2,N)
- 3-parameter SEPG model: SEPG3(M0,T2,B1)
- 4-parameter SEPG model with noise-floor: SEPG4(M0,T2,B1 N)
The first two models were applied in the least-square fitting using the Levenberg-Marquardt algorithm. The SEPG model was used to generate dictionaries to facilitate fitting parameters by maximizing the normalized dot product of the measured and simulated signals (6). In order to address the increased fitting complexity that is associated with the additional parameter in the SEPG4 model, we proposed a two-step method that first estimate the noise-floor by doing EXP3 fitting on signals starting from the third echo and then doing a SEPG3 dictionary fitting on the entire signal with corrected noise-floor (Fig1c).
The NIST System Phantom (HPD Inc., Boulder) was scanned on a 3.0T scanner (Magnetom Vida, Siemens Healthcare, Erlangen) using a standard spin-echo sequence (TE=8,15,30,50,100,200,400ms,TA=50min), a prototype radial SEMC sequence (48 echoes, echo-spacing=8ms, 400 views, TA=14min) and a prototype radial TSE sequence(48 echoes, echo-spacing=8ms, 672 views, TA=45sec). K-space view-sharing was used to bin the radial TSE data into multiple images with different echo time (5). The Exp2 model was used to estimate the T2 values from the spin-echo images, which served as the ground truth. In order to evaluate the longest TE required for accurate T2 quantification, the fitting was repeated with signal truncated at the end by various length.
Radial TSE images were acquired on two volunteers in the legs and the liver. The liver scan was performed under free-breathing and triggered by Navigators. The Spin-echo and SEMC protocols was scanned for the legs but not the liver due to prolonged scan time.
Results
Fig.1a shows the measured SEMC signal of a single pixel from the phantom with known T2true=44.1ms. The SEPG3 model gives a estimated T2fit of 70.2ms. The poor fitting quality and large T2 overestimation was primarily due to the presence of a noise floor, which was not accounted for in the SEPG3 model. Fig.1b shows the fitting using the proposed SEPG4 model and two-step fitting method, with the resulting T2fit of 46.3ms. The improved fitting quality and T2 accuracy is primarily due to the introduction of noise floor parameter, which is estimated by the first step EXP3 fitting.Fig2 summarizes the estimated T2 and goodness-of-fit using different models. The proposed method provides the most accurate T2 estimation for a wide range of T2s. It also has the minimum standard deviation and fitting error when compared with other models. Fig3 shows that the T2 estimation accuracy improves with increased number of echoes and the rate of convergence is faster for smaller T2s. Generally, the TE of the longest echo has to be close to 3 times of the T2 values to achieve 5% accuracy.
Fig.4 shows the example of in-vivo images on the leg. The T2 estimation based on both Radial SEMC and Radial TSE images matches with the ground-truth, which was estimated on the spin-echo images. Fig.5 shows the in-vivo abdominal images with corresponding T2 maps. Four pairs of ROIs were drawn on different tissue types, each pair was on either different sides or on different slices. The estimated T2 values are consistent within each pair.
Discussion
It is necessary to introduce the noise-floor parameter in the SEPG model for improved T2 quantification accuracy. We proposed a novel two-pass fitting method to overcome the increased fitting complexity associated with the added parameter. Result from phantom experiments show the proposed method yields accurate T2 quantification. We also demonstrated the feasibility of using radial TSE sequence to acquire in-vivo images for T2 mapping. Preliminary results show that the in-vivo T2 values are accurate and consistent within and across slices, although further studies are warranted to systemically evaluate the accuracy and reproducibility of in-vivo T2 quantification.Acknowledgements
No acknowledgement found.References
1. Alustiza JM, Artetxe J, Castiella A, Agirre C, Emparanza JI, Otazua P, Garcia-Bengoechea M, Barrio J, Mujica F, Recondo JA. MR quantification of hepatic iron concentration. Radiology 2004;230:479–484. 2. Mcphee KC, Wilman AH. Transverse Relaxation and Flip Angle Mapping : Evaluation of Simultaneous and Independent Methods Using Multiple Spin Echoes. 2017;2065:2057–2065. 3. Carr HY, Purcell EM. Effects of Diffusion on Free Precession in Nuclear Magnetic Resonance Experiments. Phys. Rev. 1954;94:630–638. 4. Lebel RM, Wilman AH. Transverse relaxometry with stimulated echo compensation. Magn. Reson. Med. 2010;64:1005–1014. 5. Altbach MI, Bilgin A, Li Z, Clarkson EW, Trouard TP, Gmitro AF. Processing of Radial Fast Spin-Echo Data for Obtaining T 2 Estimates from a Single K-Space Data Set. 2005;559:549–559. 6. Huang C, Altbach MI, El Fakhri G. Pattern recognition for rapid T2 mapping with stimulated echo compensation. Magn. Reson. Imaging 2014;32:969–974.Figures
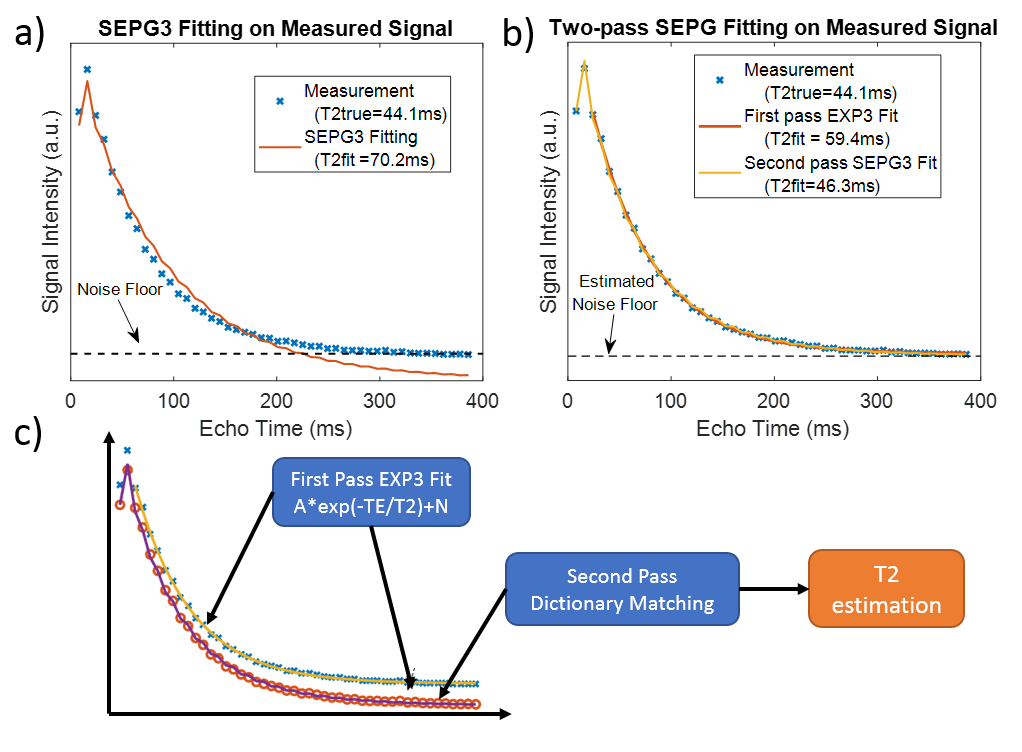
Figure.1 (a) The SEPG3 model has poor
fitting quality that leads to T2 overestimation, due to the existence of a noise
floor. (b) the proposed SEPG4 model and two-step method has much improved
fitting quality and accurate T2 estimation. (c) The proposed two-step method estimates
the noise-floor by first doing an EXP3 fitting on signals starting from the
third echo and then doing a SEPG3 dictionary fitting on the entire signal with
corrected noise floor.
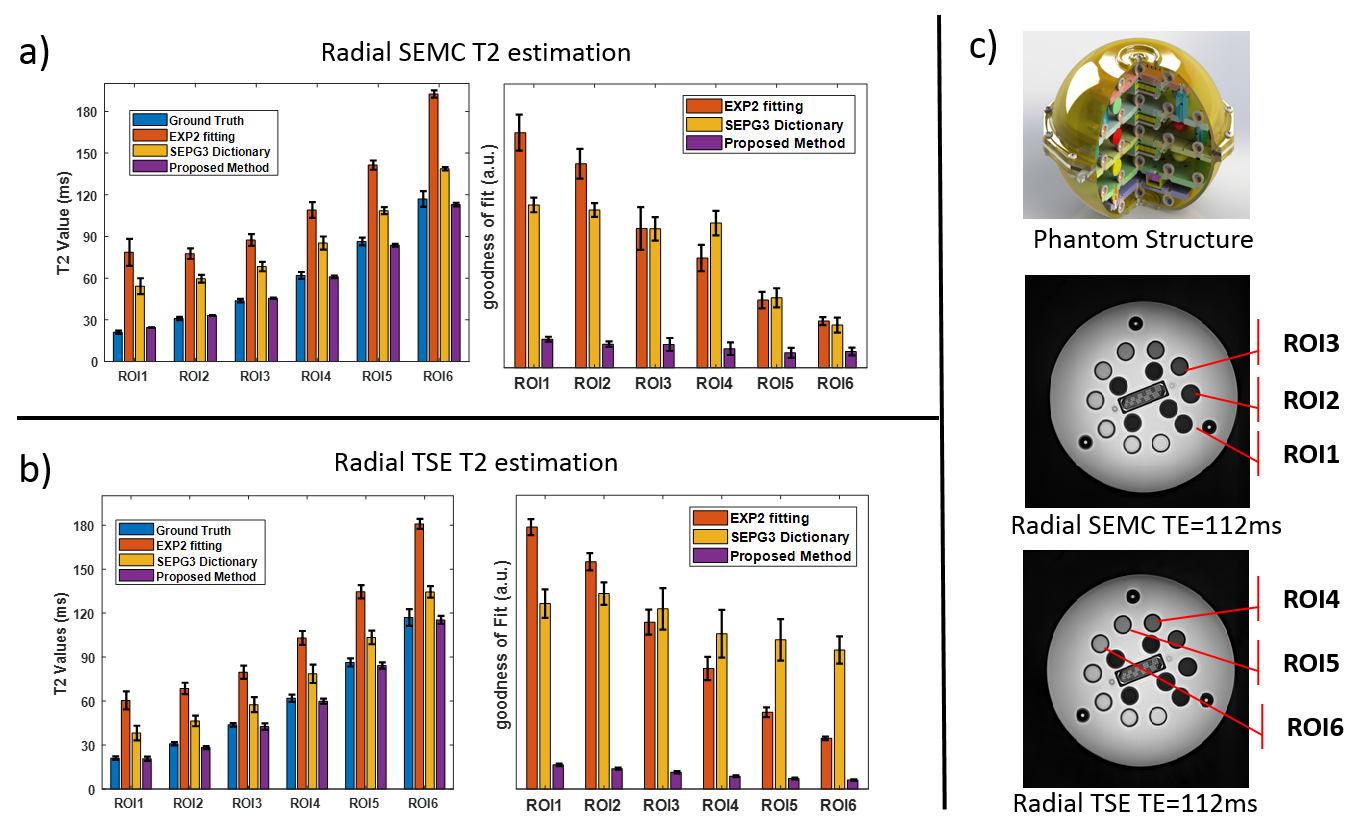
Figure. 2 Estimated
T2 (mean and standard deviation) and goodness of fit on Radial SEMC images (a)
and Radial TSE images (b). The proposed method has the most accurate T2, with
small standard deviation and minimal fitting error when compared with EXP2 and
SEPG3 models. (c) internal structure and example images of the quantitative
phantom used in this study.
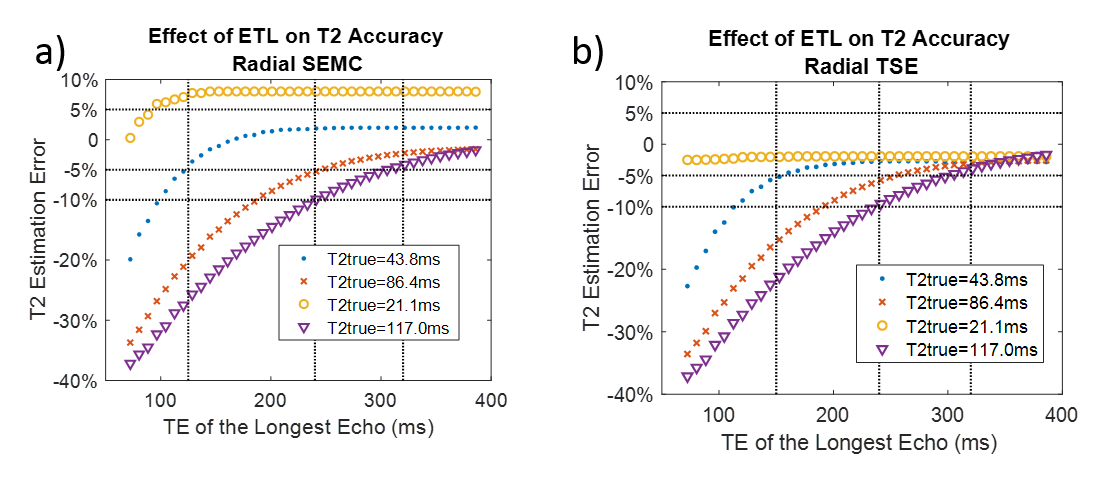
Figure.3 The
accuracy of T2 estimation improves with increased number of echoes and the rate
of convergence is faster for shorter T2s. The TE of the longest echo has
to be near 3 times of the underlying T2 in order to reach stability and fall with the ±5% accuracy range.
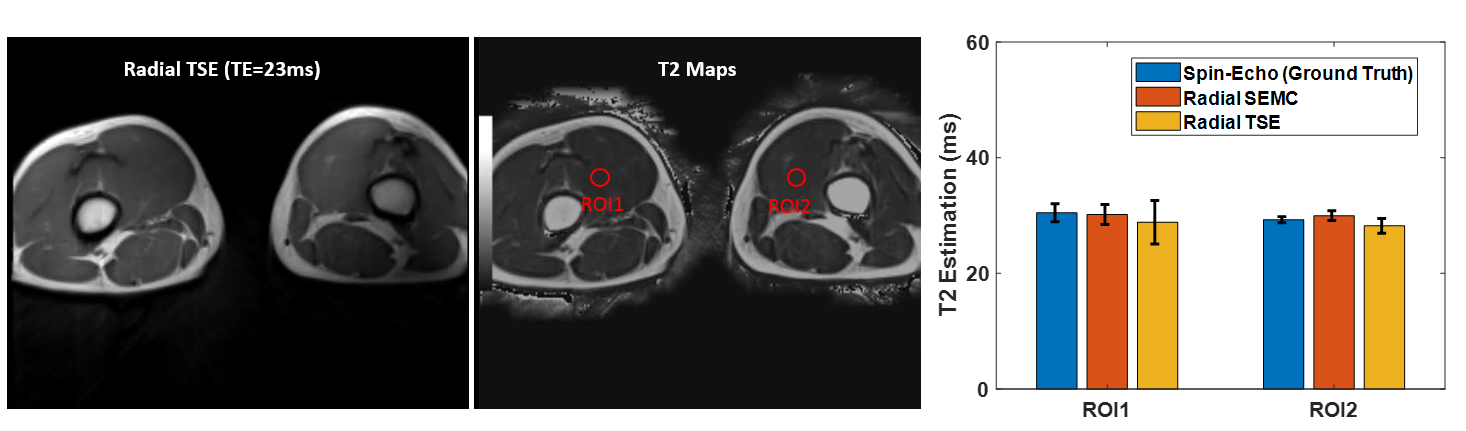
Figure.4
In-vivo images on the leg. Two ROIs were drawn on both sides of the leg. The T2
estimation based on Radial SEMC and Radial TSE images match with the
ground-truth, which was estimated based on the spin-echo images.
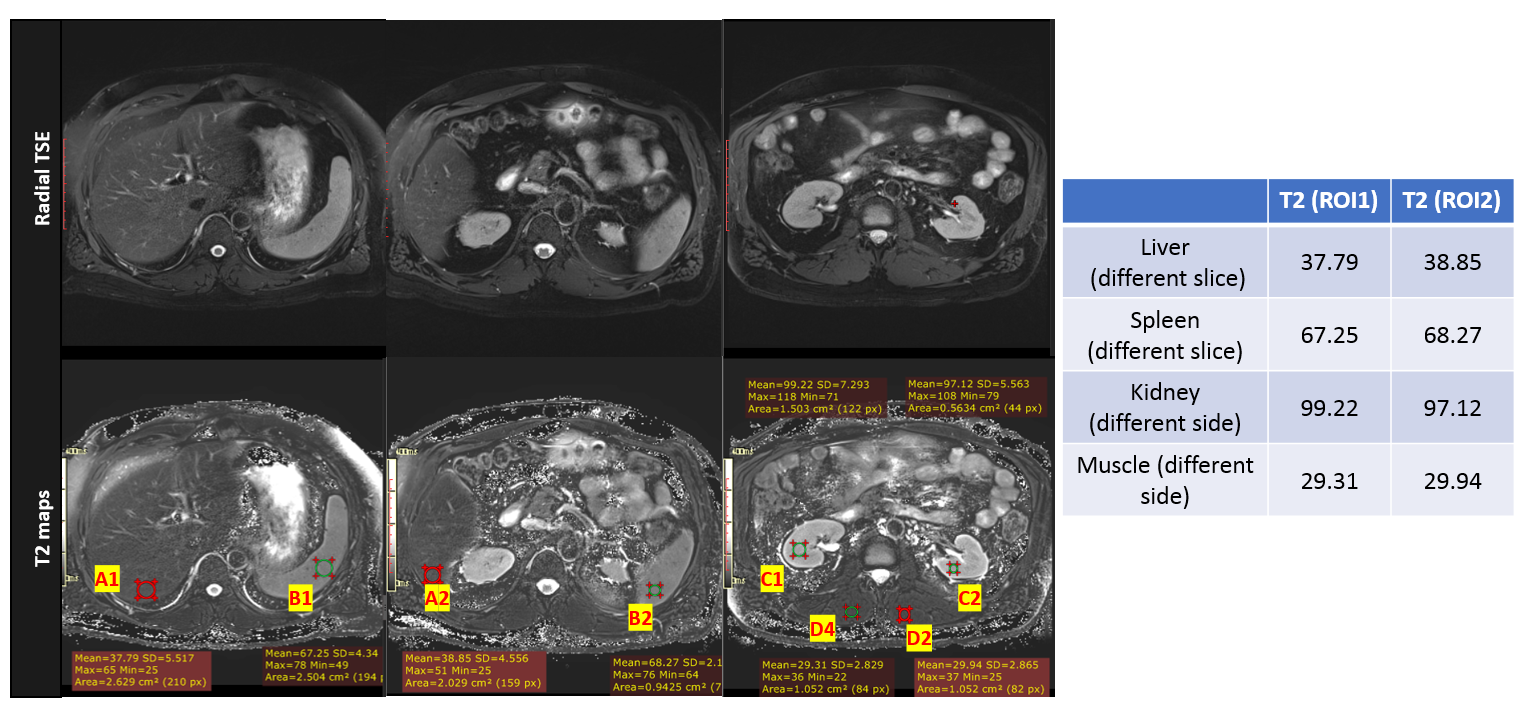
Figure.5 The
free-breathing (navigator triggered) Radial TSE images and the calculated T2
maps. Four pairs of ROIs were drawn on different organs, each pair of ROIs was selected on either different sides or from different slices. The estimated T2 values are
consistent within each pair of ROI.