3800
Quantitative Macromolecular Proton Fraction Imaging Based On Spin-Lock
Jian Hou1, Vincent Wong2, Baiyan Jiang1, Yixiang Wang1, Anthony Chan3, Winnie Chu1, and Weitian Chen1
1Department of Imaging and Interventional Radiology, The Chinese University of Hong Kong, Hong Kong, Hong Kong, 2Department of Medicine & Therapeutics, The Chinese University of Hong Kong, Hong Kong, Hong Kong, 3Department of Anatomical and Cellular Pathology, The Chinese University of Hong Kong, Hong Kong, Hong Kong
1Department of Imaging and Interventional Radiology, The Chinese University of Hong Kong, Hong Kong, Hong Kong, 2Department of Medicine & Therapeutics, The Chinese University of Hong Kong, Hong Kong, Hong Kong, 3Department of Anatomical and Cellular Pathology, The Chinese University of Hong Kong, Hong Kong, Hong Kong
Synopsis
Macromolecular
Proton Fraction (MPF) is the relative amount of protons associated with
macromolecules involved in magnetization transfer
with free water protons. MPF is typically measured by quantitative
magnetization transfer methods. In this work, we reported that MPF can also be
measured based
on spin-lock. Compared
to the existing MPF methods, our method requires fewer parameter maps.
We demonstrated our method using simulation, phantom, and in
vivo experiments.
Intoduction
The Magnetization Transfer (MT) effect caused by cross-relaxation between protons of water and those associated with semi-solid macromolecules can provide a unique contrast to probe tissue properties1. Among various approaches developed to quantify the MT effect2–6, one approach which attracts special interest is quantitative imaging of macromolecular proton fraction (MPF). MPF is defined as the relative amount of protons associated with macromolecules involved in magnetization exchange with free water protons. The existing quantitative MPF imaging methods typically require acquisition of multiple parameter maps, including B1, B0, and T1 map, in addition to the imaging data. In this work, we reported an approach to quantify MPF based on spin-lock, termed MPF-SL. We demonstrate that our approach only requires a B1 map in addition to the imaging data for MPF quantification.Methods
The relaxation rate during the spin-lock can be expressed as contributions from three terms7: R1rho(Δw, w1)=Reff(Δw, w1)+Rcest(Δw, w1)+Rmt(Δw, w1), where Δw is the resonance frequency offset; w1 is the RF amplitude. Reff, Rcest and Rmt are the relaxation of the free water pool, relaxation due to chemical exchange, and relaxation due to MT, respectively.The proposed MPF-SL approach measures the difference of R1rho from two acquisitions: Rmpfsl=R1rho(Δw(2), w1(2))-R1rho(Δw(1), w1(1))=ΔReff+ΔRcest+ΔRmt. In MPF-SL, we choose the parameters such that: Δw(2)/w1(2)=Δw(1)/w1(1), and Δw/w1>>1. Under these conditions, we have ΔReff=0 and ΔRcest≈0. Consequently, we have Rmpfsl=ΔRmt. Note our measurement Rmpfsl is specific to the MT pool and is insensitive to the change of the free water pool and the chemical exchange pool. After we obtain Rmpfsl, MPF can be calculated from Rmpfsl using the existing theory7,8. Note only a B1 map is needed to measure MPF from Rmpfsl.
To obtain Rmpfsl, we use the approach described in references9,10. Four images were acquired to calculate Rmpfsl: Rmpfsl=-log((Mtg(2)-Mntg(2))/ (Mtg(1)-Mntg(1)))/TSL, where TSL is time-of-spinlock, subscript tg and ntg represent the toggling RF pulse on and off, respectively, and (1) and (2) corresponds to the parameters (Δw(1), w1(1)) and (Δw(2), w1(2)), respectively. We performed simulation, phantom, and in vivo studies to demonstrate the proposed method.
For all simulation, phantom and in vivo experiments, Δw(1)=-1000Hz, w1(1)=100Hz, Δw(2)=-4000Hz, w1(2)=400Hz. For the simulation study, Bloch-McConnell simulation was performed to investigate Rmpfsl as a function of MPF for cartilage, muscle, and liver tissues11. All MRI scans were conducted using a 3.0 T MRI scanner (Philips Achieva, Philips Healthcare, Best, Netherlands). We performed two phantom experiments. Phantom data sets were acquired using the 8-channel head coil. The first phantom experiment was used to demonstrate that MPF-SL imaging is sensitive to the MT pool population. Five agarose phantoms were prepared using different concentration of agarose (1%, 2%, 3%, 4% and 5%). Imaging Parameters of MPF-SL include: resolution 1.5mm*1.5mm, slice thickness 7mm, TR/TE 2000/15ms, TSL 50ms. The second phantom experiment was used to demonstrate MPF-SL imaging is insensitive to the relaxation of free water pool. The imaging parameters were the same as those used in the phantom experiment 1.
For the in vivo study, two volunteers were scanned under the approval of the institutional review board. These two volunteers are the patients attending the hepatology clinics of our institute with fibrosis stage confirmed by liver biopsy. They were screened and referred to receive MRI exam. One volunteer has METAVIR score F0 and the other F2. A 32-channel cardiac coil was used as the receiver and the body coil was used as the RF transmitter. Imaging parameters include: resolution 1.5mm*1.5mm, slice thickness 7mm, and TR/TE 2000/20ms. SPIR was used for fat suppression. A single slice imaging data was acquired in a single breath-hold of 8 seconds. A B1 map was collected to calculate MPF.
Results
Figure 1 shows the results from simulation. Note Rmpfsl is approximately a linear function of MPF. Figure 2 is the results from the phantom experiment 1. Note the proposed MPF-SL can detect the changes of MPF. Figure 3 shows the results of phantom experiment 2. Note MPF-SL resulted in comparable quantification when agarose concentration was the same, regardless of the concentration of MnCl2. In contrast, T1rho quantification was affected by the concentration of both agarose and MnCl2. Figure 4 shows the in vivo results. Note obvious MPF accumulation in the liver of the volunteer with early stage liver fibrosis (F2) compared to the normal subject (F0). This is due to the fact that liver fibrosis is associated with collagen deposition, which has strong MT effect and can be measured by MPF.Discussion & Conclusion
We proposed a novel approach to quantify MPF. Our method is based on R1rho relaxation, but it removes the confounding factors and is specific to MPF. Compared to the existing MPF imaging methods, our method requires fewer parameter maps. Only a B1 map is needed in addition to the imaging data. In contrast, the state-of-the-art MPF imaging approach requires acquisition of B1, B0, and T1 map in addition to the imaging data to quantify MPF8. It also assumes the product of the longitudinal and the transverse relaxation of the water pool is a constant. Such assumption is not required in the proposed approach.Acknowledgements
This study is supported by a grant from the Hong Kong General Research Fund (GRF) 14201817, a grant from the Innovation and Technology Commission of the Hong Kong SAR (Project MRP/001/18X), a grant from the Research Grants Council of the Hong Kong SAR (Project SEG CUHK02), and a grant from the Hong Kong Health and Medical Research Fund (HMRF) 06170166.References
- Henkelman, R. M.; Stanisz, G. J.; Graham, S. J. Magnetization Transfer in MRI: A Review. NMR in Biomedicine 2001, 14 (2), 57–64. https://doi.org/10.1002/nbm.683.
- Sled, J. G.; Pike, G. B. Quantitative Imaging of Magnetization Transfer Exchange and Relaxation Properties in Vivo Using MRI. Magnetic Resonance in Medicine 2001, 46 (5), 923–931. https://doi.org/10.1002/mrm.1278.
- Ramani, A.; Dalton, C.; Miller, D. H.; Tofts, P. S.; Barker, G. J. Precise Estimate of Fundamental In-Vivo MT Parameters in Human Brain in Clinically Feasible Times. Magnetic Resonance Imaging 2002, 20 (10), 721–731. https://doi.org/10.1016/S0730-725X(02)00598-2.
- Yarnykh, V. L. Pulsed Z-Spectroscopic Imaging of Cross-Relaxation Parameters in Tissues for Human MRI: Theory and Clinical Applications. Magnetic Resonance in Medicine 2002, 47 (5), 929–939. https://doi.org/10.1002/mrm.10120.
- Gochberg, D. F.; Gore, J. C. Quantitative Magnetization Transfer Imaging via Selective Inversion Recovery with Short Repetition Times. Magn. Reson. Med. 2007, 57 (2), 437–441. https://doi.org/10.1002/mrm.21143.
- Li, K.; Zu, Z.; Xu, J.; Janve, V. A.; Gore, J. C.; Does, M. D.; Gochberg, D. F. Optimized Inversion Recovery Sequences for Quantitative T1 and Magnetization Transfer Imaging. Magnetic Resonance in Medicine 2010, 64 (2), 491–500. https://doi.org/10.1002/mrm.22440.
- Zaiss, M.; Zu, Z.; Xu, J.; Schuenke, P.; Gochberg, D. F.; Gore, J. C.; Ladd, M. E.; Bachert, P. A Combined Analytical Solution for Chemical Exchange Saturation Transfer and Semi-Solid Magnetization Transfer. NMR in Biomedicine 2015, 28 (2), 217–230. https://doi.org/10.1002/nbm.3237.
- Yarnykh, V. L. Fast Macromolecular Proton Fraction Mapping from a Single Off-Resonance Magnetization Transfer Measurement. Magnetic Resonance in Medicine 2012, 68 (1), 166–178. https://doi.org/10.1002/mrm.23224.
- Jin, T.; Kim, S.-G. Quantitative Chemical Exchange Sensitive MRI Using Irradiation with Toggling Inversion Preparation. Magnetic Resonance in Medicine 2012, 68 (4), 1056–1064. https://doi.org/10.1002/mrm.24449.
- Jiang, B.; Jin, T.; Blu, T.; Chen, W. Probing Chemical Exchange Using Quantitative Spin-Lock R1ρ Asymmetry Imaging with Adiabatic RF Pulses. Magnetic Resonance in Medicine 2019, 82 (5), 1767–1781. https://doi.org/10.1002/mrm.27868.
- Stanisz, G. J.; Odrobina, E. E.; Pun, J.; Escaravage, M.; Graham, S. J.; Bronskill, M. J.; Henkelman, R. M. T1, T2 Relaxation and Magnetization Transfer in Tissue at 3T. Magnetic Resonance in Medicine 2005, 54 (3), 507–512. https://doi.org/10.1002/mrm.20605.
Figures
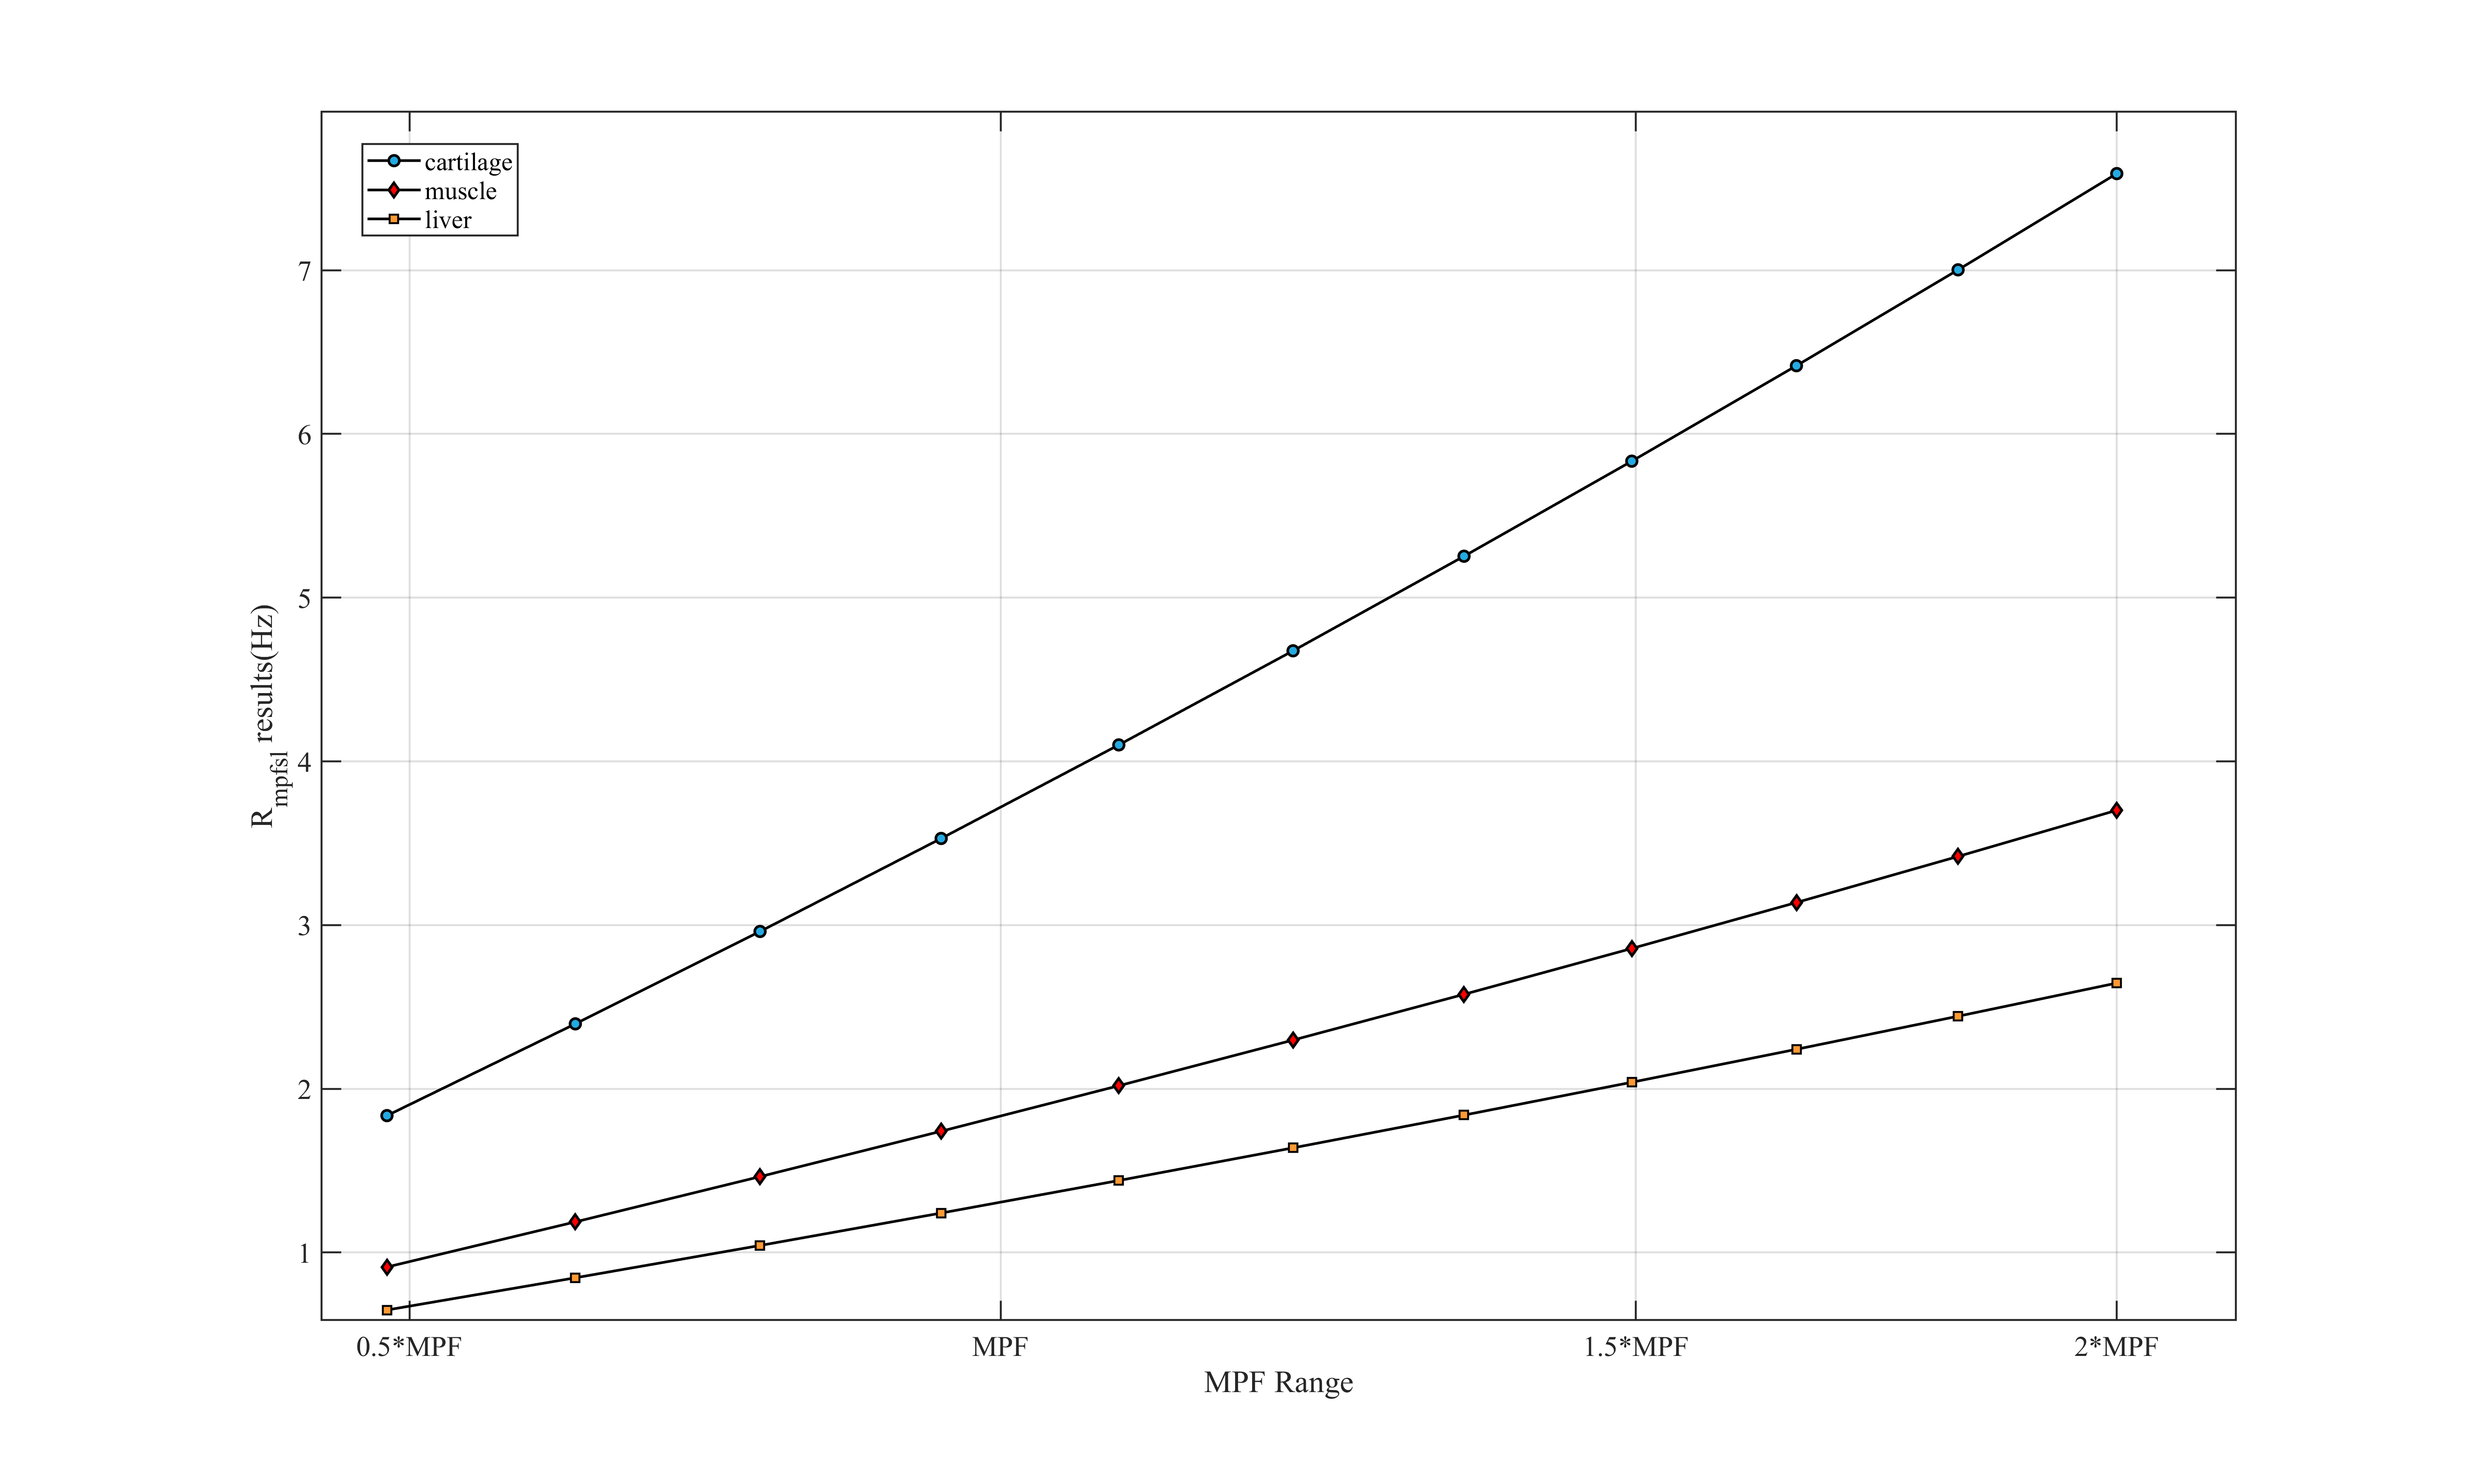
Figure 1: BM simulation of the proposed sequence. For cartilage,
muscle and liver: R1a=0.86Hz, 0.71Hz, 1.2Hz; R2a=37Hz,
20Hz, 23.8Hz; R1c is equal to R1a; R2c=1.2*105Hz,
1.1*105Hz, 1.3*105Hz; kca=57s-1,
66s-1, 51s-1; MPF=14.6%, 6.89%, 6.45%. R2b=66.7Hz;
kba=1500s-1; fb=0.14%.
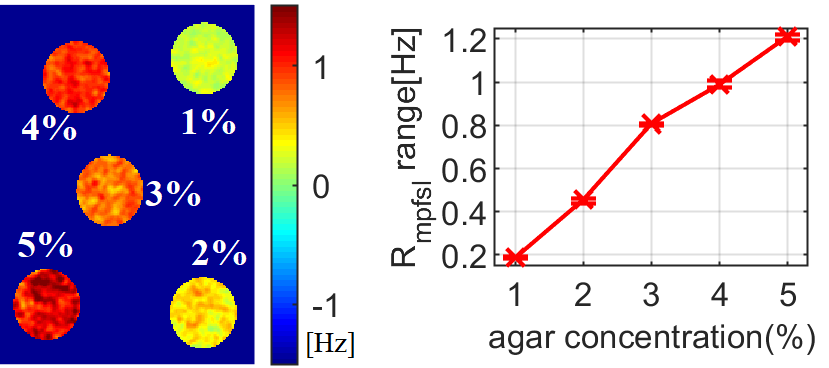
Figure 2: The results of phantom experiment 1. left plot are the Rmpfsl
maps from
5 agar phantoms with concentration ranging from 1% to 5%. The right plot is the
line plot of the measured Rmpfsl and
the agar concentration.
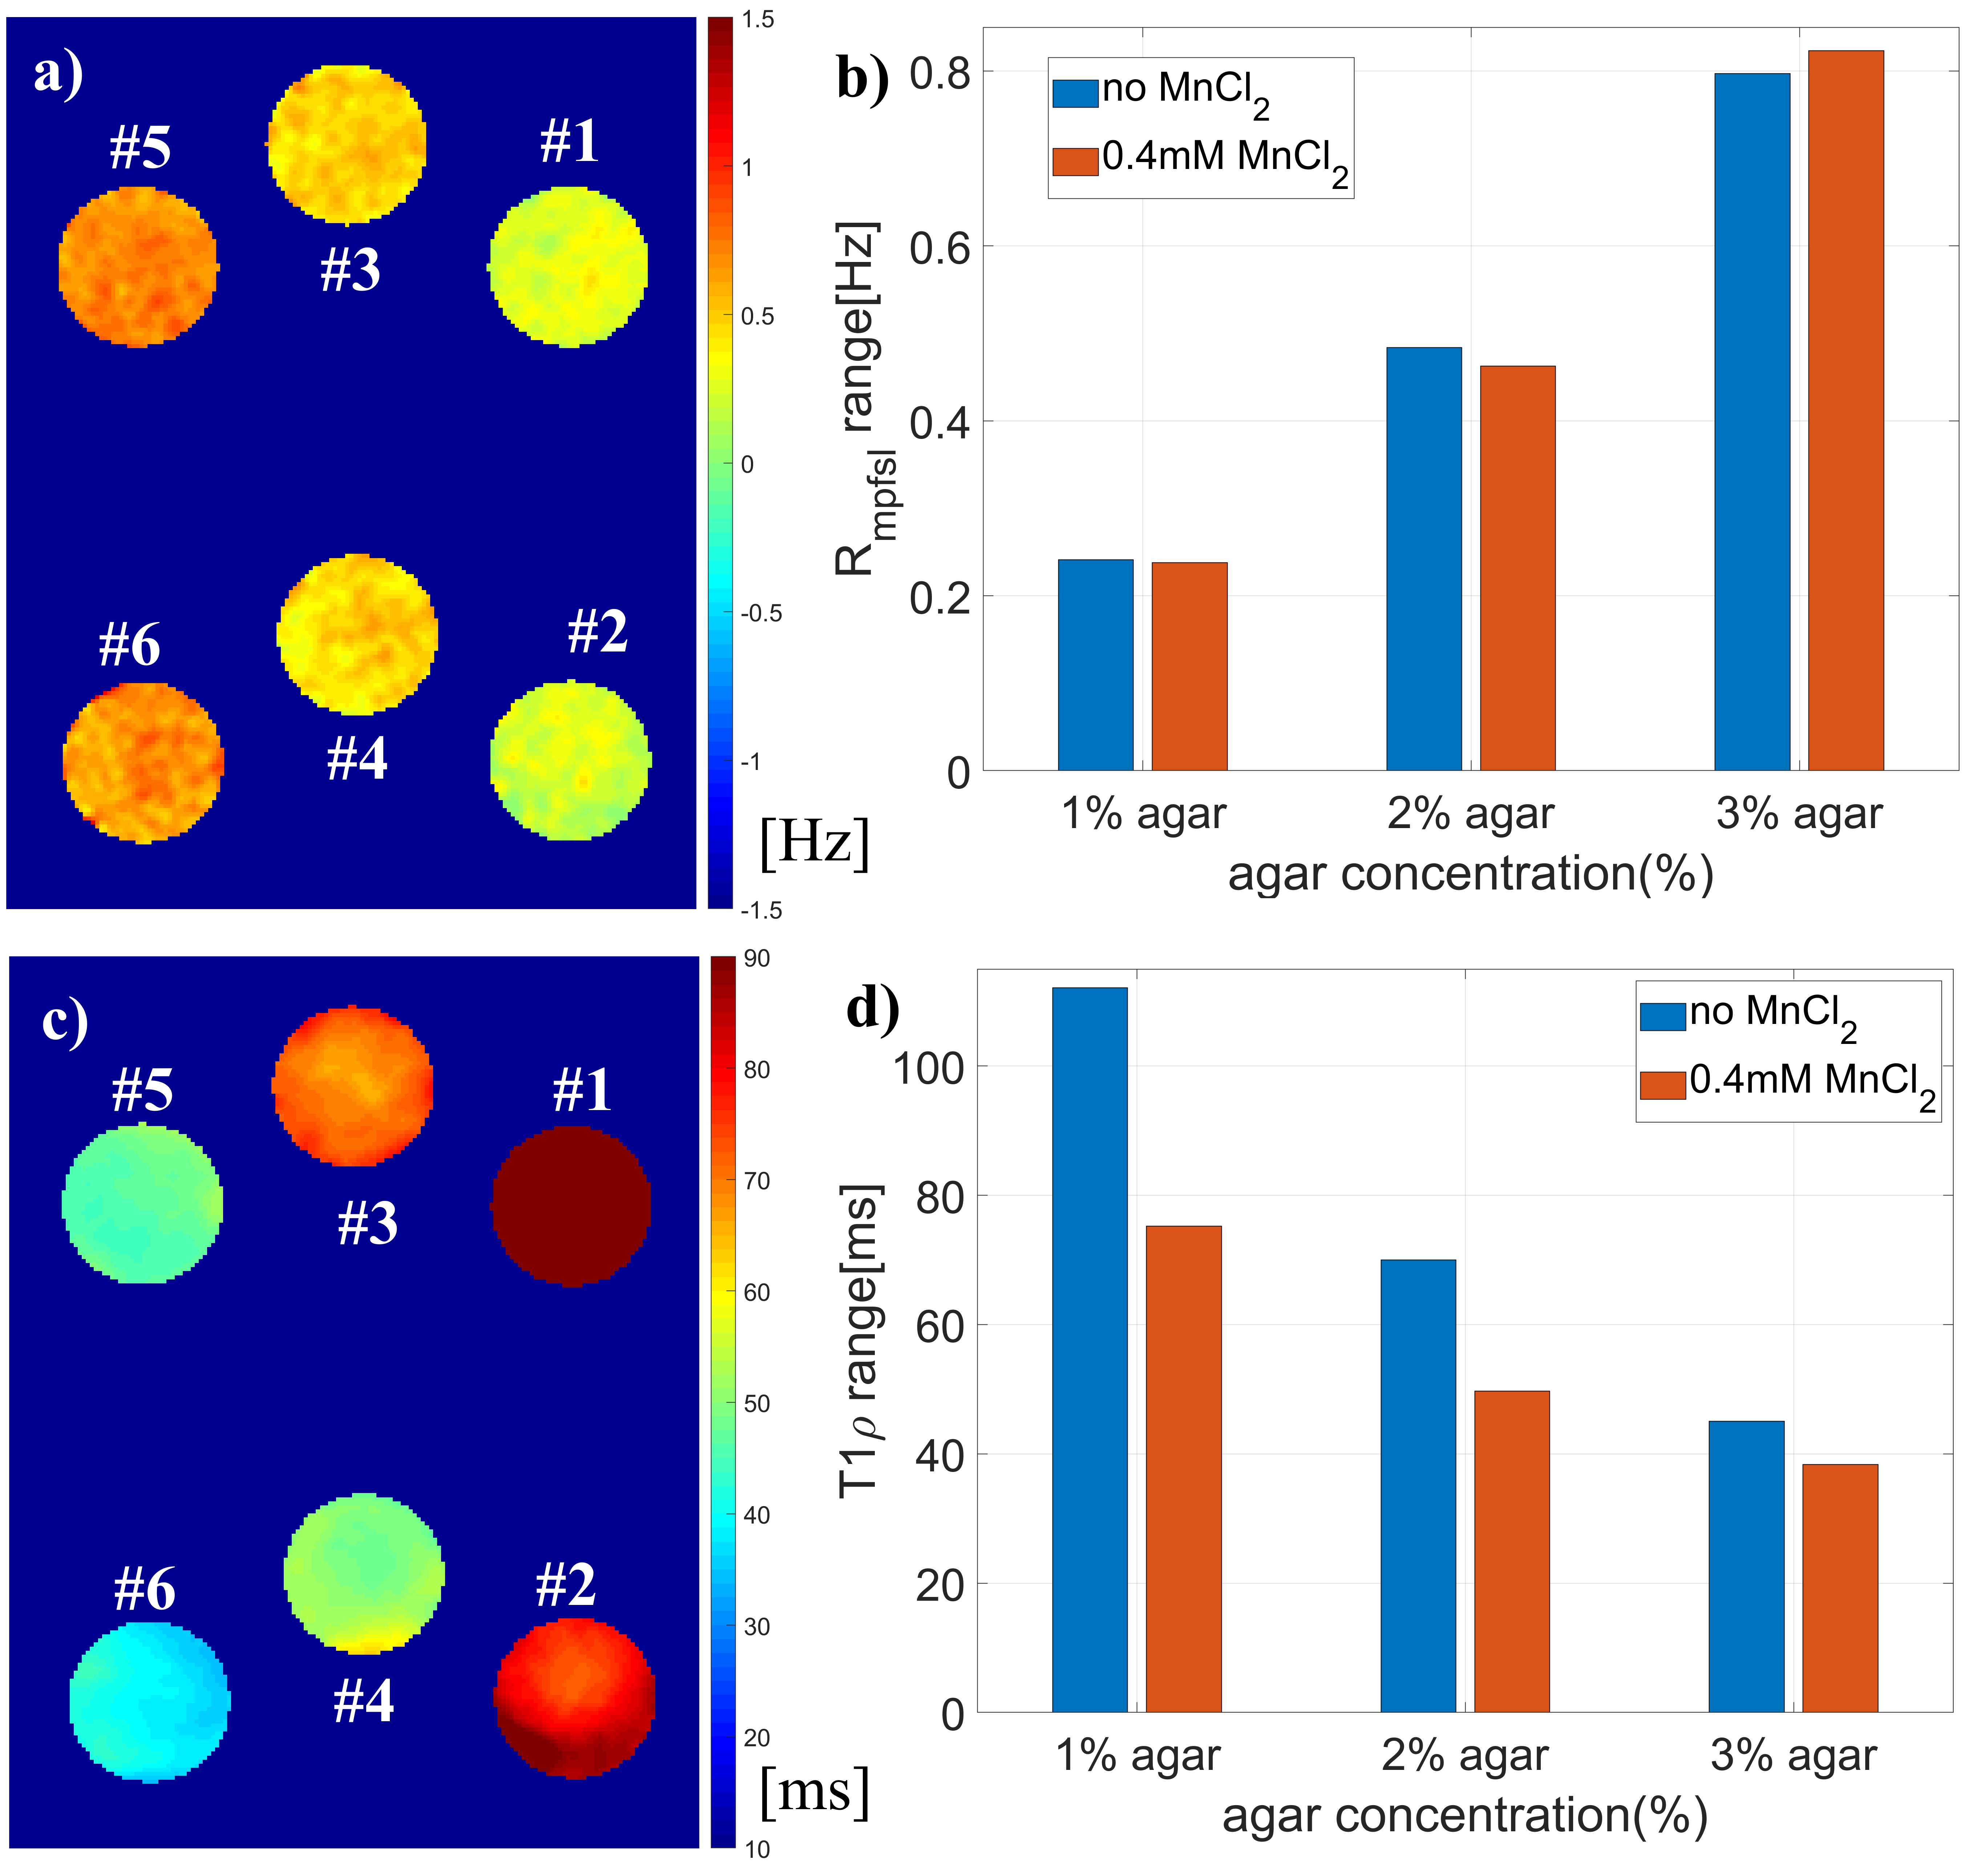
Figure 3: Phantom experiment 2. Six phantoms with agarose
concentration 1% (#1 and #2), 2% (#3 and #4) and 3% (#5 and #6). The water relaxation rate R1 and R2 of 3 phantoms
were modulated by 0.4 mM MnCl2 (#2, #4 and #6) and the other 3 phantoms have no MnCl2 (#1, #3 and #5).
a) and b) are Rmpfsl quantification from MPF-SL. c) and d) are T1rho
measurement. Note Rmpfsl is insensitive to the variation of water
relaxation rate. In contrast, T1rho is affected by both water relaxation rate
and agarose concentration.
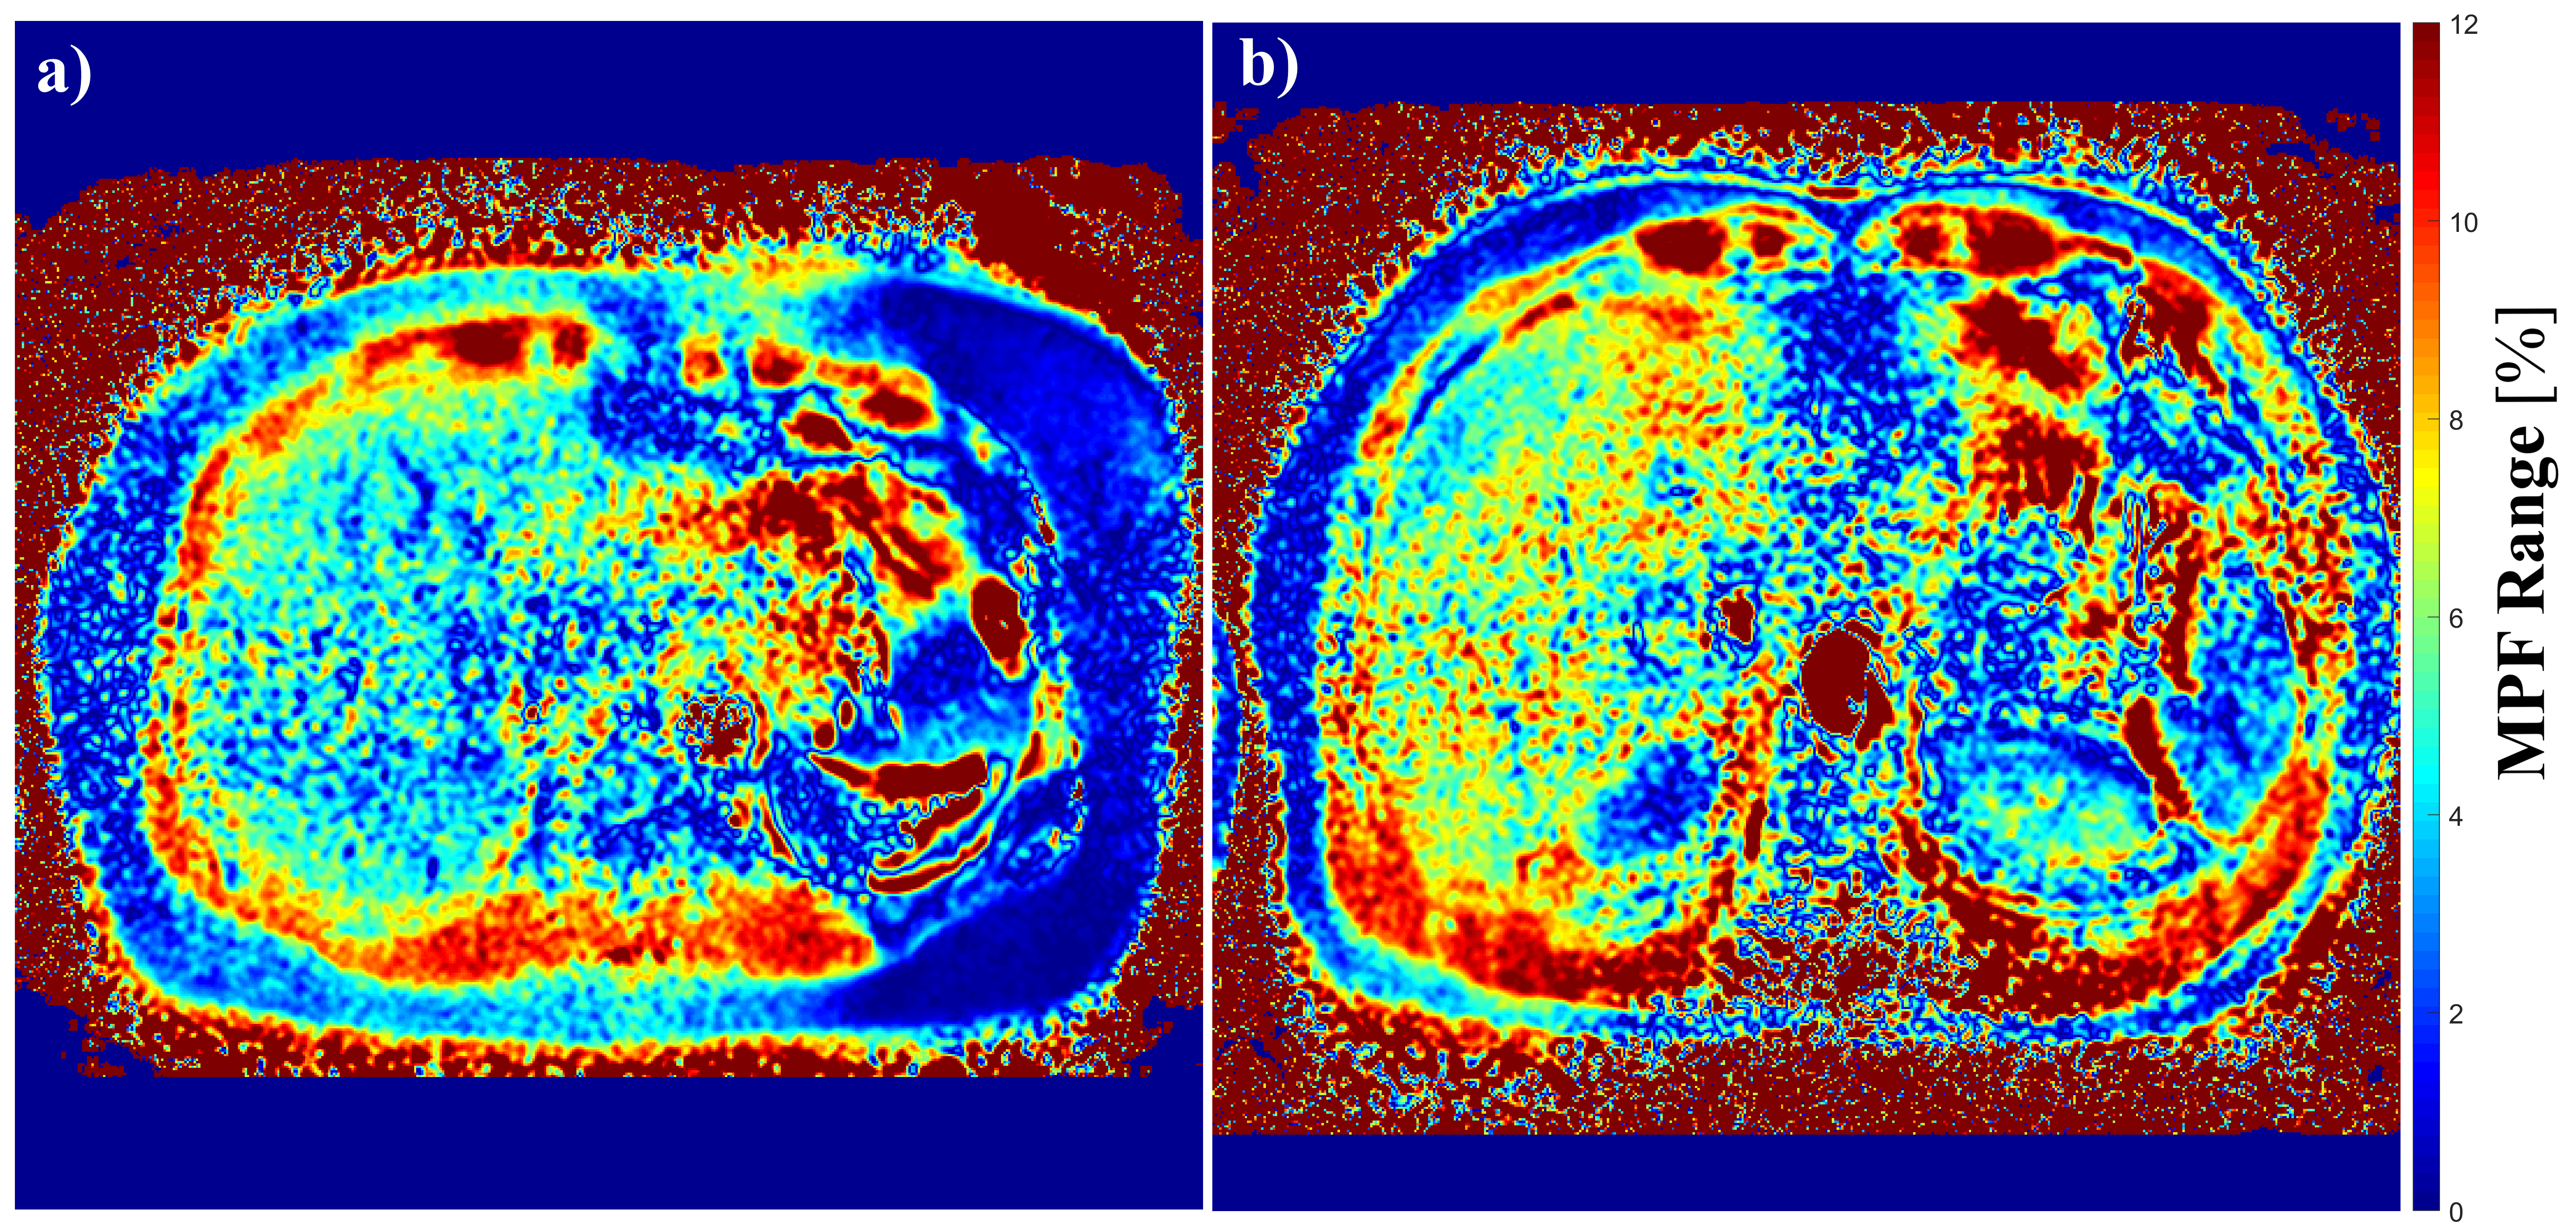
Figure 4: MPF map
of liver from two volunteers. a) The volunteer has no liver fibrosis. b) The
volunteer has liver fibrosis stage F2. Note significantly
elevated MPF in liver in the volunteer with liver fibrosis F2 compared to F0
patient. The signal from muscle are comparable between two subjects. Muscle has
strong MT effect and thus high signal, which is consistent with those reported
in literatures.