3799
Optimization of Keyhole Imaging Parameters for Glutamate Chemical Exchange Saturation Transfer (GluCEST) MRI at 7.0 T1Faculty of Health Sciences and Brain & Mind Centre, The University of Sydney, Sydney, Australia, 2Department of Radiology, Asan Medical Center, University of Ulsan College of Medicine, Seoul, Republic of Korea, 3Convergence Medicine Research Center, Asan Institute for Life Sciences, Asan Medical Center, Seoul, Republic of Korea, 4Department of Convergence Medicine, Asan Medical Center, University of Ulsan College of Medicine, Seoul, Republic of Korea, 5Asan Image Research, Asan Institute for Life Sciences, Asan Medical Center, Seoul, Republic of Korea
Synopsis
We evaluated the effects of a reference image and keyhole factor selections for high-frequency substitution on a keyhole imaging technique for application in glutamate CEST (GluCEST) imaging to reduce data acquisition time. The calculated GluCEST signals and visually inspected results from the reconstructed GluCEST maps indicated that a combination of unsaturated image as a reference image and >50% of keyhole factors showed consistent signals and image quality as opposed to the fully-sampled CEST data. Combining the keyhole imaging technique with GluCEST imaging enables stable image reconstruction and quantitative evaluation, and this approach is potentially implemented in various CEST imaging applications.
INTRODUCTION
Chemical exchange saturation transfer (CEST) imaging requires a long scanning time for collecting the whole voxel data at multiple frequency offsets. Here, to provide an approach for solving this issue, we investigated the effect of a reference image and keyhole factor selections on CEST results with respect to the application of keyhole technique1,2 in pre-clinical glutamate CEST (GluCEST) data acquisition. We evaluated the selection of appropriate parameters for implementing the keyhole imaging technique in the GluCEST experiment conducted for the healthy control rat group and demonstrated the feasibility of implementing keyhole imaging combined with GluCEST by applying the selected optimal parameters to the status epilepticus (SE) rat group.METHODS
CEST Imaging: All MR data acquisitions were conducted using a Bruker 7-T MRI scanner. For CEST data acquisition, a fat-suppressed RARE sequence with a continuous-wave RF saturation pulse (power/time=3.6 μT/1 s) was applied to 21 frequency offsets (−3.67 to +3.67-ppm; 0.33-ppm increments), and an unsaturated image (S0 image) was obtained. For B0- and B1-field inhomogeneity correction, B0 map was acquired using the double TEs (1.9 and 2.6-ms) method, and B1 map was acquired using the double flip-angle (30° and 60°) method.3,4Keyhole Imaging: We controlled the following two keyhole imaging parameters: 1) keyhole factor (Kf), which is the ratio of the completely sampled encoding steps to the encoding steps of low frequencies in the central portion and 2) selection of reference image, for which the range of Kf varied from 16.67% (Kf = 6) to 75% (Kf = 1.3) of the complete k-space. The reference images corresponding to −3 ppm and +3 ppm images and unsaturated image were respectively selected. For comparing the results by keyhole imaging, the zero-padding algorithm was also applied to the missing k-space lines in the images collected at low frequencies.5
Animal Imaging: Ten male Sprague–Dawley rats were used and randomized into two groups [healthy control (CTRL); n = 6 and SE group (i.p. injection of kainic-acid); n = 4]. The keyhole imaging technique was first applied to the brain data of the CTRL rats for evaluating the effect of Kf and reference image selections. Subsequently, the best-performing approach was demonstrated in the brain data of SE rats.
Data Processing: GluCEST signal was calculated in the region of interest (ROI), which was carefully drawn in the hippocampus region using the following equation: GluCEST(%)=100 × [(S-ω - S+ω)/S-ω], where S±ω are signals at ±3.0 ppm.3 GluCEST contrast was corrected by relative B1 values that were calculated based on the B1 map.3 For estimating the keyhole-GluCEST fidelity, artifact power (AP) between the reconstructed images of keyhole-GluCEST and a fully sampled image was calculated within whole brain regions using the following equation: AP = Ʃ||Ifully-sampled(x,y)| - |Ikeyhole(x,y)||2 / Ʃ|Ifully-sampled(x,y)|2, where Ifully-sampled is the fully sampled image without keyhole imaging, and Ikeyhole is the image reconstructed using the keyhole imaging.6,7
RESULTS AND DISCUSSION
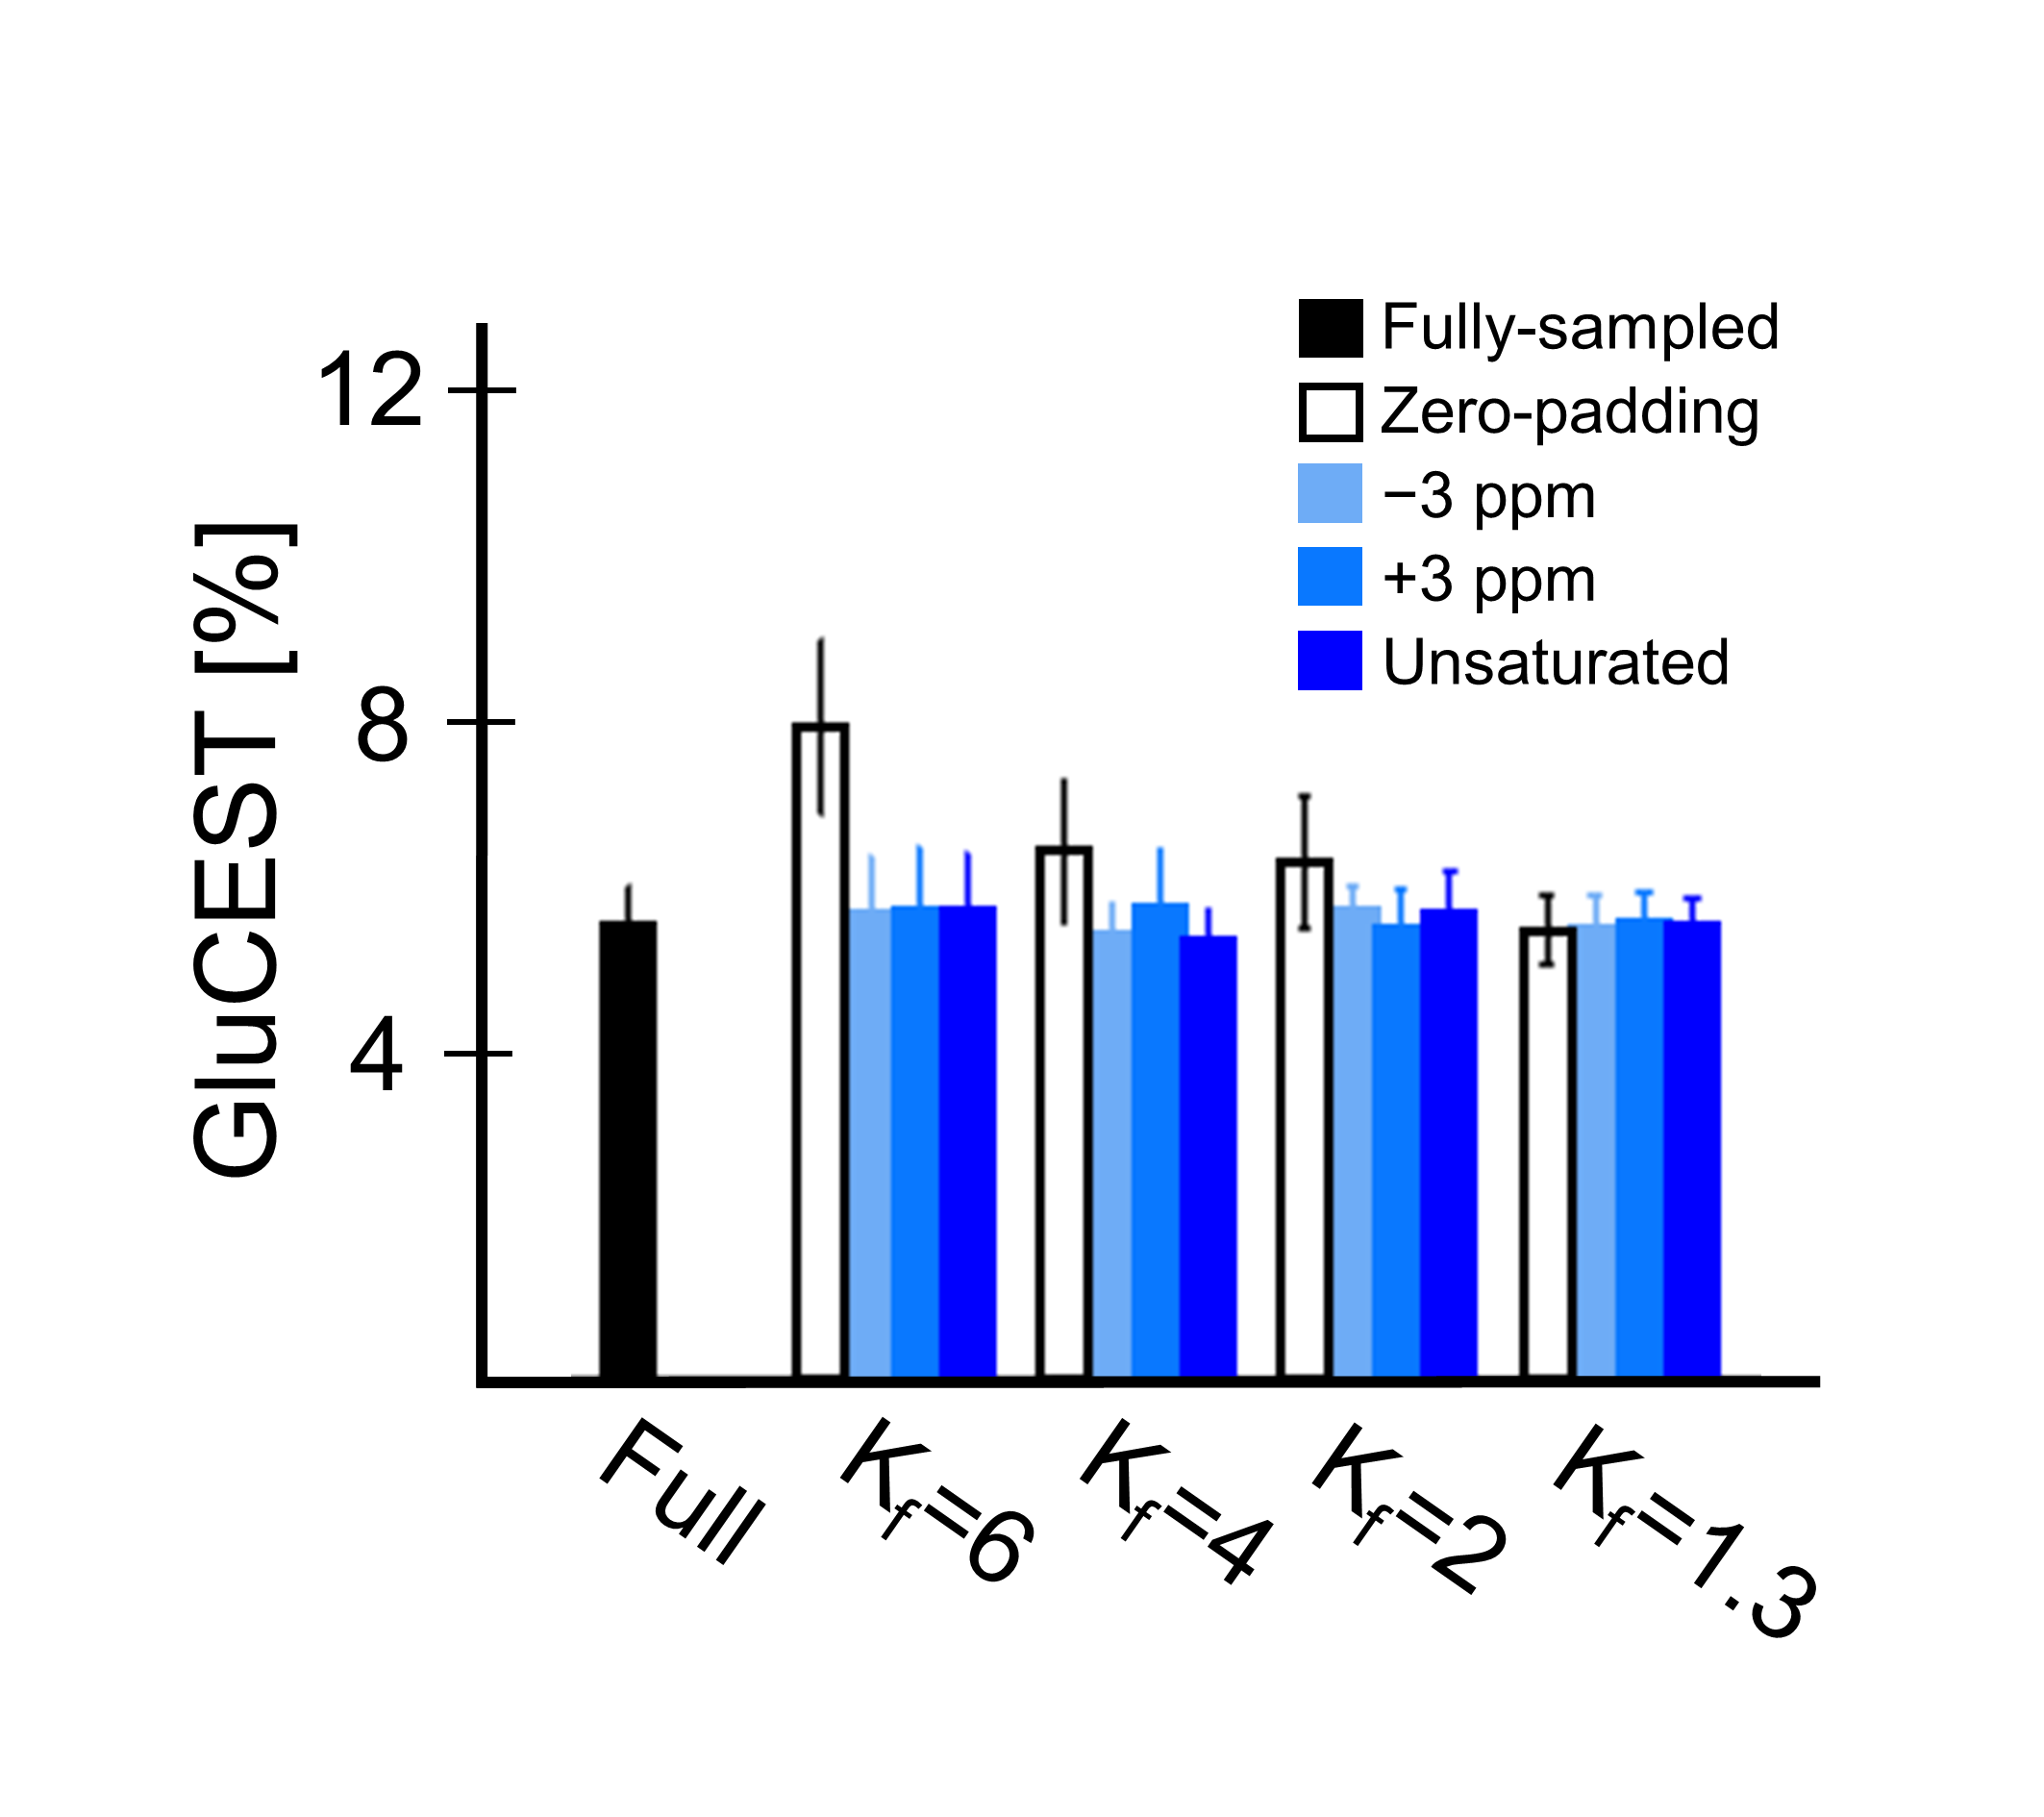
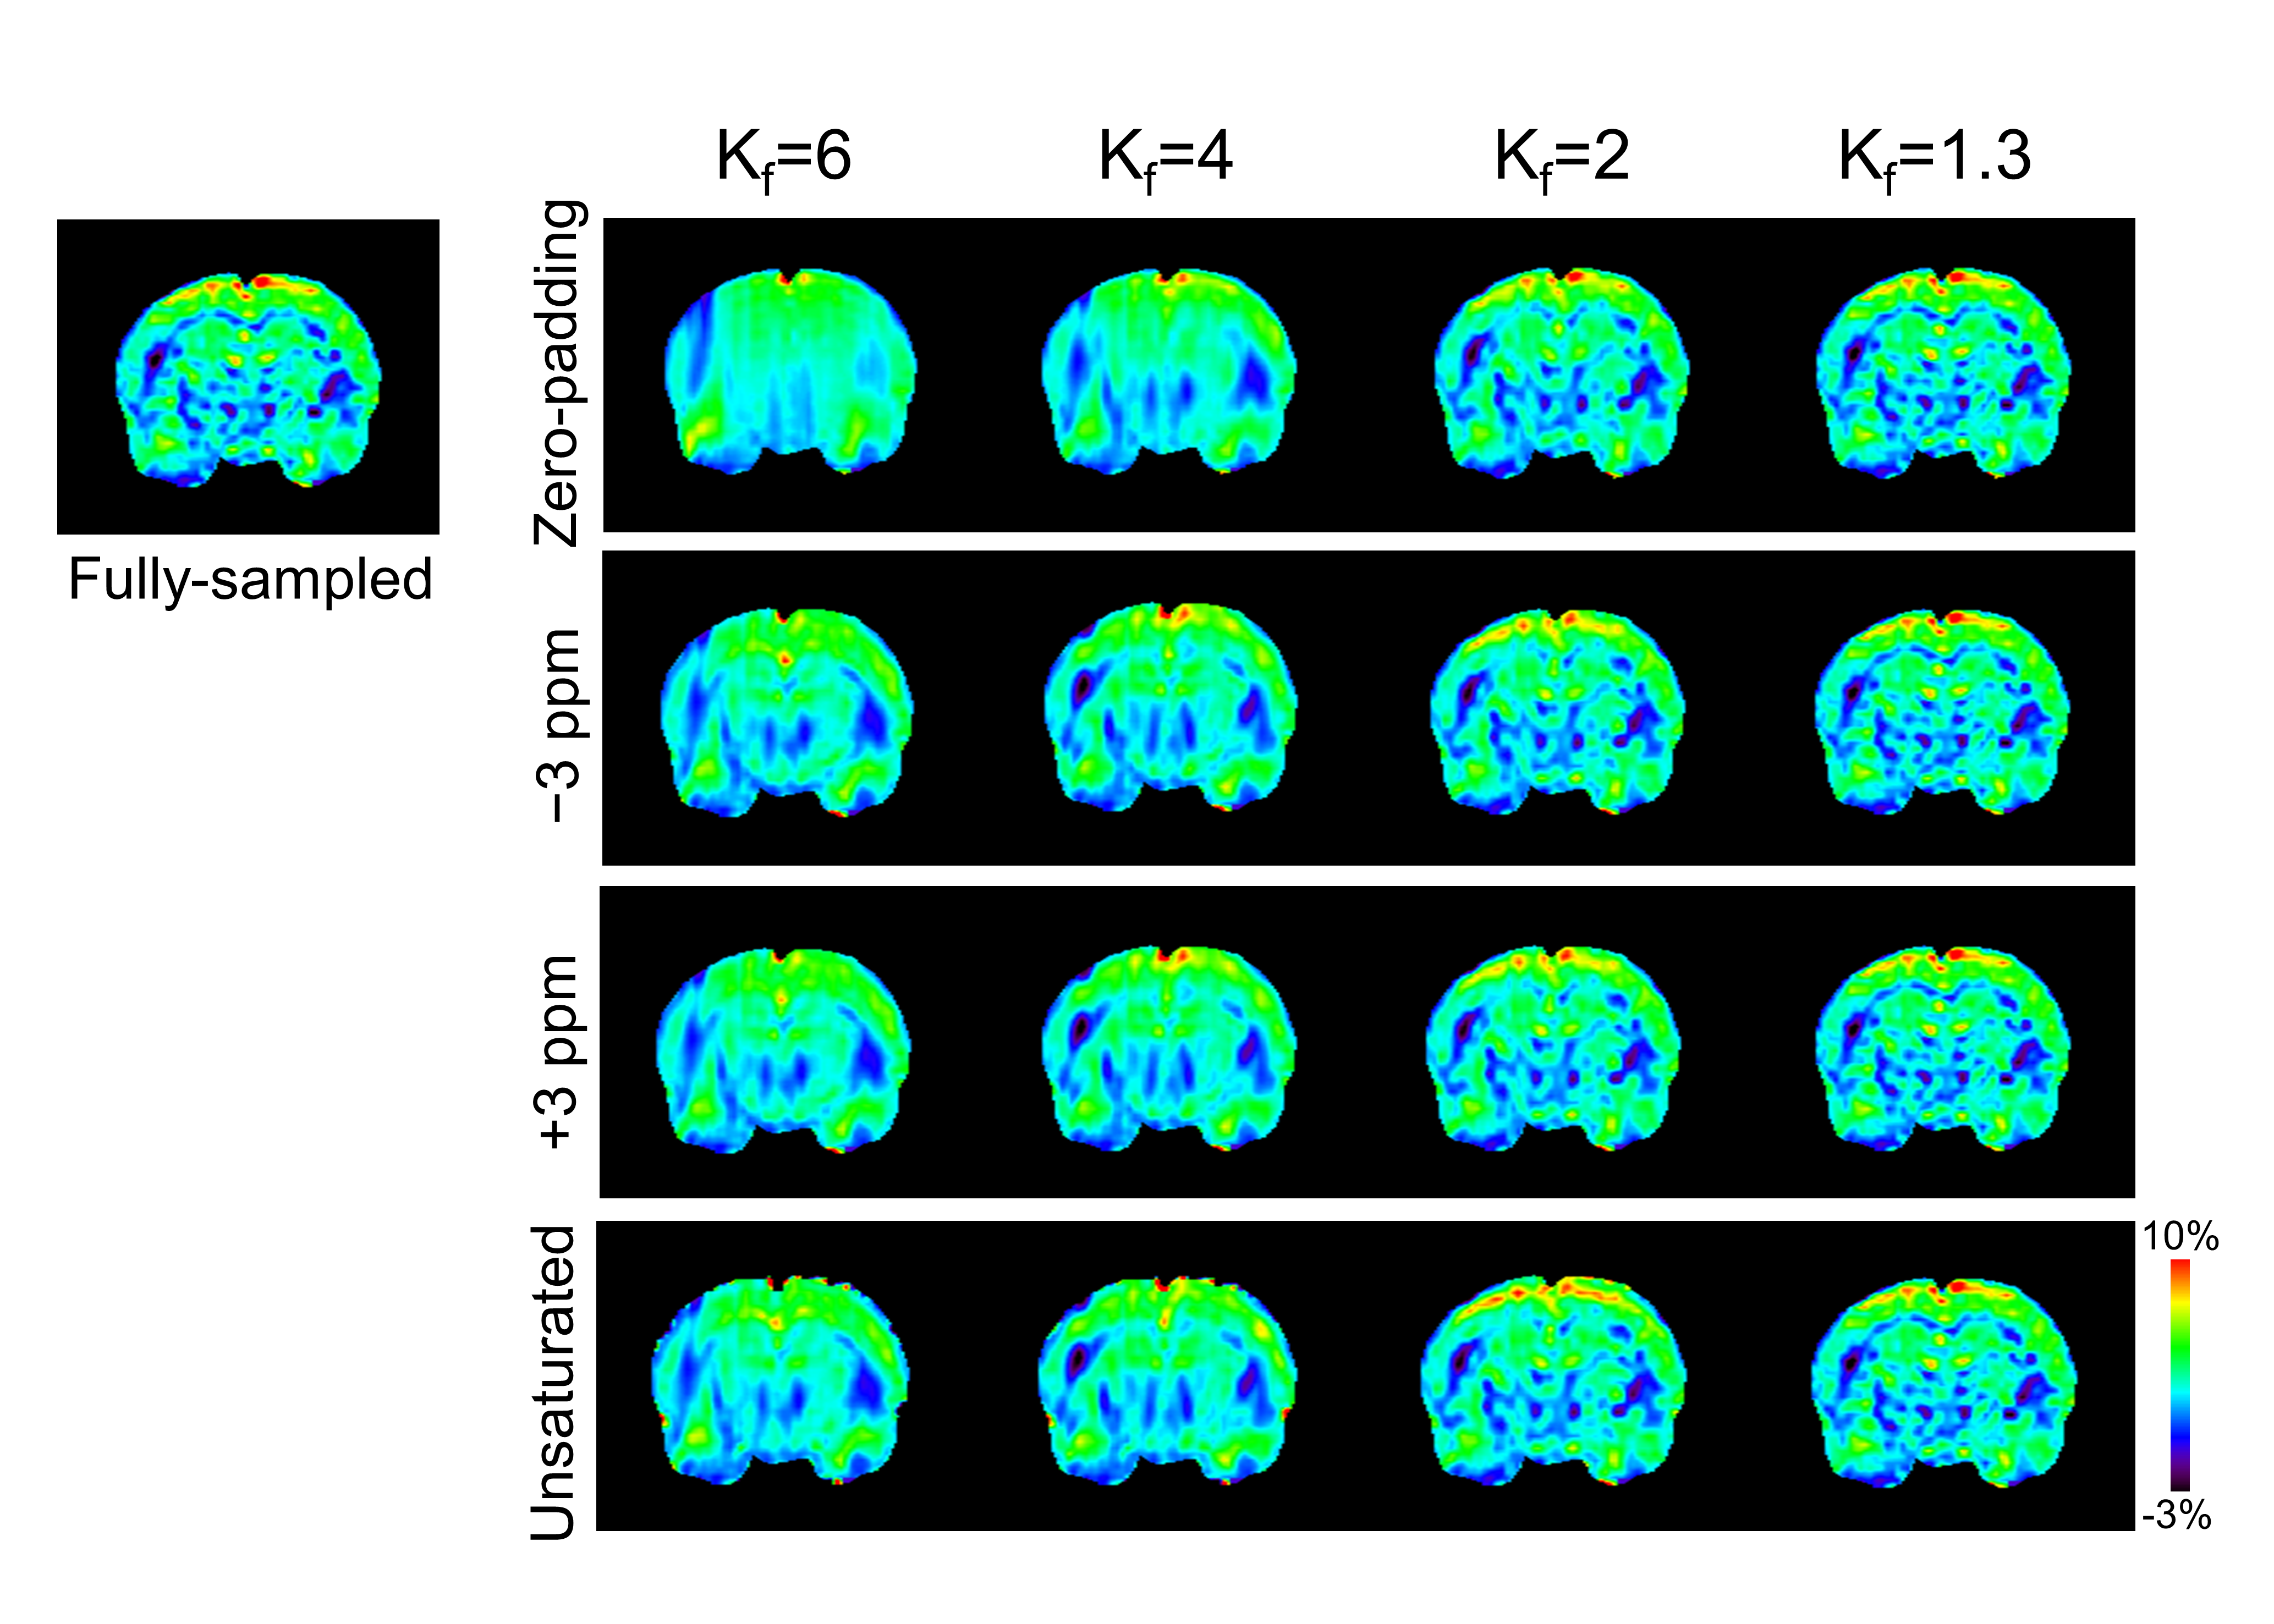
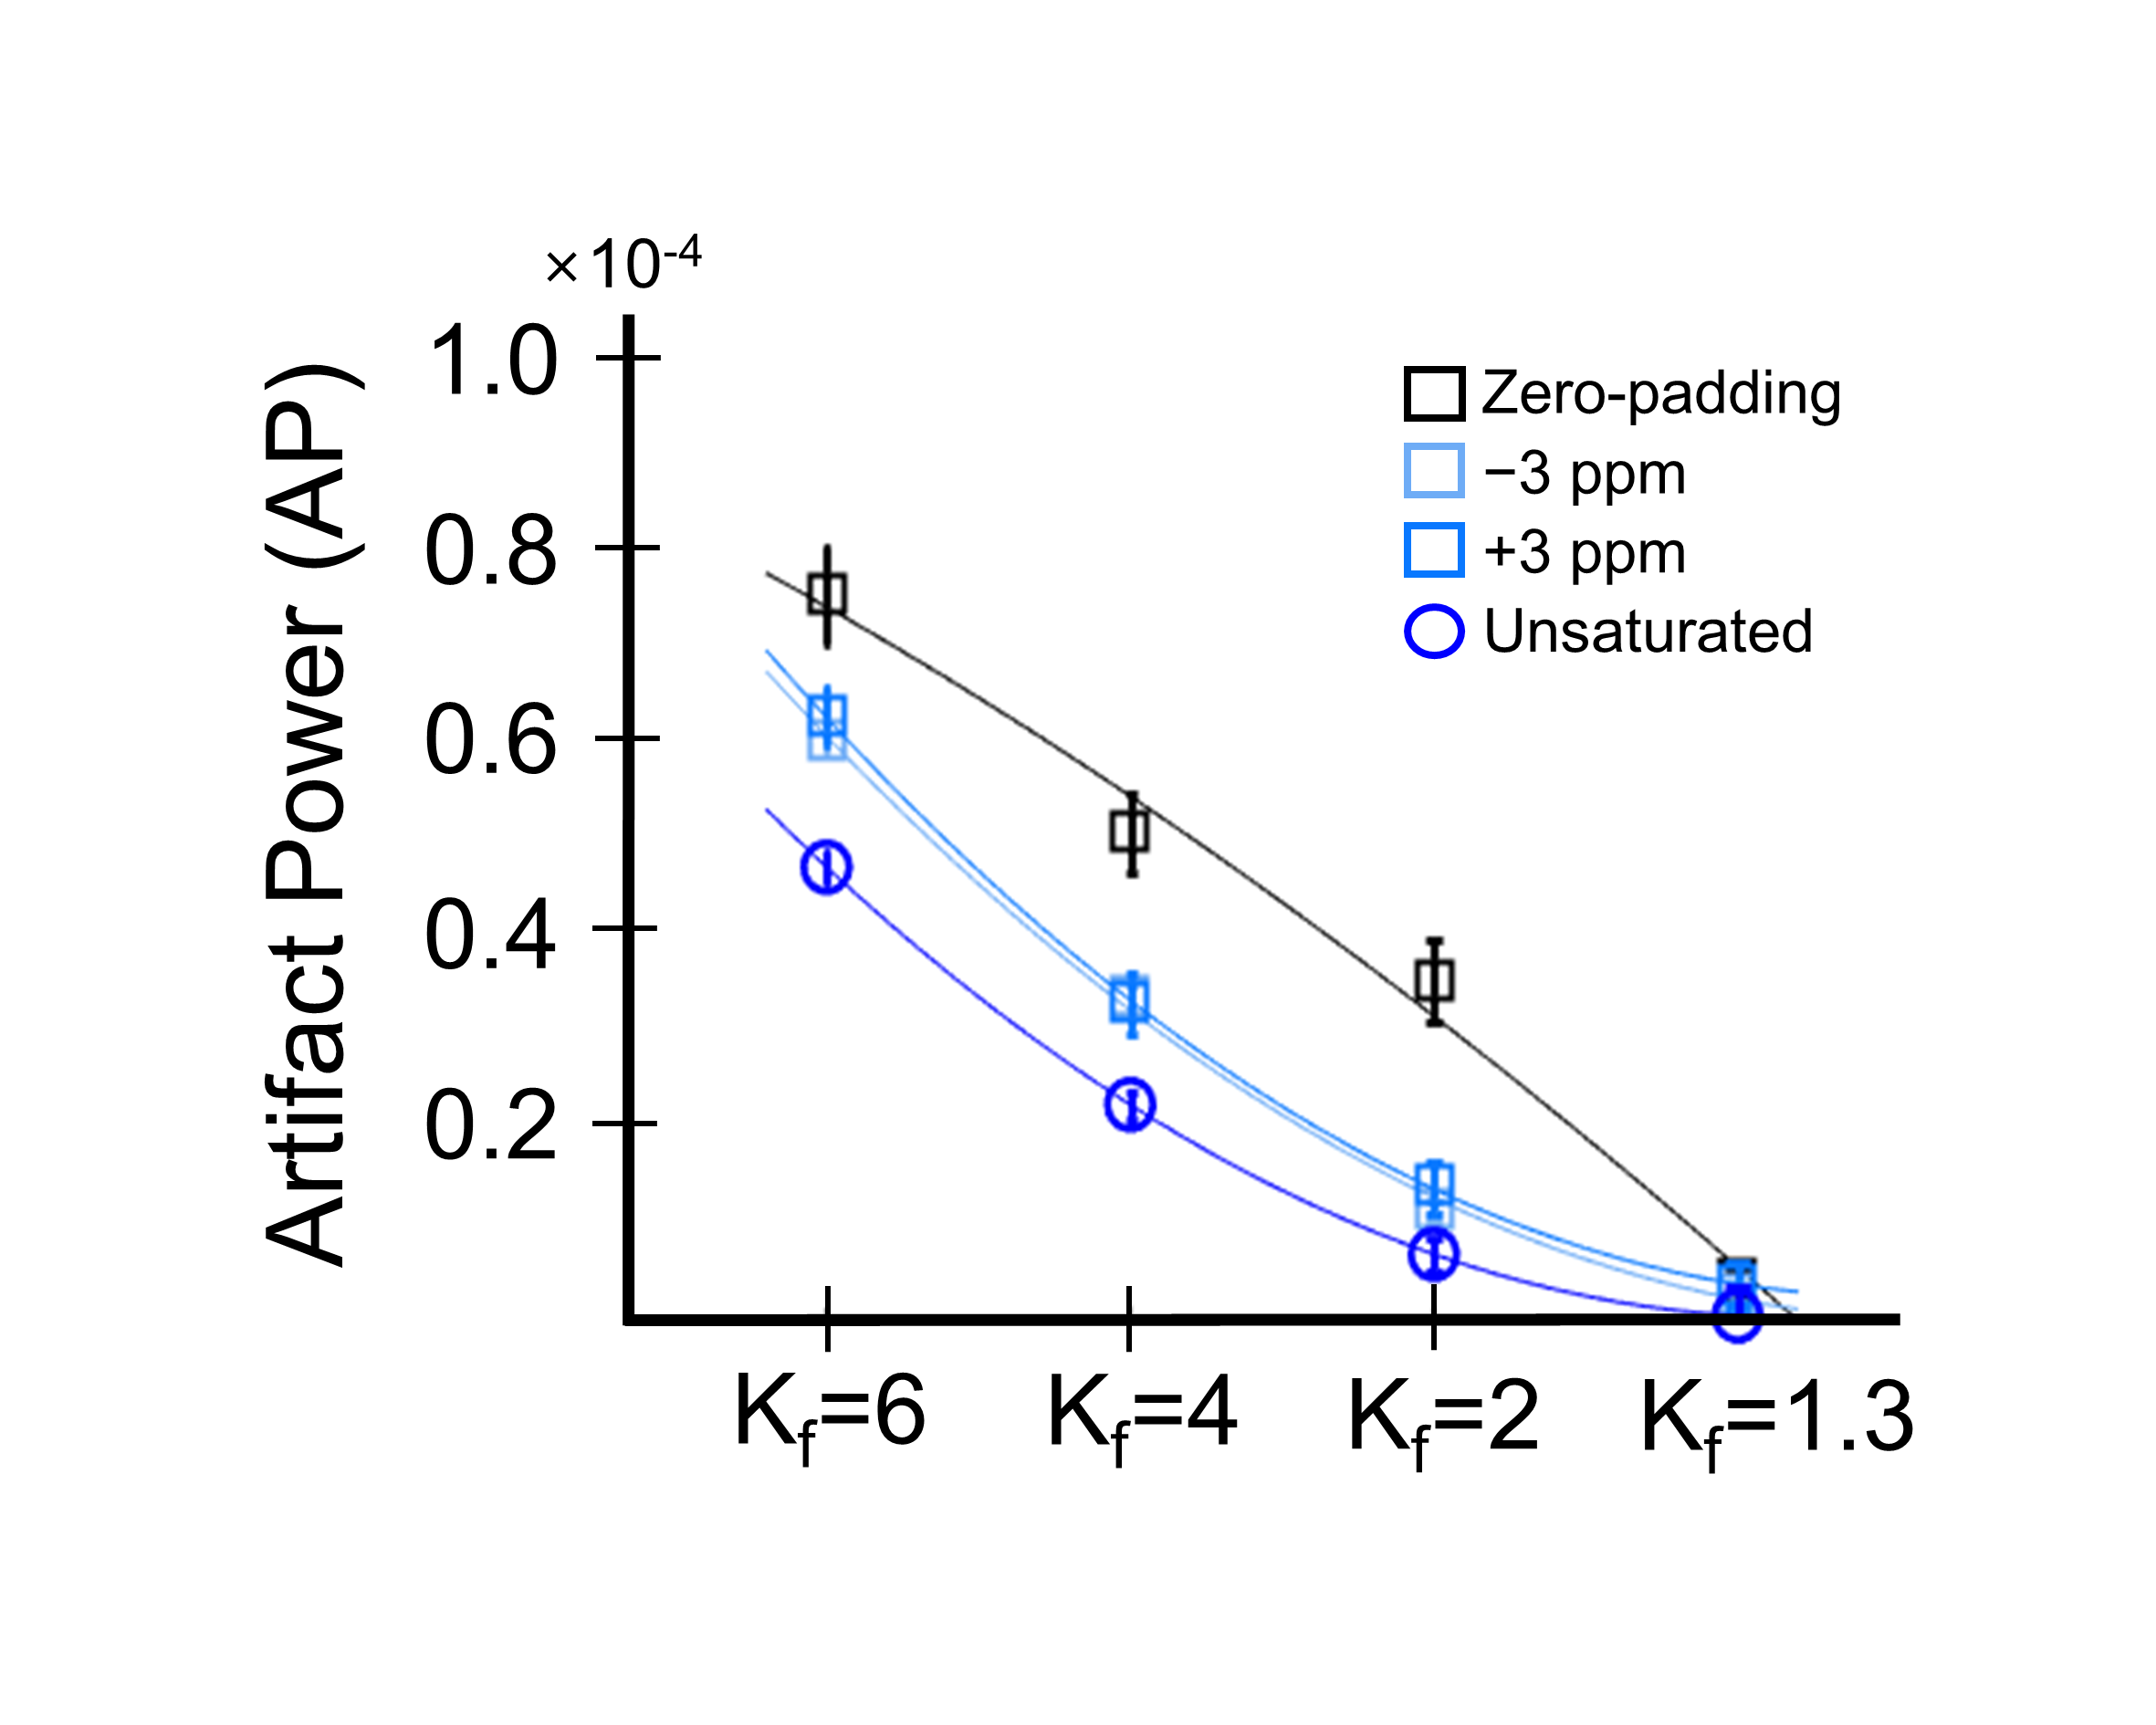
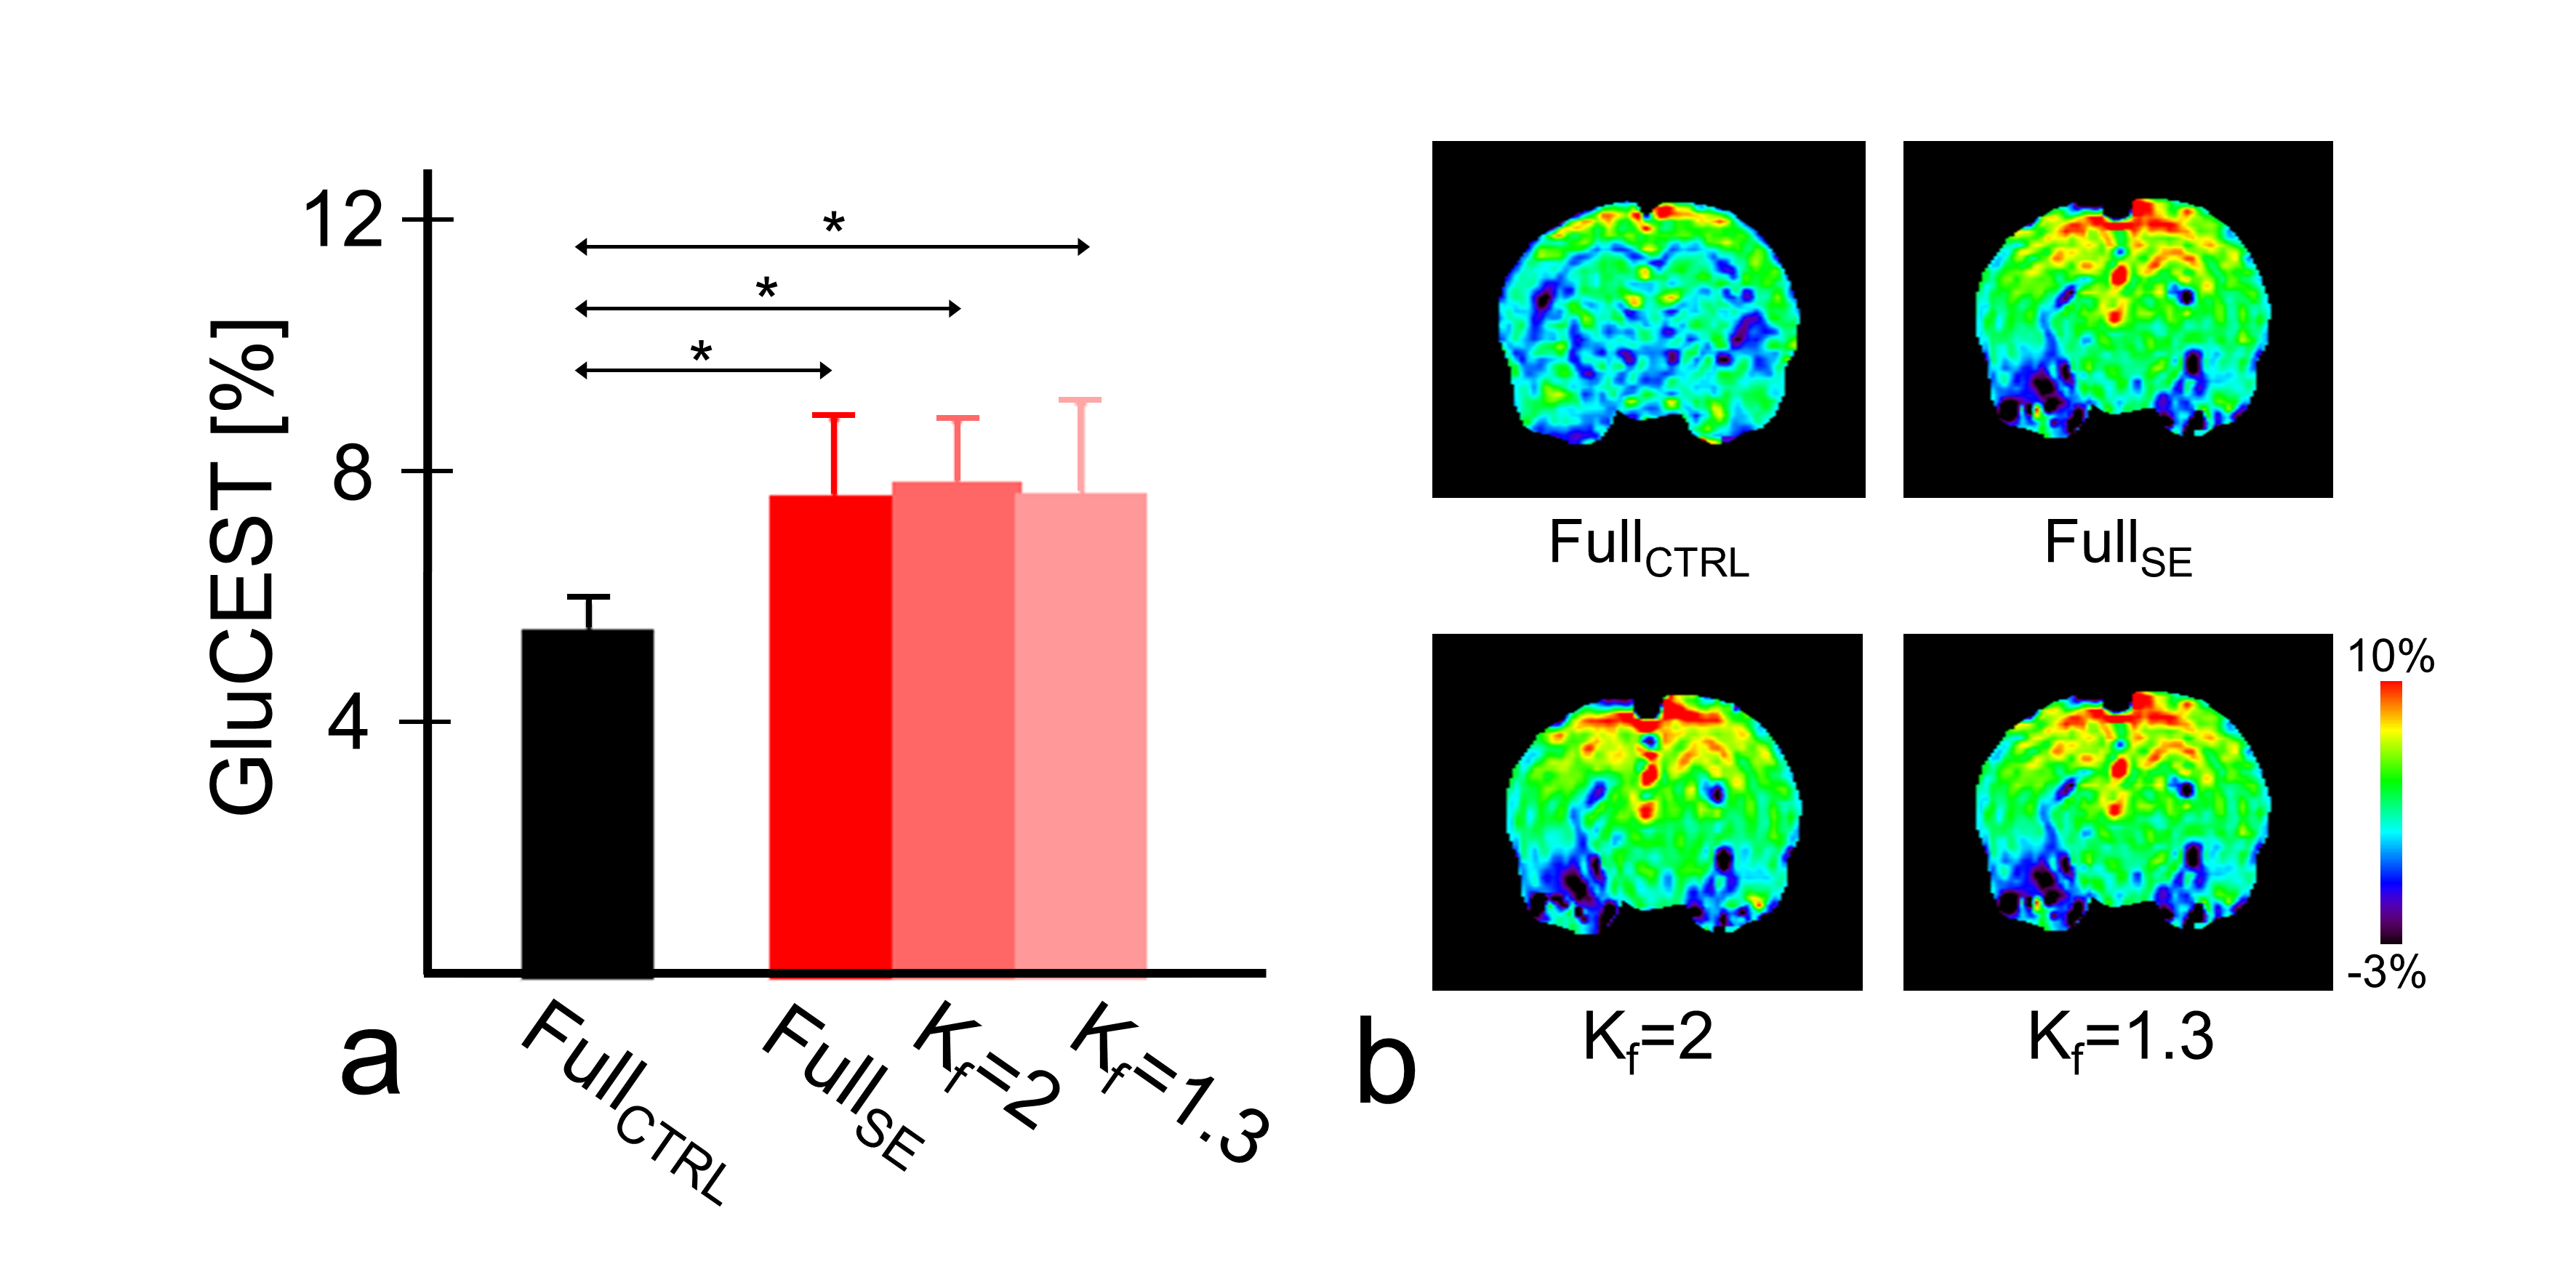
GluCEST results of various Kf values and selected reference images are similar to those of the fully sampled data and without statistical significance (Fig.1; all p ≥ 0.655). However, while using zero-padding technique, GluCEST values decrease as Kf changes. Furthermore, GluCEST value at Kf = 1.3 is similar across the results obtained from different selected reference images and that from the fully sampled data. Compared with the reconstructed maps of fully-sampled data (Fig.2), the images appear blurry, regardless of reference image selection, when Kf is >4, and the boundaries of anatomical structures are not clearly visible. Such blurring in the reconstructed images are more dominant in case of zero-padding than in other reference images. The results with Kf = 2 and Kf = 1.3 demonstrate relatively clear anatomical structures in the brain. In all cases, AP value declines as Kf decreases (Fig.3). In the results obtained via zero-padding, AP values are relatively higher than those obtained from other reference images. There is no significant difference in the Kf range, when images at −3 ppm or +3 ppm are selected as reference images. Notably, in the results obtained using the unsaturated image as reference, AP values for all Kf changes were lower than those obtained using other reference images. Additionally, we compared CEST data acquisition time between fully-sampled data and keyhole-GluCEST data. According to change in Kf, the scan time can be reduced by approximately 80% when using Kf = 6. However, considering all the results of this study, the scan time with reasonable image quality and quantified glutamate signal is reduced by approximately 48% when a minimum Kf value of 2 was applied. Keyhole-GluCEST values in the SE group corresponding to Kf changes show a similar level, which is not significantly different from that associated with the fully-sampled data (Fig.4; all p ≥ 0.992). Moreover, GluCEST values of the SE group corresponding to the fully-sampled data and two different keyhole factors are significantly different from those of the CTRL group (all p ≤ 0.033).CONCLUSION
We demonstrated the application of keyhole imaging technique in GluCEST at 7-T. Our results indicated that substituting high-frequency information in an unsaturated image and updating it with CEST data comprising at least 50% of data collected at low frequencies facilitated a stable reconstruction of consistent CEST signal and image quality.Acknowledgements
This work was supported by grants from the Basic Science Research Program through the National Research Foundation of Korea [NRF-2018R1C1B6004521 and NRF-2018R1A2B2007694], funded by the Korea Government (MSIT).References
1. Hu X. On the "keyhole" technique. J Magn Reson Imaging. 1994;4(2):231.
2. Varma G, Lenkinski RE, Vinogradov E. Keyhole chemical exchange saturation transfer. Magn Reson Med 2012;68(4):1228-33.
3. Cai K, Haris M, Singh A, Kogan F, Greenberg JH, Hariharan H, Detre JA, Reddy R. Magnetic resonance imaging of glutamate. Nat Med. 2012;18(2):302.
4. Singh A, Cai K, Haris M, Hariharan H, Reddy R. On B1 inhomogeneity correction of in vivo human brain glutamate chemical exchange saturation transfer contrast at 7T. Magn Reson Med. 2013;69(3):818-24.
5. Du YP, Parker DL, Davis WL, Cao G. Reduction of partial-volume artifacts with zero-filled interpolation in three-dimensional MR angiography. J Magn Reson Imaging. 1994;4(5):733-41.
6. Park J, Zhang Q, Jellus V, Simonetti O, Li D. Artifact and noise suppression in GRAPPA imaging using improved k-space coil calibration and variable density sampling. Magn Reson Med. 2005;53(1):186-93.
7. Xiao Z, Hoge WS, Mulkern RV, Zhao L, Hu G, Kyriakos WE. Comparison of parallel MRI reconstruction methods for accelerated 3D fast spin-echo imaging. Magn Reson Med. 2008;60(3):650-60.
Figures